Exhibit 99.1
Richard Montoni,President &
Chief Executive Officer Bruce Caswell,Health Services Segment President
& General Manager MAXIMUS Investor Presentation A number of statements
being made today will be forward-looking in nature. Such statements are
only predictions and actual events or results may differ materially as a
result of risks we face, including those discussed in our SEC filings.
We encourage you to review the summary of these risks in Exhibit 99.1 to
our most recent Form 10-K filed with the SEC. The Company does not
assume any obligation to revise or update these
forward-looking statements to reflect subsequent events or
circumstances. Barclays Global Healthcare Conference March 12, 2013
Miami 1
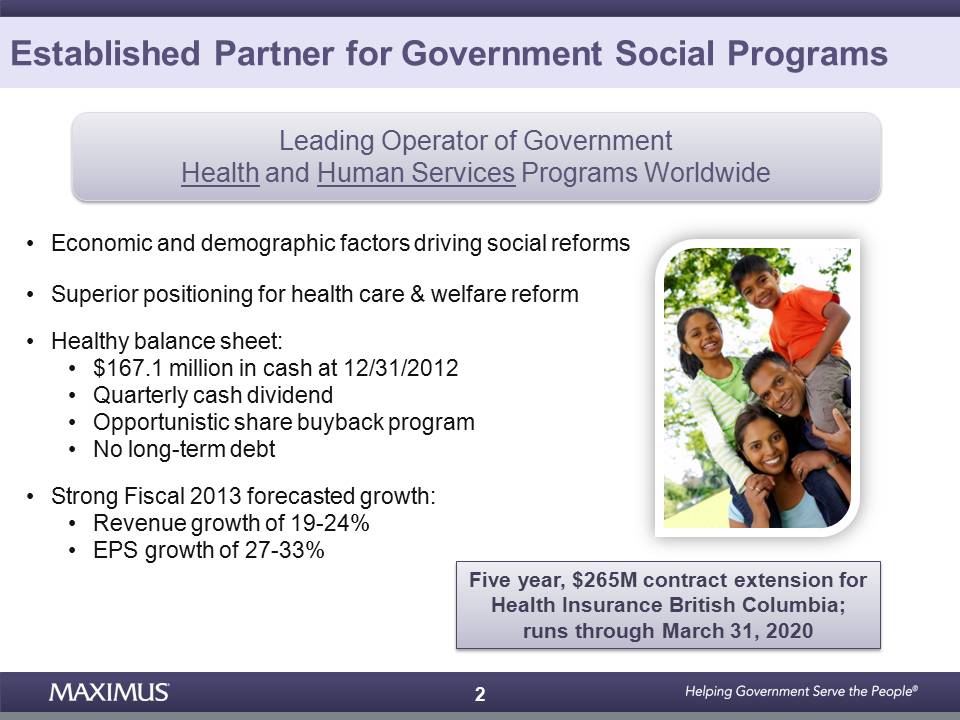
2• Economic and demographic
factors driving social reforms• Superior positioning for health care &
welfare reform• Healthy balance sheet:• $167.1 million in cash at
12/31/2012• Quarterly cash dividend• Opportunistic share buyback
program• No long-term debt• Strong Fiscal 2013 forecasted growth:•
Revenue growth of 19-24%• EPS growth of 27-33% Established Partner for
Government Social Programs Leading Operator of Government Health and
Human Services Programs Worldwide Five year, $265M contract extension
for Health Insurance British Columbia; runs through March 31, 2020
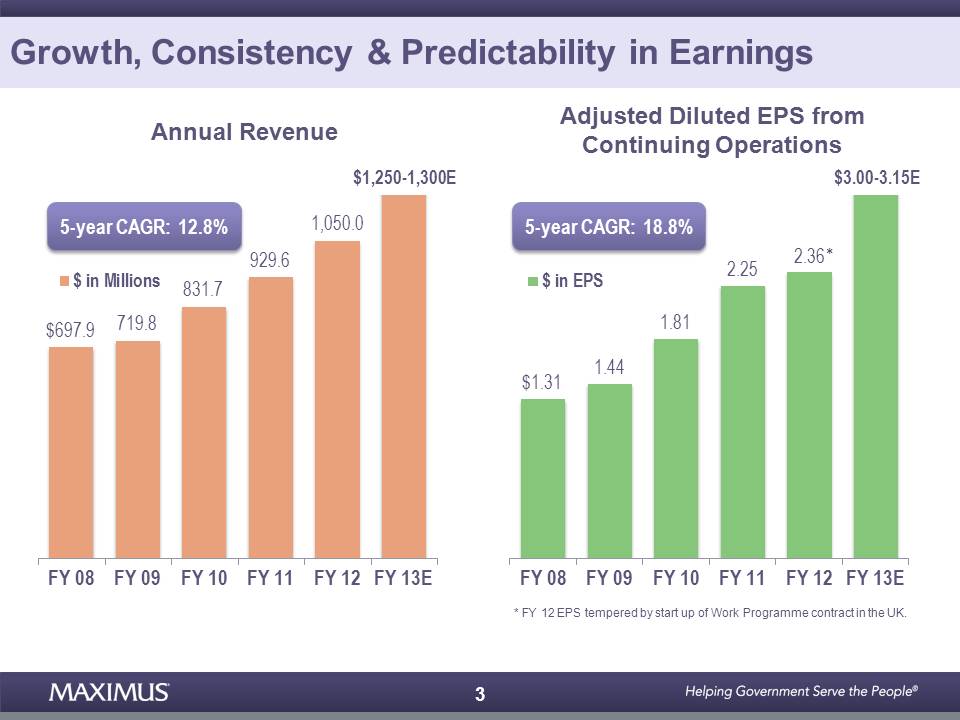
3 $697.9 719.8 831.7 929.6
1,050.0 FY 08 FY 09 FY 10 FY 11 FY 12 FY 13E $ in Millions $1.31 1.44
1.81 2.25 2.36 FY 08 FY 09 FY 10 FY 11 FY 12 FY 13E $ in EPS Annual
Revenue Adjusted Diluted EPS from Continuing Operations * FY 12 EPS
tempered by start up of Work Programme contract in the UK. 5-year CAGR:
11.7% 5-year CAGR: 12.8% 5-year CAGR: 11.7% 5-year CAGR: 18.8%
$3.00-3.15E Growth, Consistency & Predictability in Earnings
$1,250-1,300E *
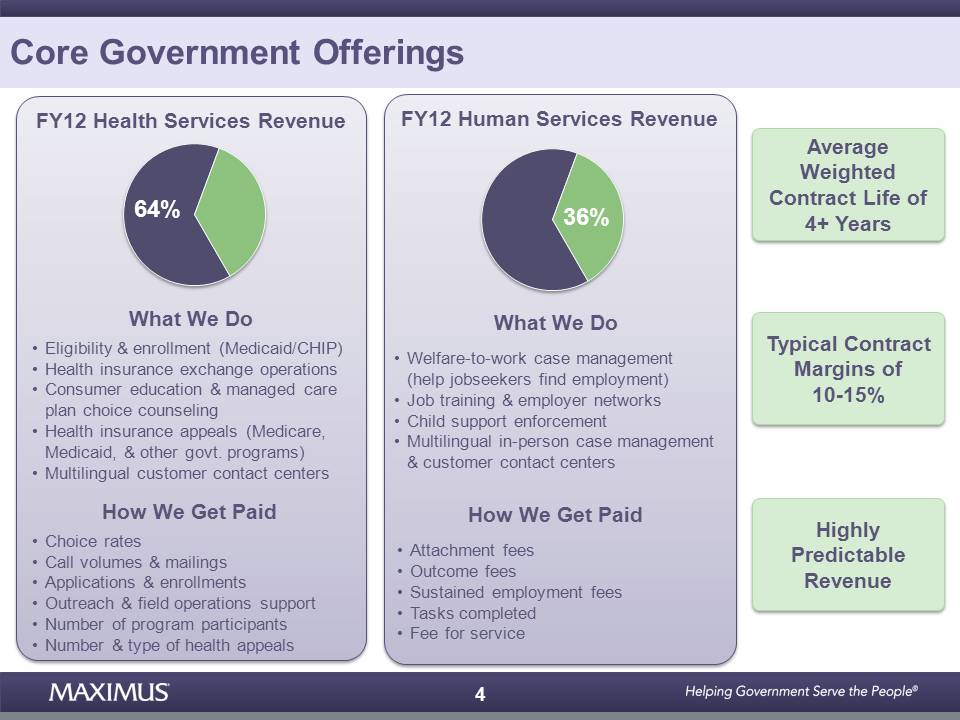
4 Highly Predictable
Revenue FY12 Health Services Revenue What We Do• Eligibility &
enrollment (Medicaid/CHIP)• Health insurance exchange operations•
Consumer education & managed careplan choice counseling• Health
insurance appeals (Medicare, Medicaid, & other govt. programs)•
Multilingual customer contact centersHow We Get Paid• Choice rates• Call
volumes & mailings• Applications & enrollments• Outreach & field
operations support• Number of program participants• Number & type of
health appeals 64% FY12 Human Services Revenue What We Do•
Welfare-to-work case management (help jobseekers find employment)• Job
training & employer networks • Child support enforcement• Multilingual
in-person case management & customer contact centers How We Get Paid•
Attachment fees• Outcome fees• Sustained employment fees• Tasks
completed• Fee for service 36% Core Government Offerings Typical
Contract Margins of 10-15% Average Weighted Contract Life of 4+ Years
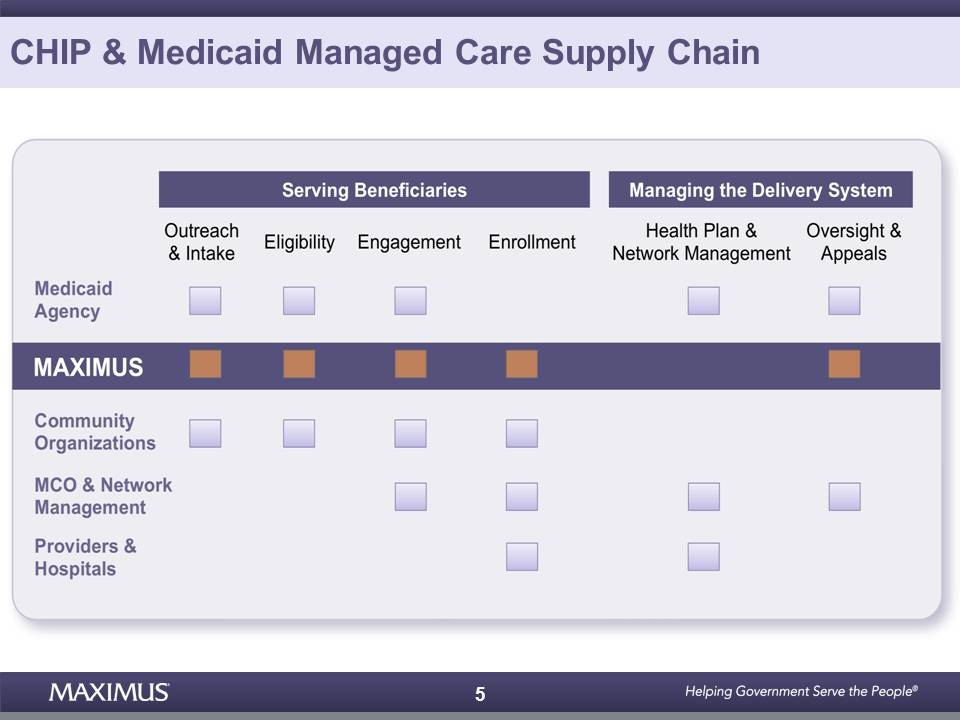
5 CHIP & Medicaid Managed
Care Supply Chain
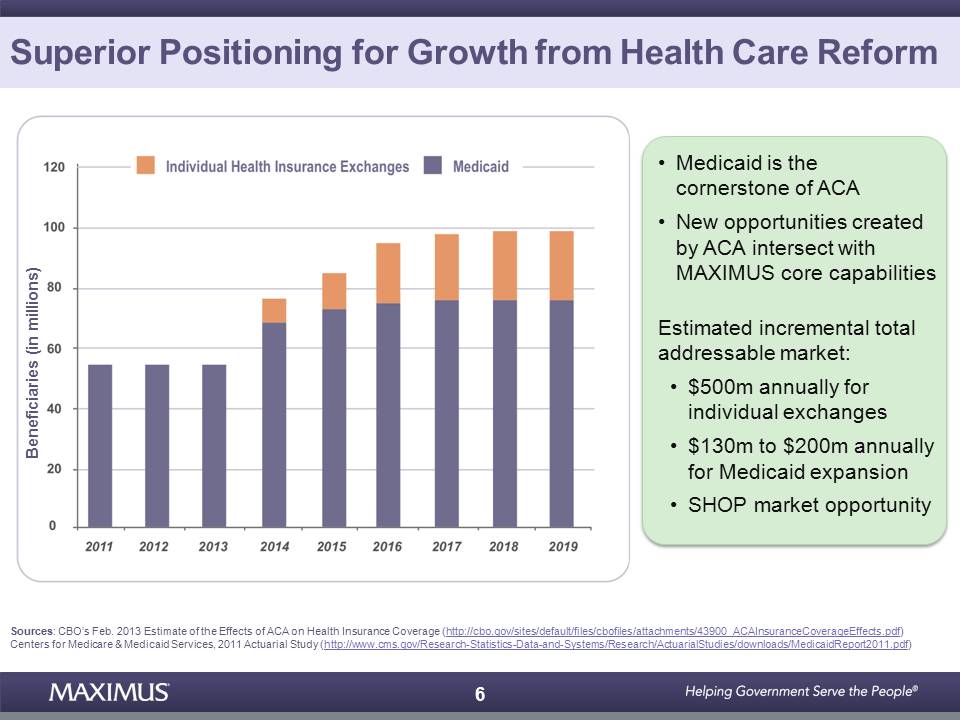
6 Sources: CBO’s Feb. 2013
Estimate of the Effects of ACA on Health Insurance Coverage
(http://cbo.gov/sites/default/files/cbofiles/attachments/43900_ACAInsuranceCoverageEffects.pdf)Centers
for Medicare & Medicaid Services, 2011 Actuarial Study
(http://www.cms.gov/Research-Statistics-Data-and-Systems/Research/ActuarialStudies/downloads/MedicaidReport2011.pdf)•
Medicaid is thecornerstone of ACA• New opportunities created by ACA
intersect with MAXIMUS core capabilities Estimated incremental total
addressable market: • $500m annually for individual exchanges • $130m to
$200m annually for Medicaid expansion • SHOP market opportunity
Beneficiaries (in millions) Superior Positioning for Growth from Health
Care Reform
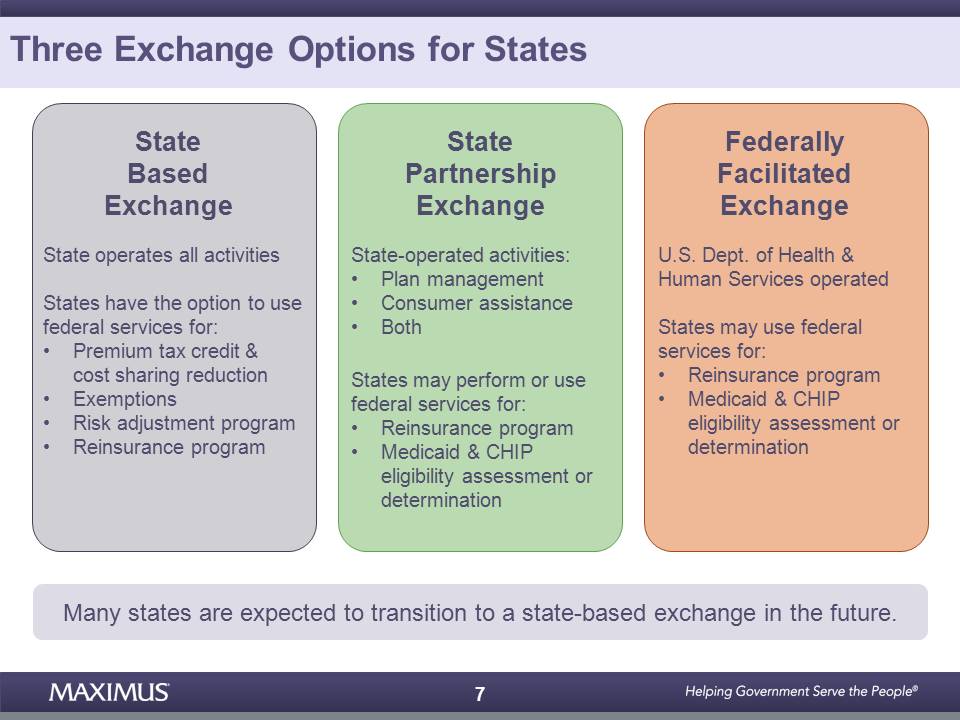
7Three Exchange Options for
States State operates all activities States have the option to use
federal services for:• Premium tax credit & cost sharing reduction•
Exemptions• Risk adjustment program• Reinsurance program State Based
Exchange State Partnership Exchange State-operated activities:• Plan
management• Consumer assistanc • Both States may perform or use federal
services for:• Reinsurance program• Medicaid & CHIP eligibility
assessment or determination U.S. Dept. of Health & Human Services
operated States may use federal services for:• Reinsurance program•
Medicaid & CHIP eligibility assessment or determination Federally
Facilitated Exchange Many states are expected to transition to a
state-based exchange in the future.
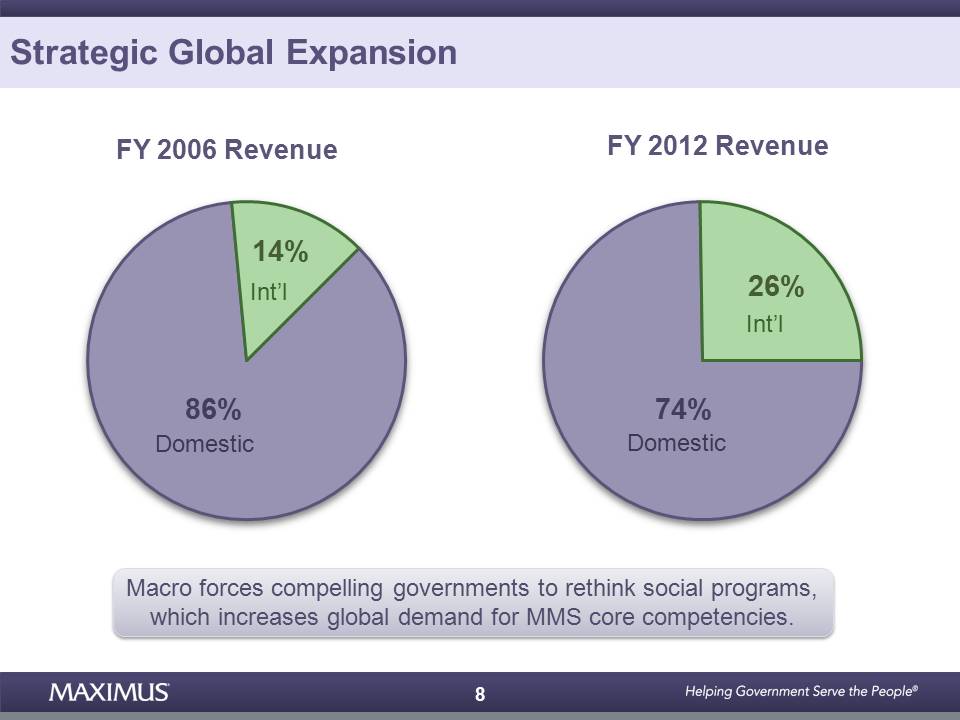
8 FY 2012 Revenue FY 2006
Revenue Macro forces compelling governments to rethink social programs,
which increases global demand for MMS core competencies. Strategic
Global Expansion 86% 14% 74% 26% Int’l Domestic Int’l Domestic
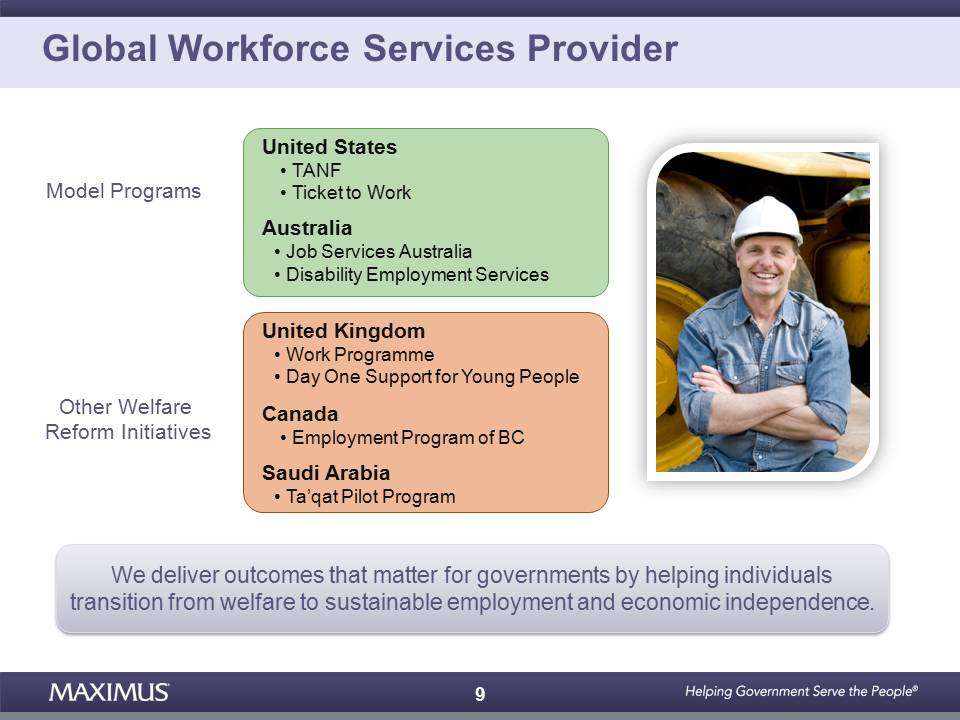
9Global Workforce Services
Provider United States• TANF• Ticket to Work Australia• Job Services
Australia• Disability Employment Services United Kingdom• Work
Programme• Day One Support for Young People Canada• Employment Program
of BC Saudi Arabia• Ta’qat Pilot Program Model Programs We deliver
outcomes that matter for governments by helping individuals transition
from welfare to sustainable employment and economic independence. Other
Welfare Reform Initiatives
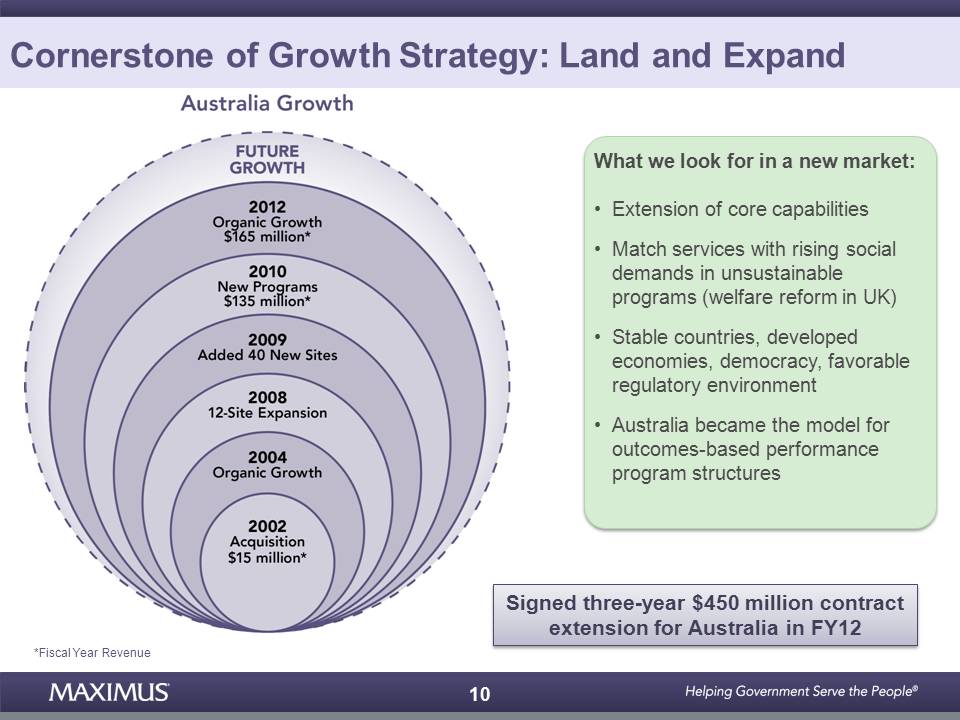
10 What we look for in a
new market:• Extension of core capabilities• Match services with rising
social demands in unsustainable programs (welfare reform in UK) • Stable
countries, developed economies, democracy, favorable regulatory
environment • Australia became the model for outcomes-based performance
program structures Cornerstone of Growth Strategy: Land and Expand
*Fiscal Year Revenue Australia Example Signed three-year $450 million
contract extension for Australia in FY12
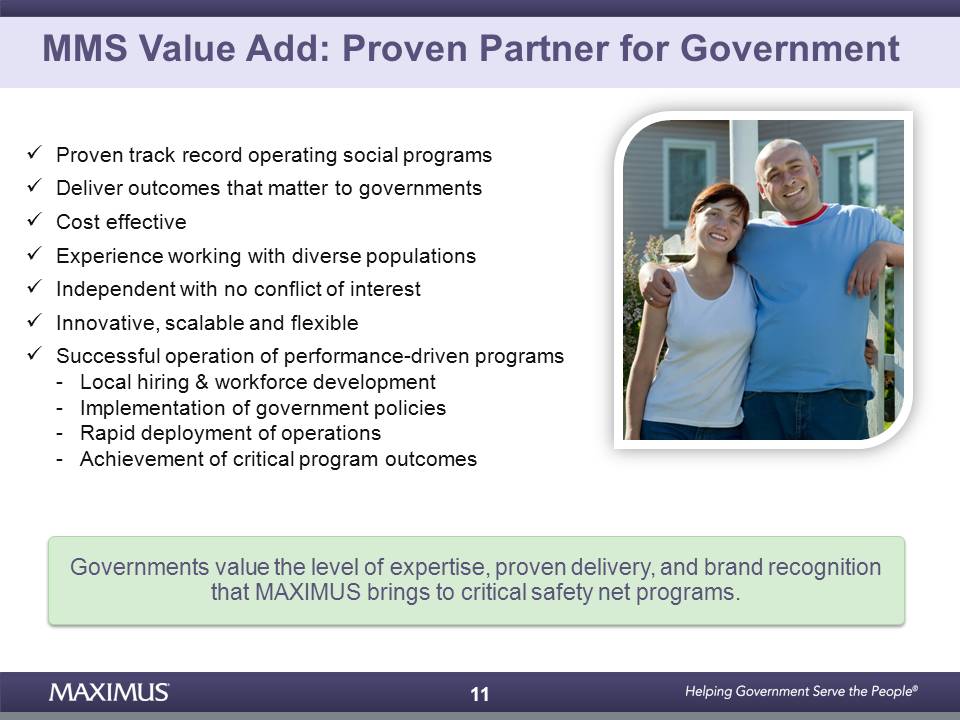
11 MMS Value Add: Proven
Partner for Government Proven track record operating social programs
Deliver outcomes that matter to governments Cost effective Experience
working with diverse populations Independent with no conflict of
interest Innovative, scalable and flexible Successful operation of
performance-driven programs- Local hiring & workforce development-
Implementation of government policies- Rapid deployment of operations-
Achievement of critical program outcomes Governments value the level of
expertise, proven delivery, and brand recognition that MAXIMUS brings to
critical safety net programs.
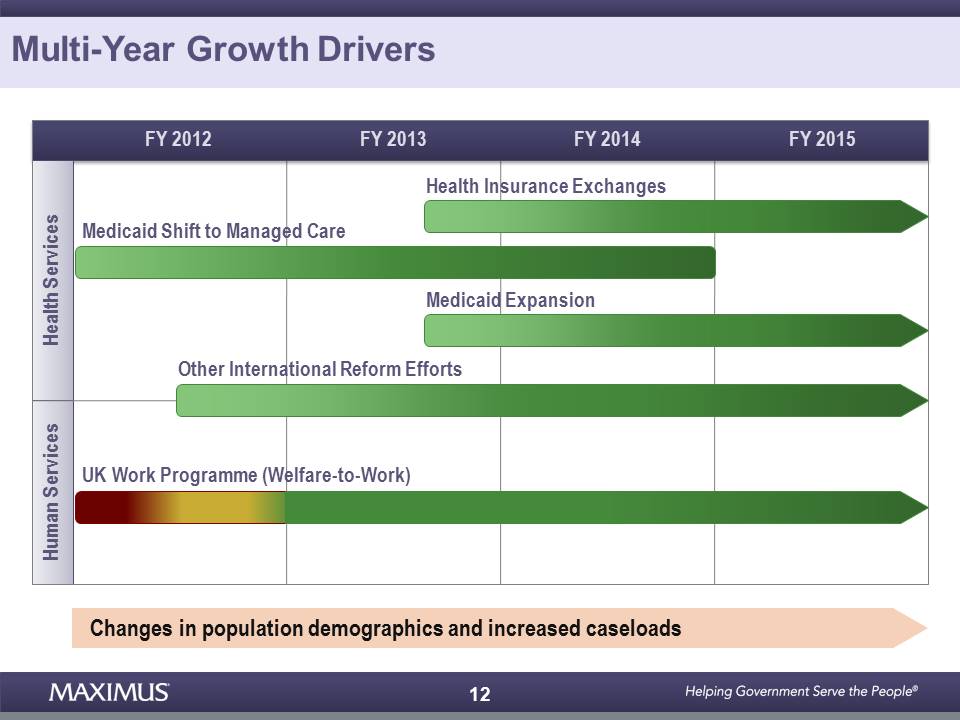
12 Changes in population
demographics and increased caseloads Medicaid Shift to Managed Care
Health Insurance Exchanges Medicaid Expansion Other International Reform
Efforts UK Work Programme (Welfare-to-Work) Health Services Human
Services FY 2012 FY 2013 FY 2014 FY 2015 Multi-Year Growth Drivers
13 Capitalizing On Growing
Demand Established global leader Positioned for significant growthacross
both Segments Strong financial position Experienced management team
Poised to Capitalize on Growth Opportunities

14 MAXIMUS Investor
Presentation MAXIMUS, Inc. (NYSE: MMS) Barclays Global Healthcare
Conference March 12, 2013 For more information, visit www.maximus.com or
contact Lisa Miles, Senior VP Investor Relations lisamiles@maximus.com
703.251.8637