MAXIMUS
11419 Sunset Hills Road
Reston VA 20190
July 29, 2010
United
States Securities and Exchange Commission
Division of
Corporate Finance — Mail Stop 3010
Washington
DC 20549
Dear
Ms. Monick,
In response
to a telephone call from Howard Efron, we have been asked to provide further
examples of analysts’ reports from fiscal year 2008, focusing on the unusual
and infrequent events which occurred in that year and the charge of $2.2
million disclosed and recorded in the first quarter of that year.
In addition,
we acknowledge that:
· The Company
is responsible for the adequacy and accuracy of the disclosure in the filing;
· Staff
comments or changes to disclosure in response to staff comments do not
foreclose the Securities and Exchange Commission from taking any action with
respect to the filing;
· The Company
may not assert staff comments as a defense in any proceeding initiated by the
Securities and Exchange Commission or any person under the federal securities
laws of the United States.
There were
no significant, unusual events during the first quarter of fiscal year 2008.
However,
during the quarter, the Company did record a pre-tax charge of $2.2 million
($1.3 million after tax) reflecting the correction of an understatement of
stock compensation expense in 2006 and 2007.
As previously noted in our letter of June 18, 2010, this item was
mentioned in our earnings call and was the subject of questions at the time.
Following
the call, reports were prepared by a number of analysts, including the following:
· CJS
Securities, whose report is included in Appendix 1. This report mentions the $2.2 million charge
on page 1, “normalizing” EPS for the effect of the charge. In addition, there is no evidence that CJS
Securities considered the charge so significant that it affected their
understanding of the Company’s results in any of the years between 2006 and
2008.
1
· Jefferies &
Co (Appendix 2). This report mentions
the charge on page 1 and summarizes it (along with a temporary increase in
tax rates) as “transitory”. The charge
is excluded in preparing a pro forma calculation of EPS.
· UBS and GARP
Research & Securities published reports, but did not mention the
charge. The GARP report is included at
Appendix 3.
The Company
recorded some legal expenses in the second and third quarter and a gain on sale
of a building in the third quarter.
However, the most significant unusual events occurred in the fourth
quarter, where the Company recorded a $7.5 million pre-tax ($4.6 million
after-tax) goodwill impairment charge and a $37.5 million pre-tax ($23.2
million after-tax) legal and settlement charge related to the settlement with
Accenture over the Texas subcontract.
At the time
of the Company’s initial earnings call on November 13, 2008, the details
of the legal settlement were not known.
However, all analysts’ reports focused either on EBITDA (excluding the
impairment charge) or “pro forma” results with the impairment charge reversed
out. We believe this is significant
evidence that the analysts are focused on adjusted income. For example, in Appendix 4 we have included
the report of Stifel Nicolaus. We note
that:
· The report
acknowledges the goodwill impairment charge on page 2;
· The report
prepares an analysis of fourth quarter EBIT margin, which excludes goodwill
impairment and legal expenses.
Following
settlement of the Accenture matter, Stifel Nicolaus released a follow-up note
on December 15 ,2008, included as Appendix 5. This note focuses on the legal and settlement
charge, in itself a reflection of the nature of this charge to the analyst
community. As well as analyses similar
to those performed in the previous note, this report also includes a section called
“FY08 EPS Restated From Prior Periods” which mentions pro forma EPS of $0.71
for the quarter and $2.83 for the fiscal year.
These pro forma numbers are consistent with those used by the Company in
its press release of December 12, 2008 and include adjustments for legal
and settlement expense, goodwill impairment and the sale of the building.
It remains
our opinion that the error in stock compensation expense is immaterial to the
Company both in the aggregate and within each year affected. This is based upon the magnitude of the
adjustment, the nature of the charge and the comprehensive disclosure of the
correction by management in the Company’s Form 10-Q in the first quarter
of 2008. We feel that the review of the
analyst reports in 2008 confirms this view as:
· The focus of
the analysts appears to be on an earnings figure adjusted for unusual events,
such as the legal and settlement charge or the goodwill impairment. As a consequence, any adjustments must be
viewed in the context of a net income based upon a larger earnings figure than
that recorded under GAAP;
2
· Unlike the
goodwill impairment or legal and settlement expense, which are greater in scale
and significance to the Company, analysts did not place a significant amount of
interest in the stock-compensation correction, with some analysts omitting
mention of it entirely.
· We are not
aware of any shareholder viewing the correction of the error as a materially
misleading adjustment, notwithstanding the disclosure of the adjustment in the
financial statements, earnings call and certain of the analyst reports.
Please do
not hesitate to contact us if you need further information or clarification.
Sincerely
|
/s/ David
N. Walker
|
|
|
|
|
|
David N.
Walker
|
|
|
Chief Financial Officer
|
|
3
Appendix 1
CJS SECURITIES
50 MAIN ST
WHITE PLAINS
NY 10606
Telephone
(914)
287-7600
|
MAXIMUS
|
|
MARKET OUTPERFORM
|
|
FEBRUARY 7, 2008
|
|
(MMS-$39.91:NYSE)
|
|
|
|
P-TARGET:$49
|
COMPANY UPDATE
· GOOD START TO THE YEAR, EPS EX-CHARGE $0.07 BETTER THAN EXPECTED
· STRONG MARGINS IN OPERATIONS
SEG. MORE THAN OFFSET WEAK SYSTEMS
· ECONOMIC
DOWNTURN NOT EXPECTED TO IMPACT CO. AS EVIDENCED BY GROWING BACKLOG
· EPS GUIDANCE RAISED TO
ACCOUNT FOR BUYBACK ACCRETION
· RAISING FY09 ESTIMATES, REITERATE MKT. OUTPERFORM RATING
The core operations business
continues to drive solid results at MAXIMUS making up for poor results in its
systems segment. Overall top line sales of 202mm were 1mm shy of our model for
FQ1 08 but again can be attributed to the troubled systems unit which was over
2mm below our estimate. Operating
margins were 90bps better than expected as the operations unit delivered nearly
300bps higher profitability. Consulting was 80bps above our model and Systems
showed a loss of $3mm vs our just above break even expectation. The company has
struggled to turn this unit around as it appears software development costs
have been mounting and a couple of contracts may be operating at a loss. While
MMS tries to rework these contracts this segment remains a drag on earnings,
masking the strong performance of its core health and human services business
and it now appears that systems will not be profitable this year. Despite this
the other businesses are more than making up for this shortfall and we are
maintaining our prior estimates for the year.
Excluding a $2.2mm charge
for the forfeiture of options EPS would have been approximately $0.07 better
than our estimate. Cash flow from operations was strong at $20.8mm and FCF was
$16.7mm. The company has done an excellent
job focusing on reducing DSOs, which were 77 days in the quarter within the
targeted 75-85 day range. Guidance for FY08 CFFO remains at $50-60mm with FCF
expected to be $30-40mm. Overall guidance for sales remains unchanged at $850mm
to $880mm but EPS guidance is now higher at $2.60 to $2.85 (was $2.40 to $2.65
|
|
|
|
|
Financial
Metrics
|
|
GAAP
Earnings Per Share
|
|
|
Current Price
|
|
$35.82
|
|
Cash $(MM)
|
|
$62
|
|
FY (Sep)
|
|
2008e
|
|
was
|
|
2009e
|
|
was
|
|
|
52 Week Range
|
|
$26.65 - $48.33
|
|
Total Debt $(MM)
|
|
$0
|
|
Q1 Dec
|
|
$0.51 a
|
|
$0.50
|
|
|
|
|
|
|
Shares Out FD (MM)
|
|
19.0
|
|
Net Debt/Cap
|
|
0%
|
|
Q2 Mar
|
|
$0.62
|
|
|
|
|
|
|
|
|
Float (MM)
|
|
19
|
|
Return on Equity
|
|
-2%
|
|
Q3 Jun
|
|
$0.78
|
|
|
|
|
|
|
|
|
Average Daily Vol.
|
|
405 K
|
|
Est. 3-5 yr Rev growth
|
|
10-15%
|
|
Q4 Sep
|
|
$0.85
|
|
|
|
|
|
|
|
|
Market Cap ($MM)
|
|
$681
|
|
Est. 3-5 yr EPS growth
|
|
13-17%
|
|
Year
|
|
$2.75
|
|
|
|
$3.30
|
|
$3.15
|
|
|
Enterprise Value ($MM)
|
|
$618
|
|
Dividend Yield
|
|
1%
|
|
P/E
|
|
13.0X
|
|
|
|
10.9X
|
|
|
|
|
Mgmt/Director Ownership
|
|
1.6%
|
|
Book Value per Share
|
|
$18.49
|
|
EV/ EBITDA
|
|
27.7 X
|
|
|
|
5.5X
|
|
|
|
|
Charles Strauzer
|
cstrauzer@cjs-securities.com
|
|
PLEASE
REFER TO THE LAST PAGE OF THIS REPORT FOR IMPORTANT DISCLOSURES, ANALYST
CERTIFICATION AND PRICE CHART.
|
but excluded the buyback)
given the previously announced $150mm accelerated share repurchase and will
likely net more shares given the lower share price.
Backlog continues to grow
even though there are some investors who may have the perception that a tough
economic climate will impact MMS. The
total pipeline now stands at $1.5bln vs. 1.3bln in FY07. There are several
reasons we believe MMS can weather a challenging economic environment;
· 60% of its
business are BPO type services which are typically driven and funded by the
federal government,
· States tend to
outsource more in tougher budgetary environments to try and save money,
· Focus of
services on cost reductions and efficiencies, which is appealing to its
customer base during tougher times,
· Privatization
services typically are attractive during tighter fiscal cycles because MMS can
do the same job as government more efficiently and often with less expense.
· Lastly case
loads usually increase in more difficult times, as there are more people in
need of help increasing the need for the work performed by MMS.
We are maintaining our FY 08
estimates but raising our FY 09 EPS for continued progress in growing its core
operations margins. Our $49 valuation is based on 8X our FY08E EBITDA (below
takeout multiples and inline with comparable public company valuations). If MMS can rid themselves of unprofitable
businesses it would help further expand margins and could use cash proceeds
received to further enhance value. Accordingly, we reiterate our market
outperform rating.
MAXIMUS
Actual
vs. Estimates for Q1 12/07e (in MMs except EPS)
|
|
|
Year
Ago Actual
|
|
Current
Quarter Actual
|
|
Current
Q Estimate
|
|
Better/
|
|
|
|
|
Q1
12/06
|
|
%
Revs
|
|
Q1
12/07
|
|
%
Revs
|
|
Y/Y
|
|
Q1
12/07e
|
|
%
Revs
|
|
(Worse)
|
|
|
Segment
Revenues
|
|
|
|
|
|
|
|
|
|
|
|
|
|
|
|
|
|
|
Consulting
|
|
24.7
|
|
15.3
|
%
|
22.2
|
|
11.0
|
%
|
-10.1
|
%
|
22.2
|
|
10.9
|
%
|
-0.2
|
%
|
|
Systems
|
|
34.5
|
|
21.4
|
%
|
34.0
|
|
16.8
|
%
|
-1.6
|
%
|
36.3
|
|
17.8
|
%
|
-6.3
|
%
|
|
Operations
|
|
101.9
|
|
63.3
|
%
|
145.8
|
|
72.2
|
%
|
43.0
|
%
|
144.8
|
|
71.2
|
%
|
0.7
|
%
|
|
Total
Revenue
|
|
161.1
|
|
100.0
|
%
|
202.0
|
|
100.0
|
%
|
25.3
|
%
|
203.2
|
|
100.0
|
%
|
-0.6
|
%
|
|
|
|
|
|
|
|
|
|
|
|
|
|
|
|
|
|
|
|
|
Income
from Operations
|
|
|
|
|
|
|
|
|
|
|
|
|
|
|
|
|
|
|
Consulting
|
|
2.8
|
|
11.4
|
%
|
1.2
|
|
5.2
|
%
|
-59.1
|
%
|
1.0
|
|
4.4
|
%
|
16.8
|
%
|
|
Systems
|
|
(1.6
|
)
|
-4.6
|
%
|
(3.1
|
)
|
-9.2
|
%
|
96.7
|
%
|
0.6
|
|
1.5
|
%
|
-661.9
|
%
|
|
Operations
|
|
(16.0
|
)
|
-15.7
|
%
|
18.7
|
|
12.8
|
%
|
-216.8
|
%
|
12.8
|
|
8.9
|
%
|
46.0
|
%
|
|
Consolidating
Adjustments
|
|
0.5
|
|
|
|
(0.2
|
)
|
|
|
-151.0
|
%
|
0.5
|
|
|
|
-146.0
|
%
|
|
Total
Income from Operations
|
|
(14.4
|
)
|
-8.9
|
%
|
16.5
|
|
8.2
|
%
|
-214.9
|
%
|
14.9
|
|
7.3
|
%
|
11.0
|
%
|
|
|
|
|
|
|
|
|
|
|
|
|
|
|
|
|
|
|
|
|
Gross
Profit
|
|
20.3
|
|
12.6
|
%
|
52.8
|
|
26.1
|
%
|
160.2
|
%
|
51.5
|
|
25.3
|
%
|
2.5
|
%
|
|
Selling,
General & Administrative
|
|
(34.7
|
)
|
-21.5
|
%
|
(36.3
|
)
|
-18.0
|
%
|
4.6
|
%
|
(36.6
|
)
|
-18.0
|
%
|
0.9
|
%
|
|
EBIT
|
|
(17.4
|
)
|
-10.8
|
%
|
16.5
|
|
8.2
|
%
|
NM
|
|
14.9
|
|
7.3
|
%
|
11.0
|
%
|
|
|
|
|
|
|
|
|
|
|
|
|
|
|
|
|
|
|
|
|
Interest
Income
|
|
1.6
|
|
1.0
|
%
|
1.5
|
|
0.7
|
%
|
-6.9
|
%
|
0.3
|
|
0.1
|
%
|
400.3
|
%
|
|
Pretax
Income
|
|
(15.8
|
)
|
-9.8
|
%
|
18.0
|
|
8.9
|
%
|
NM
|
|
15.2
|
|
7.5
|
%
|
18.7
|
%
|
|
Taxes
|
|
5.8
|
|
3.6
|
%
|
(7.4
|
)
|
-3.7
|
%
|
NM
|
|
(5.9
|
)
|
-2.9
|
%
|
-20.1
|
%
|
|
Tax Rate
|
|
36.9
|
%
|
NA
|
|
41.1
|
%
|
NA
|
|
4.2
|
%
|
39.0
|
%
|
NA
|
|
-2.1
|
%
|
|
Net
Income
|
|
$
|
(9.9
|
)
|
-6.2
|
%
|
$
|
10.6
|
|
5.3
|
%
|
NM
|
|
$
|
9.3
|
|
4.6
|
%
|
14.5
|
%
|
|
|
|
|
|
|
|
|
|
|
|
|
|
|
|
|
|
|
|
|
EPS
(Fully Diluted)
|
|
$
|
(0.48
|
)
|
NA
|
|
$
|
0.51
|
|
NA
|
|
-205.9
|
%
|
$
|
0.50
|
|
NA
|
|
|
|
|
EPS
(Fully Diluted) Ex Items
|
|
|
|
|
|
$
|
0.57
|
|
|
|
|
|
$
|
0.50
|
|
|
|
|
|
|
Fully
Diluted Shares
|
|
21.6
|
|
NA
|
|
20.9
|
|
NA
|
|
-3.4
|
%
|
18.7
|
|
NA
|
|
-10.3
|
%
|
|
|
|
|
|
|
|
|
|
|
|
|
|
|
|
|
|
|
|
|
EBITDA
|
|
(10.9
|
)
|
-6.7
|
%
|
22.7
|
|
11.2
|
%
|
-308.5
|
%
|
21.5
|
|
10.6
|
%
|
5.5
|
%
|
|
Depreciation &
Amortization
|
|
5.1
|
|
3.1
|
%
|
5.1
|
|
2.5
|
%
|
0.0
|
%
|
5.5
|
|
2.7
|
%
|
8.8
|
%
|
Source: CJS Securities Estimates, Company Documents
MAXIMUS, Inc. (MMS)
Income
Statement
All
Figures $MM, except per share
|
|
|
|
|
|
|
|
|
|
|
|
|
|
|
|
|
|
|
|
|
|
|
|
|
|
|
|
|
|
|
|
|
|
|
|
|
|
|
|
|
|
|
|
|
|
|
|
FY 2004a
|
|
FY 2005a
|
|
FY 2006e
|
|
Q1 12/06
|
|
Q2 3/07
|
|
Q3 6/07
|
|
Q4 9/07
|
|
FY 2007e
|
|
Q1 12/07
|
|
Q2 3/08e
|
|
Q3 6/08e
|
|
Q4 9/08e
|
|
FY 2008e
|
|
FY 2009e
|
|
|
Revenue
|
|
603.8
|
|
647.5
|
|
700.9
|
|
161.1
|
|
179.1
|
|
196.6
|
|
201.9
|
|
738.6
|
|
202.0
|
|
210.0
|
|
226.0
|
|
230.1
|
|
868.0
|
|
950.9
|
|
|
%
growth year-to-year
|
|
8.1
|
%
|
7.2
|
%
|
8.2
|
%
|
-1.0
|
%
|
-0.4
|
%
|
5.3
|
%
|
17.5
|
%
|
5.4
|
%
|
25.3
|
%
|
17.3
|
%
|
15.0
|
%
|
14.0
|
%
|
17.5
|
%
|
9.5
|
%
|
|
Cost of
Revenue
|
|
(427.7
|
)
|
(467.6
|
)
|
(547.4
|
)
|
(140.9
|
)
|
(136.2
|
)
|
(138.1
|
)
|
(146.4
|
)
|
(561.6
|
)
|
(149.2
|
)
|
(153.3
|
)
|
(160.8
|
)
|
(161.8
|
)
|
(625.1
|
)
|
(675.5
|
)
|
|
% of
Revenue
|
|
70.8
|
%
|
72.2
|
%
|
78.1
|
%
|
87.4
|
%
|
76.1
|
%
|
70.3
|
%
|
72.5
|
%
|
76.0
|
%
|
73.9
|
%
|
73.0
|
%
|
71.2
|
%
|
70.3
|
%
|
72.0
|
%
|
71.0
|
%
|
|
%
growth year-to-year
|
|
9.2
|
%
|
9.3
|
%
|
17.1
|
%
|
19.4
|
%
|
1.3
|
%
|
-13.0
|
%
|
7.5
|
%
|
2.6
|
%
|
5.9
|
%
|
12.6
|
%
|
16.4
|
%
|
10.6
|
%
|
11.3
|
%
|
8.0
|
%
|
|
Gross
Profit
|
|
176.0
|
|
180.0
|
|
136.3
|
|
20.3
|
|
42.9
|
|
58.4
|
|
55.5
|
|
177.1
|
|
52.8
|
|
56.7
|
|
65.2
|
|
68.3
|
|
242.9
|
|
275.4
|
|
|
Gross
Margin
|
|
29.2
|
%
|
27.8
|
%
|
19.5
|
%
|
12.6
|
%
|
23.9
|
%
|
29.7
|
%
|
27.5
|
%
|
24.0
|
%
|
26.1
|
%
|
27.0
|
%
|
28.8
|
%
|
29.7
|
%
|
28.0
|
%
|
29.0
|
%
|
|
%
growth year-to-year
|
|
7.0
|
%
|
2.2
|
%
|
-24.2
|
%
|
-54.7
|
%
|
-5.4
|
%
|
449.1
|
%
|
55.8
|
%
|
29.9
|
%
|
160.2
|
%
|
32.2
|
%
|
11.5
|
%
|
23.0
|
%
|
37.2
|
%
|
13.4
|
%
|
|
Selling,
General & Administrative
|
|
(113.0
|
)
|
(116.7
|
)
|
(129.7
|
)
|
(34.7
|
)
|
(34.5
|
)
|
(35.4
|
)
|
(31.1
|
)
|
(135.6
|
)
|
(36.3
|
)
|
(37.8
|
)
|
(40.7
|
)
|
(41.4
|
)
|
(156.1
|
)
|
(171.2
|
)
|
|
% of
Revenue
|
|
18.7
|
%
|
18.0
|
%
|
18.5
|
%
|
21.5
|
%
|
19.2
|
%
|
18.0
|
%
|
18.0
|
%
|
18.4
|
%
|
18.0
|
%
|
18.0
|
%
|
18.0
|
%
|
18.0
|
%
|
18.0
|
%
|
18.0
|
%
|
|
%
Growth Year-to-Year
|
|
5.2
|
%
|
3.3
|
%
|
11.1
|
%
|
9.8
|
%
|
11.5
|
%
|
9.5
|
%
|
-10.9
|
%
|
4.6
|
%
|
4.6
|
%
|
9.7
|
%
|
15.1
|
%
|
33.1
|
%
|
15.2
|
%
|
9.6
|
%
|
|
Write
off of deferred contract costs
|
|
|
|
|
|
(17.1
|
)
|
(28.0
|
)
|
(6.5
|
)
|
|
|
0.2
|
|
|
|
(2.2
|
)
|
|
|
|
|
|
|
|
|
|
|
|
Legal
Expense
|
|
0.0
|
|
(7.0
|
)
|
(9.4
|
)
|
(3.0
|
)
|
(6.1
|
)
|
(33.0
|
)
|
(2.5
|
)
|
(44.6
|
)
|
|
|
|
|
|
|
|
|
0.0
|
|
0.0
|
|
|
Operating
Profit
|
|
63.0
|
|
56.3
|
|
(2.8
|
)
|
(17.4
|
)
|
2.3
|
|
(9.9
|
)
|
21.8
|
|
(3.1
|
)
|
16.5
|
|
18.9
|
|
24.5
|
|
26.8
|
|
86.7
|
|
104.3
|
|
|
% of
Revenue
|
|
10.4
|
%
|
8.7
|
%
|
-0.4
|
%
|
-10.8
|
%
|
1.3
|
%
|
-5.1
|
%
|
10.8
|
%
|
-0.4
|
%
|
8.2
|
%
|
9.0
|
%
|
10.8
|
%
|
11.7
|
%
|
10.0
|
%
|
11.0
|
%
|
|
%
Growth Year-to-Year
|
|
10.5
|
%
|
-10.7
|
%
|
-105.0
|
%
|
-237.0
|
%
|
-83.1
|
%
|
-67.8
|
%
|
1281.0
|
%
|
11.0
|
%
|
-195.0
|
%
|
714.6
|
%
|
-346.6
|
%
|
22.8
|
%
|
-2865.9
|
%
|
20.2
|
%
|
|
Net
Interest Income & Other
|
|
1.0
|
|
3.3
|
|
6.9
|
|
1.6
|
|
1.6
|
|
0.9
|
|
2.1
|
|
6.3
|
|
1.5
|
|
0.4
|
|
0.3
|
|
0.3
|
|
2.5
|
|
1.8
|
|
|
Pretax
Income
|
|
64.1
|
|
59.6
|
|
4.0
|
|
(15.8
|
)
|
3.9
|
|
(9.0
|
)
|
24.0
|
|
3.1
|
|
18.0
|
|
19.3
|
|
24.8
|
|
27.1
|
|
89.2
|
|
106.1
|
|
|
% of
Revenue
|
|
10.6
|
%
|
9.2
|
%
|
0.6
|
%
|
-9.8
|
%
|
2.2
|
%
|
-4.6
|
%
|
11.9
|
%
|
0.4
|
%
|
8.9
|
%
|
9.2
|
%
|
11.0
|
%
|
11.8
|
%
|
10.3
|
%
|
11.2
|
%
|
|
%
Growth Year-to-Year
|
|
9.7
|
%
|
-7.0
|
%
|
-93.2
|
%
|
-207.1
|
%
|
-73.2
|
%
|
-68.4
|
%
|
633.9
|
%
|
-22.7
|
%
|
-214.3
|
%
|
390.4
|
%
|
-374.5
|
%
|
13.2
|
%
|
2761.2
|
%
|
18.9
|
%
|
|
Taxes
|
|
(25.3
|
)
|
(23.6
|
)
|
(1.6
|
)
|
5.8
|
|
(1.6
|
)
|
(5.4
|
)
|
(10.3
|
)
|
(11.4
|
)
|
(7.4
|
)
|
(7.6
|
)
|
(9.7
|
)
|
(10.6
|
)
|
(35.3
|
)
|
(41.4
|
)
|
|
Tax
Rate
|
|
39.5
|
%
|
39.5
|
%
|
39.0
|
%
|
36.9
|
%
|
40.0
|
%
|
-59.4
|
%
|
42.8
|
%
|
364.7
|
%
|
41.1
|
%
|
39.4
|
%
|
39.0
|
%
|
39.0
|
%
|
39.5
|
%
|
39.0
|
%
|
|
Net
Income
|
|
38.8
|
|
36.1
|
|
2.5
|
|
(9.9
|
)
|
2.4
|
|
(14.4
|
)
|
13.7
|
|
(8.3
|
)
|
10.6
|
|
11.7
|
|
15.1
|
|
16.6
|
|
54.0
|
|
64.7
|
|
|
% of
Revenue
|
|
6.4
|
%
|
5.6
|
%
|
0.4
|
%
|
-6.2
|
%
|
1.3
|
%
|
-7.3
|
%
|
6.8
|
%
|
-1.1
|
%
|
5.3
|
%
|
5.6
|
%
|
6.7
|
%
|
7.2
|
%
|
6.2
|
%
|
6.8
|
%
|
|
%
Growth Year-to-Year
|
|
9.7
|
%
|
-7.0
|
%
|
-93.2
|
%
|
-211.7
|
%
|
-73.4
|
%
|
-16.9
|
%
|
588.3
|
%
|
-435.6
|
%
|
-206.6
|
%
|
395.1
|
%
|
-205.1
|
%
|
20.7
|
%
|
-753.8
|
%
|
19.9
|
%
|
|
Net
Earnings per Share fd
|
|
$
|
1.76
|
|
$
|
1.67
|
|
$
|
0.11
|
|
$
|
(0.48
|
)
|
$
|
0.11
|
|
$
|
(0.65)
|
|
$
|
0.63
|
|
$
|
(0.38
|
)
|
$
|
0.51
|
|
$
|
0.62
|
|
$
|
0.78
|
|
$
|
0.85
|
|
$
|
2.75
|
|
$
|
3.30
|
|
|
%
Growth Year-to-Year
|
|
6.3
|
%
|
-5.4
|
%
|
-93.2
|
%
|
-218.1
|
%
|
-73.5
|
%
|
-18.8
|
%
|
589.3
|
%
|
-435.0
|
%
|
-205.9
|
%
|
472.6
|
%
|
-219.8
|
%
|
36.0
|
%
|
-827.7
|
%
|
20.1
|
%
|
|
|
|
|
|
|
|
|
|
|
|
|
|
|
|
|
|
|
|
|
|
|
|
|
|
|
|
|
|
|
|
|
Net (Charges)/Income
|
|
0.0
|
|
(4.2
|
)
|
(23.8
|
)
|
(17.3
|
)
|
(7.6
|
)
|
(28.6
|
)
|
(1.2
|
)
|
(54.7
|
)
|
(1.3
|
)
|
0.0
|
|
0.0
|
|
0.0
|
|
(1.3
|
)
|
0.0
|
|
|
Pro-Forma Net Income(ex
one time items)
|
|
38.8
|
|
40.3
|
|
26.2
|
|
7.3
|
|
10.0
|
|
14.2
|
|
14.9
|
|
46.4
|
|
11.9
|
|
11.7
|
|
15.1
|
|
16.6
|
|
55.3
|
|
64.7
|
|
|
Pro-Forma
EPS (ex one time items)
|
|
$
|
1.76
|
|
$
|
1.86
|
|
$
|
1.20
|
|
$
|
0.34
|
|
$
|
0.45
|
|
$
|
0.65
|
|
$
|
0.68
|
|
$
|
2.12
|
|
$
|
0.57
|
|
$
|
0.62
|
|
$
|
0.78
|
|
$
|
0.85
|
|
$
|
2.82
|
|
$
|
3.30
|
|
|
%
Growth Year-to-Year
|
|
6.3
|
%
|
5.7
|
%
|
-35.4
|
%
|
-19.2
|
%
|
6.9
|
%
|
-1044.8
|
%
|
62.2
|
%
|
76.6
|
%
|
68.4
|
%
|
35.4
|
%
|
21.2
|
%
|
25.4
|
%
|
32.6
|
%
|
17.2
|
%
|
|
FAS 123R Options expense
pre-tax**
|
|
0.0
|
|
0.0
|
|
5.8
|
|
1.5
|
|
1.5
|
|
0.8
|
|
0.8
|
|
4.5
|
|
1.1
|
|
1.1
|
|
1.1
|
|
1.1
|
|
4.4
|
|
4.4
|
|
|
|
|
|
|
|
|
|
|
|
|
|
|
|
|
|
|
|
|
|
|
|
|
|
|
|
|
|
|
|
|
|
FD EPS
before options exp.
|
|
$
|
1.76
|
|
$
|
1.86
|
|
$
|
1.36
|
|
$
|
0.38
|
|
$
|
0.49
|
|
$
|
0.70
|
|
$
|
0.70
|
|
$
|
1.58
|
|
$
|
0.60
|
|
$
|
0.65
|
|
$
|
0.82
|
|
$
|
0.89
|
|
$
|
2.95
|
|
$
|
3.44
|
|
|
% Growth Year-to-Year
|
|
6.3
|
%
|
5.7
|
%
|
-26.7
|
%
|
-17.4
|
%
|
6.2
|
%
|
-2656.0
|
%
|
52.5
|
%
|
15.7
|
%
|
58.6
|
%
|
31.7
|
%
|
16.2
|
%
|
26.6
|
%
|
87.0
|
%
|
16.5
|
%
|
|
Weighted Avg. S/O
(mil)-fd
|
|
22.0
|
|
21.7
|
|
21.8
|
|
21.6
|
|
22.0
|
|
22.0
|
|
21.9
|
|
21.9
|
|
20.9
|
|
19.0
|
|
19.3
|
|
19.4
|
|
19.6
|
|
19.6
|
|
|
|
|
|
|
|
|
|
|
|
|
|
|
|
|
|
|
|
|
|
|
|
|
|
|
|
|
|
|
|
|
|
EBITDA
|
|
76.2
|
|
71.4
|
|
20.6
|
|
(10.9
|
)
|
8.7
|
|
29.3
|
|
30.7
|
|
22.3
|
|
22.7
|
|
25.5
|
|
31.1
|
|
33.4
|
|
112.7
|
|
128.7
|
|
|
% of
Revenue
|
|
12.6
|
%
|
11.0
|
%
|
2.9
|
%
|
-6.7
|
%
|
4.9
|
%
|
14.9
|
%
|
15.2
|
%
|
3.0
|
%
|
11.2
|
%
|
12.1
|
%
|
13.8
|
%
|
14.5
|
%
|
13.0
|
%
|
13.5
|
%
|
|
%
Growth Year-to-Year
|
|
11.6
|
%
|
-6.3
|
%
|
-71.1
|
%
|
-159.5
|
%
|
-54.8
|
%
|
-216.4
|
%
|
274.6
|
%
|
8.3
|
%
|
-308.5
|
%
|
191.7
|
%
|
6.1
|
%
|
9.0
|
%
|
404.6
|
%
|
14.2
|
%
|
|
Depreciation &
Amortization
|
|
13.2
|
|
15.1
|
|
17.6
|
|
5.1
|
|
5.0
|
|
5.4
|
|
5.5
|
|
21.0
|
|
5.1
|
|
5.5
|
|
5.5
|
|
5.5
|
|
21.6
|
|
20.0
|
|
|
% of
Revenue
|
|
2.2
|
%
|
2.3
|
%
|
2.5
|
%
|
3.1
|
%
|
2.8
|
%
|
2.8
|
%
|
2.7
|
%
|
2.8
|
%
|
2.5
|
%
|
2.6
|
%
|
2.4
|
%
|
2.4
|
%
|
2.5
|
%
|
2.1
|
%
|
|
%
Growth Year-to-Year
|
|
17.1
|
%
|
15.2
|
%
|
16.5
|
%
|
21.9
|
%
|
19.2
|
%
|
30.2
|
%
|
6.9
|
%
|
18.8
|
%
|
0.0
|
%
|
10.6
|
%
|
1.3
|
%
|
-0.3
|
%
|
2.8
|
%
|
-7.2
|
%
|
|
|
|
|
|
|
|
|
|
|
|
|
|
|
|
|
|
|
|
|
|
|
|
|
|
|
|
|
|
|
|
|
|
|
|
|
|
|
|
|
|
|
|
|
|
Source: Company Reports and CJS Securities Estimates
Notes:
(1) Pro-forma
to include FAS 123 R option expense for years FY 05 and beyond
COMPANY
: MAXIMUS INC
CURRENCY
: USD
HISTORY
OF RECOMMENDATION AND PRICE TARGET CHANGES
|
DATE
|
|
CLOSING PRICE
|
|
RECOMMENDATION CHANGE
|
|
PRICE TARGET
|
|
16-Nov-2007
|
|
39.92
|
|
|
|
49.00
|
|
10-May-2007
|
|
39.93
|
|
|
|
46.00
|
|
12-Feb-2007
|
|
29.34
|
|
|
|
38.00
|
|
22-Dec-2006
|
|
29.77
|
|
|
|
31.00
|
|
07-Aug-2006
|
|
27.85
|
|
|
|
34.00
|
|
29-Jun-2006
|
|
23.79
|
|
|
|
30.00
|
|
29-Jun-2006
|
|
23.79
|
|
MARKET
OUTPERFORM
|
|
|
|
23-Nov-2005
|
|
37.00
|
|
|
|
44.00
|
|
19-Sep-2005
|
|
37.43
|
|
MARKET
PERFORM
|
|
|
|
01-Jul-2005
|
|
36.00
|
|
|
|
41.00
|
Source:
Firstcall & CJS Sec.
Charles Strauzer cstrauzer@cjs -securities.com
IMPORTANT
DISCLOSURES
Valuation Methodology: 8X
2008E EV/EBITDA
Investment Risks: TX
contract resolution and potential liability claims, State budget
cuts/reductions, management execution, competition, general macro economic
factors, timing of contracts, inability to reduce costs in underperforming
units, cost over-runs in fixed price contracts, penalties for non-performance,
acquisitions.
CJS Securities, Inc.
Equity Research rating system
Market
Outperform (MO): a stock that should perform at least 15%
better than the Russell 2000 index over the next 6-18 months Market Perform (MP): a stock that should
perform in line with or slightly better than the Russell 2000 index
Market
Under-Perform (MU): a stock expected to under-perform the Russell
2000 index
We will continue to have
some stocks on a Monitor List, where we are indicating to clients not to expect
a similar level of research coverage as companies on our active coverage list.
Hence, we do not have investment opinions, nor do we intend to publish
estimates, on Monitor list names.
As of 1/2/08, CJS Securities
provides active research on 66 companies, of which 42 (64%) are rated MO(buy)
and 24 (36%) are rated MP(hold) and 0 (0%) are rated MU(sell), we also have two
additional companies on our Monitor List (no rating, estimates or price
target).
The information and
statistics in this report have been obtained from sources we believe are
reliable but we do not warrant their accuracy or completeness. Prices and
opinions concerning the composition of market sectors included in this report
reflect the judgments as of this date and are subject to change without notice.
This material is for your information only and does not constitute an offer to
buy or sell, or the solicitation of any offer to buy or sell any securities.
CJS Securities Inc., its affiliates, directors, officers, stockholders,
employees (or members of their families), and accounts with respect to which
the forgoing have investment discretion, may have long or short positions in,
and may, as principal or agent, buy or sell the securities mentioned herein.
Occasionally, CJS Securities, Inc. may
receive sales credits or fees, directly or indirectly, when an individual
company under research coverage or a related peer company does an underwritten
offering. CJS intends to seek commission related non-investment banking services
over the next 3 months. Accordingly, the firm may have a conflict of interest
that could effect the objectivity of this report.
ANALYST
CERTIFICATION
The Research Analyst(s) who
prepared the document / email hereby certify that the views expressed in this
document / email
Appendix 2
Jefferies & Company, Inc.
February 7,
2008
Technology
IT Services
United
States of America
MAXIMUS
(NYSE: MMS)
Quarter
Offers Proof Point of Improved Health
Company
Update Estimate Change
|
Rating:
|
|
BUY
|
|
|
Price:
|
|
$35.82
|
|
|
Price
Target:
|
|
$55.00
|
|
|
Bloomberg:
|
|
NYSE:
MMS
|
|
Market Data
|
52-Week
Range:
|
|
$48.33-$26.65
|
|
|
Total
Entprs. Value (MM):
|
|
$689.9
|
|
|
Market
Cap. (MM):
|
|
$750.7
|
|
|
Insider
Ownership:
|
|
1.7
|
%
|
|
Institutional
Ownership:
|
|
97.0
|
%
|
|
Shares
Out. (MM):
|
|
20.9
|
|
|
Float
(MM):
|
|
18.2
|
|
|
Avg.
Daily Vol.:
|
|
190,017
|
|
Financial Summary
|
Book
Value (MM):
|
|
$
|
273.0
|
|
|
Book
Value/Share:
|
|
$
|
13.07
|
|
|
Net
Debt (MM):
|
|
$
|
(60.8
|
)
|
|
Net
Debt/Capital:
|
|
0.0
|
%
|
|
ROE:
|
|
15.3
|
%
|
|
3-5
Yr. Est. EPS Growth Rate:
|
|
15.0
|
%
|
|
ROIC:
|
|
16.5
|
%
|
|
Lg-Trm
Debt to Eqty:
|
|
0.0
|
%
|
ROE: Estimate for FYE 2008
ROIC: Estimate for FYE 2008
|
USD
|
|
2005A
|
|
2006A
|
|
2007A
|
|
2008E
|
|
|
Rev.
(MM)
|
|
—
|
|
700.9
|
|
738.6
|
|
877.7
|
|
|
Prev.
|
|
—
|
|
—
|
|
—
|
|
865.0
|
|
|
EV/Rev.
|
|
NM
|
|
1.0x
|
|
0.9x
|
|
0.8x
|
|
|
EPS
|
|
|
|
|
|
|
|
|
|
|
Cal.
|
|
1.66
|
|
(0.79
|
)
|
0.59
|
|
3.00
|
|
|
Prev. Cal.
|
|
—
|
|
—
|
|
—
|
|
2.88
|
|
|
Cal.
P/E
|
|
21.6x
|
|
NM
|
|
60.7x
|
|
11.9x
|
|
|
EPS Diluted
|
|
|
|
|
|
|
|
|
|
|
EPS
|
|
|
|
|
|
|
|
|
|
|
Dec
|
|
—
|
|
0.41
|
|
(0.48
|
)
|
—
|
|
|
Mar
|
|
—
|
|
0.41
|
|
0.11
|
|
—
|
|
|
Jun
|
|
—
|
|
(0.81
|
)
|
(0.65
|
)
|
—
|
|
|
Sep
|
|
—
|
|
0.09
|
|
0.63
|
|
—
|
|
|
FY Sep
|
|
—
|
|
0.11
|
|
(0.37
|
)
|
2.81
|
|
|
Prev. FY
|
|
—
|
|
—
|
|
(0.38
|
)
|
2.80
|
|
|
FY
P/E
|
|
NM
|
|
NM
|
|
NM
|
|
12.7x
|
|
|
GAAP EPS.
|
|
|
|
|
|
|
|
|
|
|
Consensus
|
|
—
|
|
0.11
|
|
(0.38
|
)
|
2.73
|
|
Investment
Summary
MMS should outperform the
market in C08 due to accelerating top-line growth to the upper teens, an
expanding operating margin likely in the double digits, and lowered operating risks
due to improved control systems. We remain bullish and highlight the healthy
quarter was actually even stronger than the results imply.
Event
Maximus reported revenue and
EPS of $202 million and $0.51. Revenue was ahead of consensus based on healthy growth
in the Operations segment. EPS met consensus expectations, though was
negatively impacted by a $2.2 million non-cash charge and temporarily higher
tax rate that veiled the upside in operating results.
Key Points
· Raising our
fiscal 2008 estimates to reflect new guidance. Our fiscal year 2008 revenue
and EPS estimates move to $877.7 million and $2.81 from $865 million and $2.80.
Management reiterated revenue guidance of $850–880 million, though made an
upward revision to EPS guidance to $2.60–2.85 from $2.35–2.65 to reflect
accretion from the accelerated share repurchase program. Supporting the
increased guidance is $324 million of new awards during the quarter,
representing a book-to-bill of 1.6x. New awards, including multi-hundred
million dollar contracts in California and Texas, and a healthy sales pipeline
lend confidence to our raise.
· Strong
quarter obscured by transitory events. Maximus reported a 25%
increase in revenue and the operating margin improved from negative 8.9% a
year-ago to 9.3%, after excluding a $2.2 million non-cash charge related to a
forfeiture calculation on previous years’ stock-based compensation. Results
were fueled by strong performance in the Operations segment (72% of revenue),
which grew its top-line by a normalized 24% and swung to a 13% operating margin
compared to a loss in the same quarter the previous year. The normalized growth
within Operations excludes a negative $15.7 million revenue impact from the
termination of the Ontario contract and reduction of the Texas contract last
year. Excluding this impact from overall
results reduces top line growth by about 10%. On the other hand, the company
reported a $2.2 million non-cash charge related to prior years’ stock-based
compensation and a more than 100 bp temporary increase in the tax rate from a
change in Canadian tax law. We note that the impact of these events combined to
impact EPS by approximately $0.07, exceeding our estimate by 8 cents.
Valuation/Risks
At 12x our raised C08 EPS
estimate, MMS is trading at nearly a 30% discount to its 10-year median forward
P/E of 18x. Key risks include the impact of discretionary spending cuts in a
softening economy and execution on improving the performance of the Systems
segment. Please refer to the attached DCF to understand the operating
assumptions supporting our $55 one-year price target.
Matthew G. McKay, CFA
(617) 342-7909, mmckay@Jefferies.com
|
Please see important
disclosure information on pages 7 - 9 of this report.
|

|
A softening economy will
potentially have a mixed impact on Maximus. Despite definitive undercurrents of
concern regarding a recession, the National Association of State Budget
Officers is still projecting fiscal year 2008 spending growth near 5% overall.
Furthermore, approximately 65–70% of the company’s revenue currently comes from
state run but federally mandated and largely federally funded programs that are
relatively insulated from changes in the level of tax receipts at the state
level. In past economic downturns, the company was more leveraged to the
economic cycle given that the Consulting and Systems segments represented 40%
of revenue, compared to approximately 28% today. The current mix is heavily
weighted to services outsourcing from the Operations segment and the nature of
the work being done on the Systems and Consulting side carries a stickier
revenue stream than before. That said, discretionary spending cuts at the state
level remain a risk, more so in fiscal 2009, though it likely does not have a
material impact on Maximus’ core book of business.
Maximus repurchased $150
million of stock during the quarter, retiring approximately 3.8 million shares
at a share price of $39.91. The company used UBS as its broker. While the
interests of confidentiality precluded full disclosure of details, management
was able to confirm that the bank is continuing to purchase shares and has not
completely covered its position to date. Contractual obligations call for UBS
to complete its transactions by August 15, 2008. Given an outlook for
improving stock performance in FY08, we are keeping a keen eye on the impact on
cash flow from UBS potentially having to purchase shares at a higher VWAP and
subsequently requiring Maximus to make a cash outlay for the difference. That
said, the stock has underperformed recently and therefore UBS may be able to
purchase shares below the initial price, resulting in excess cash with which
management can choose to repurchase additional shares. The share repurchase has
been accretive to EPS and has not been detrimental to Maximus’ ability to meet
future liquidity requirements and investment opportunities. Furthermore,
Maximus continues to be significantly cash generative and management has also
arranged a $50 million credit facility that carries the potential to increase
to $75 million.
Revenue for fiscal 1Q was
$202 million, a 25% increase y/y. Revenue growth was primarily driven by the
Operations segment, which increased 43% y/y. Operating income was $16.5
million, representing an 8.2% operating margin that met expectations. Operating
margins showed substantial improvement y/y though declined sequentially due to
some 4Q seasonality in the Operations segment, investments made in the
Consulting segment, and losses related to legacy contracts and product
build-outs in the Systems segment. Management still expects total company
operating margins of approximately 10% for the fiscal year. Net income for the
quarter was $10.6 million or $0.51 per diluted share. Backing out a temporary
increase in the overall tax rate and a $2.2 million non-cash charge related to
stock based compensation from previous years, we estimate that EPS could have
been $0.07 higher. Cash flow from operations for the quarter was $20.8 million,
with free cash flow of $16.7 million. Management expects full fiscal year cash
flow from operations of $50–60 million and free cash flow of $30–40 million.
Operations segment revenue
for the quarter increased 43% y/y to $145.8 million. The segment accounted for
72% of total company revenue for the quarter. Gross margin for the segment was
24.2% . Operating margin was 12.8%, compared to an operating loss during the
same quarter last year. The segment growth and improved profitability was
largely due to increased activity in health and workforce services and
execution of a project portfolio optimization. Management indicated that
operating margins for the segment should be sustainable in the 12% to 15% range
for the remainder of fiscal 2008.
Consulting segment revenue
for the quarter was $22.2 million or approximately 11% of total company
revenue. Gross margin for the segment was 38.3%. Operating margin was 5.2%, a
300 bp improvement y/y. The improved performance reflects the company’s
transition away from the contingent fee federal healthcare claim market and
entry into new markets. Performance was tempered somewhat by required
investments in state Medicaid fraud prevention services.
Systems segment revenue for
the quarter was $34 million or approximately 17% of total company revenue.
Gross margin for the segment was 26.3%. The segment reported an operating loss
of $3.1 million. Results were negatively impacted by losses related to legacy
project issues and losses related to the product build-out of some web-based
applications. Management indicated that the same optimization process
successfully used to turnaround performance in the Operations segment is now
being applied to the Systems segment. However, management also indicated that
it will likely be 9–12 months before the segment will turn profitable. During
that time period, management also intends to evaluate strategic alternatives
for the aspects of the segment that were the root of the underperformance.
2
Company
Description
MAXIMUS was incorporated in
1975, has been publicly traded since 1997, and is based in Reston, Virginia.
The company offers services primarily to state and local governments, as well as
the federal government. In fiscal 3Q04 management reorganized the company into
three business segments: health services, human services, and technical
services. The main drivers of the business are program management and
outsourcing of health and human services that are federally mandated and
funded. In addition, the company is positioned to take advantage of legislative
actions encouraging state and local spending on modernization of voting
technology, improving port security, and offering improved educational
services. MAXIMUS is a member of the Russell 2000 and S&P 600 SmallCap
index.
3
Maximus, Inc.
2006-2009E Profit and Loss Model
|
|
|
|
|
|
|
|
|
|
|
|
|
|
|
|
|
|
|
|
|
|
|
|
|
|
|
|
|
|
|
|
|
|
|
|
|
|
|
|
|
|
|
|
|
|
|
|
|
($ in millions, except per share)
|
|
|
|
F2007A
|
|
|
|
F2008E
|
|
|
|
|
|
|
|
|
|
|
|
|
(FY End September)
|
|
F2006A
|
|
Q1A
|
|
Q2A
|
|
Q3A
|
|
Q4A
|
|
F2007A
|
|
Q1A
|
|
Q2E
|
|
Q3E
|
|
Q4E
|
|
F2008E
|
|
F2009E
|
|
C2006A
|
|
C2007A
|
|
C2008E
|
|
|
Income
Statement Data
|
|
|
|
|
|
|
|
|
|
|
|
|
|
|
|
|
|
|
|
|
|
|
|
|
|
|
|
|
|
|
|
|
Revenue
|
|
700.9
|
|
161.1
|
|
179.1
|
|
196.6
|
|
201.9
|
|
738.6
|
|
202.0
|
|
208.6
|
|
231.0
|
|
236.2
|
|
877.7
|
|
991.8
|
|
699.3
|
|
779.5
|
|
904.0
|
|
|
Cost of revenue
|
|
547.5
|
|
140.9
|
|
136.2
|
|
138.1
|
|
146.4
|
|
561.6
|
|
149.2
|
|
154.8
|
|
167.4
|
|
171.5
|
|
642.9
|
|
722.8
|
|
570.4
|
|
569.9
|
|
658.0
|
|
|
Gross
Income
|
|
153.4
|
|
20.3
|
|
42.9
|
|
58.4
|
|
55.5
|
|
177.1
|
|
52.8
|
|
53.8
|
|
63.5
|
|
64.7
|
|
234.8
|
|
269.1
|
|
128.9
|
|
209.6
|
|
246.0
|
|
|
Selling,
general & administrative
|
|
129.7
|
|
34.7
|
|
34.5
|
|
35.4
|
|
31.1
|
|
135.6
|
|
34.1
|
|
35.5
|
|
37.0
|
|
37.8
|
|
144.3
|
|
169.6
|
|
132.8
|
|
135.0
|
|
153.1
|
|
|
Amortization of
intangibles
|
|
0.0
|
|
0.0
|
|
0.0
|
|
0.0
|
|
0.0
|
|
0.0
|
|
0.0
|
|
0.0
|
|
0.0
|
|
0.0
|
|
0.0
|
|
0.0
|
|
0.0
|
|
0.0
|
|
0.0
|
|
|
Other
|
|
26.5
|
|
3.0
|
|
6.1
|
|
33.0
|
|
2.5
|
|
44.6
|
|
2.2
|
|
0.0
|
|
0.0
|
|
0.0
|
|
2.2
|
|
0.0
|
|
29.0
|
|
43.8
|
|
0.0
|
|
|
Total operating expenses
|
|
703.7
|
|
178.5
|
|
176.8
|
|
206.5
|
|
180.0
|
|
741.8
|
|
185.4
|
|
190.3
|
|
204.4
|
|
209.3
|
|
789.4
|
|
892.3
|
|
732.2
|
|
748.7
|
|
811.1
|
|
|
Op Inc
- Exc Options & One-time
|
|
23.7
|
|
(14.4
|
)
|
8.4
|
|
23.1
|
|
24.4
|
|
41.5
|
|
18.7
|
|
18.4
|
|
26.6
|
|
26.9
|
|
90.6
|
|
99.5
|
|
(3.9
|
)
|
74.6
|
|
92.8
|
|
|
Interest income, net
|
|
6.9
|
|
0.5
|
|
1.6
|
|
1.1
|
|
2.6
|
|
5.8
|
|
1.5
|
|
0.4
|
|
0.5
|
|
0.5
|
|
2.9
|
|
2.5
|
|
5.3
|
|
6.8
|
|
1.9
|
|
|
Other, net
|
|
0.0
|
|
0.7
|
|
0.0
|
|
(0.2
|
)
|
0.0
|
|
0.5
|
|
0.0
|
|
0.0
|
|
0.0
|
|
0.0
|
|
0.0
|
|
0.0
|
|
0.7
|
|
(0.2
|
)
|
0.0
|
|
|
Pretax income -
Operating
|
|
30.5
|
|
(13.2
|
)
|
10.0
|
|
24.0
|
|
27.0
|
|
47.8
|
|
20.2
|
|
18.8
|
|
27.0
|
|
27.4
|
|
93.4
|
|
102.0
|
|
2.1
|
|
81.2
|
|
94.7
|
|
|
Taxes - Operating
|
|
11.9
|
|
(4.7
|
)
|
4.0
|
|
9.5
|
|
11.3
|
|
20.1
|
|
8.3
|
|
7.4
|
|
10.7
|
|
10.8
|
|
37.2
|
|
40.3
|
|
1.3
|
|
33.1
|
|
37.4
|
|
|
Cumulative effect
accounting change
|
|
0.0
|
|
0.0
|
|
0.0
|
|
0.0
|
|
0.0
|
|
0.0
|
|
0.0
|
|
0.0
|
|
0.0
|
|
0.0
|
|
0.0
|
|
0.0
|
|
0.0
|
|
0.0
|
|
0.0
|
|
|
N.I. - Exc. One-time,
Options & Div
|
|
18.6
|
|
(8.5
|
)
|
6.0
|
|
14.5
|
|
15.6
|
|
27.7
|
|
11.9
|
|
11.3
|
|
16.3
|
|
16.6
|
|
56.2
|
|
61.7
|
|
0.8
|
|
48.1
|
|
57.3
|
|
|
Diluted EPS - Operating
|
|
$
|
|
0.85
|
|
$
|
|
(0.39
|
)
|
$
|
|
0.27
|
|
$
|
|
0.65
|
|
$
|
|
0.69
|
|
$
|
|
1.26
|
|
$
|
|
0.57
|
|
$
|
|
0.60
|
|
$
|
|
0.86
|
|
$
|
|
0.87
|
|
$
|
|
2.88
|
|
$
|
|
3.20
|
|
$
|
|
0.03
|
|
$
|
|
2.19
|
|
$
|
|
3.00
|
|
|
Diluted
EPS - Reported
|
|
$
|
|
0.11
|
|
$
|
|
(0.48
|
)
|
$
|
|
0.11
|
|
$
|
|
(0.65
|
)
|
$
|
|
0.63
|
|
$
|
|
(0.37
|
)
|
$
|
|
0.51
|
|
$
|
|
0.60
|
|
$
|
|
0.86
|
|
$
|
|
0.87
|
|
$
|
|
2.81
|
|
$
|
|
3.20
|
|
$
|
|
(0.79
|
)
|
$
|
|
0.59
|
|
$
|
|
3.00
|
|
|
Diluted Shares
Outstanding
|
|
21.8
|
|
21.6
|
|
22.0
|
|
22.0
|
|
22.6
|
|
22.0
|
|
20.9
|
|
19.0
|
|
19.1
|
|
19.2
|
|
19.5
|
|
19.3
|
|
21.5
|
|
21.8
|
|
19.1
|
|
|
Growth
|
|
|
|
|
|
|
|
|
|
|
|
|
|
|
|
|
|
|
|
|
|
|
|
|
|
|
|
|
|
|
|
|
Revenue
|
|
8.2
|
%
|
(1.0
|
)%
|
(0.4
|
)%
|
5.3
|
%
|
17.5
|
%
|
5.4
|
%
|
25.3
|
%
|
16.5
|
%
|
17.5
|
%
|
17.0
|
%
|
18.8
|
%
|
13.0
|
%
|
6.3
|
%
|
11.5
|
%
|
16.0
|
%
|
|
Operating income
|
|
(62.6
|
)%
|
N/A
|
|
(41.7
|
)%
|
N/A
|
|
3521.4
|
%
|
75.3
|
%
|
N/A
|
|
117.9
|
%
|
15.1
|
%
|
10.5
|
%
|
118.2
|
%
|
9.9
|
%
|
N/A
|
|
N/A
|
|
24.5
|
%
|
|
Net income
|
|
(53.7
|
)%
|
N/A
|
|
(35.3
|
)%
|
N/A
|
|
986.8
|
%
|
48.7
|
%
|
N/A
|
|
88.3
|
%
|
12.6
|
%
|
6.1
|
%
|
103.0
|
%
|
9.8
|
%
|
(98.0
|
)%
|
5782.5
|
%
|
19.3
|
%
|
|
EPS - Operating
|
|
(54.0
|
)%
|
N/A
|
|
(35.6
|
)%
|
N/A
|
|
911.9
|
%
|
47.3
|
%
|
N/A
|
|
118.3
|
%
|
31.2
|
%
|
25.0
|
%
|
129.2
|
%
|
11.1
|
%
|
(98.2
|
)%
|
6448.1
|
%
|
37.0
|
%
|
|
Margin
Analysis
|
|
|
|
|
|
|
|
|
|
|
|
|
|
|
|
|
|
|
|
|
|
|
|
|
|
|
|
|
|
|
|
|
Cost of revenue
|
|
78.1
|
%
|
87.4
|
%
|
76.1
|
%
|
70.3
|
%
|
72.5
|
%
|
76.0
|
%
|
73.9
|
%
|
74.2
|
%
|
72.5
|
%
|
72.6
|
%
|
73.2
|
%
|
73.1
|
%
|
81.6
|
%
|
73.1
|
%
|
72.8
|
%
|
|
Gross income
|
|
21.9
|
%
|
12.6
|
%
|
23.9
|
%
|
29.7
|
%
|
27.5
|
%
|
24.0
|
%
|
26.1
|
%
|
25.8
|
%
|
27.5
|
%
|
27.4
|
%
|
26.8
|
%
|
27.1
|
%
|
18.4
|
%
|
26.9
|
%
|
27.2
|
%
|
|
S,G&A
|
|
18.5
|
%
|
21.5
|
%
|
19.2
|
%
|
18.0
|
%
|
15.4
|
%
|
18.4
|
%
|
16.9
|
%
|
17.0
|
%
|
16.0
|
%
|
16.0
|
%
|
16.4
|
%
|
17.1
|
%
|
19.0
|
%
|
17.3
|
%
|
16.9
|
%
|
|
Amortization
|
|
0.0
|
%
|
0.0
|
%
|
0.0
|
%
|
0.0
|
%
|
0.0
|
%
|
0.0
|
%
|
0.0
|
%
|
0.0
|
%
|
0.0
|
%
|
0.0
|
%
|
0.0
|
%
|
0.0
|
%
|
0.0
|
%
|
0.0
|
%
|
0.0
|
%
|
|
Operating
Income
|
|
3.4
|
%
|
(8.9
|
)%
|
4.7
|
%
|
11.7
|
%
|
12.1
|
%
|
5.6
|
%
|
9.3
|
%
|
8.8
|
%
|
11.5
|
%
|
11.4
|
%
|
10.3
|
%
|
10.0
|
%
|
(0.6
|
)%
|
9.6
|
%
|
10.3
|
%
|
|
Pretax Income
|
|
4.4
|
%
|
-8.2
|
%
|
5.6
|
%
|
12.2
|
%
|
13.4
|
%
|
6.5
|
%
|
10.0
|
%
|
9.0
|
%
|
11.7
|
%
|
11.6
|
%
|
10.6
|
%
|
10.3
|
%
|
0.3
|
%
|
10.4
|
%
|
10.5
|
%
|
|
Tax rate
|
|
39.0
|
%
|
35.9
|
%
|
40.0
|
%
|
-59.4
|
%
|
42.0
|
%
|
364.7
|
%
|
41.1
|
%
|
39.5
|
%
|
39.5
|
%
|
39.5
|
%
|
39.8
|
%
|
39.5
|
%
|
61.1
|
%
|
40.8
|
%
|
39.5
|
%
|
|
Net Income
|
|
2.7
|
%
|
(5.3
|
)%
|
3.4
|
%
|
7.4
|
%
|
7.7
|
%
|
3.7
|
%
|
5.9
|
%
|
5.4
|
%
|
7.1
|
%
|
7.0
|
%
|
6.4
|
%
|
6.2
|
%
|
0.1
|
%
|
6.2
|
%
|
6.3
|
%
|
|
|
|
|
|
|
|
|
|
|
|
|
|
|
|
|
|
|
|
|
|
|
|
|
|
|
|
|
|
|
|
|
|
|
|
|
|
|
|
|
|
|
|
|
|
|
|
|
Source: Company reports and Jefferies & Company
estimates
Note:
Operating EPS excludes one-time gains and charges.
4
Maximus, Inc.
2006-2009E Balance Sheet and Cash Flow Model
|
($ in millions, except per share)
|
|
|
|
|
|
F2008E
|
|
|
|
|
|
|
|
|
|
|
|
|
(FY End September)
|
|
2006A
|
|
2007A
|
|
Q1A
|
|
Q2E
|
|
Q3E
|
|
Q4E
|
|
2008E
|
|
2009E
|
|
C2006A
|
|
C2007A
|
|
C2008E
|
|
|
Balance
Sheet Summary
|
|
|
|
|
|
|
|
|
|
|
|
|
|
|
|
|
|
|
|
|
|
|
|
|
Cash and Cash
Equivalents
|
|
$
|
158.4
|
|
$
|
197.0
|
|
$
|
62.7
|
|
$
|
51.7
|
|
$
|
59.4
|
|
$
|
70.9
|
|
$
|
70.9
|
|
$
|
104.7
|
|
$
|
164.1
|
|
$
|
62.7
|
|
$
|
96.7
|
|
|
Receivables
|
|
201.1
|
|
175.2
|
|
169.0
|
|
203.3
|
|
222.2
|
|
218.7
|
|
218.7
|
|
250.1
|
|
166.9
|
|
169.0
|
|
191.0
|
|
|
Other
|
|
24.2
|
|
26.6
|
|
19.0
|
|
21.3
|
|
19.4
|
|
22.0
|
|
22.0
|
|
23.4
|
|
30.2
|
|
19.0
|
|
20.0
|
|
|
Total Current Assets
|
|
383.7
|
|
398.7
|
|
250.6
|
|
276.3
|
|
301.0
|
|
311.6
|
|
311.6
|
|
378.2
|
|
361.2
|
|
250.6
|
|
307.6
|
|
|
Property,
Equipment & Software, Net
|
|
67.4
|
|
65.4
|
|
64.9
|
|
64.6
|
|
64.1
|
|
63.9
|
|
63.9
|
|
65.6
|
|
64.6
|
|
64.9
|
|
64.6
|
|
|
Investments
|
|
0.0
|
|
0.0
|
|
0.0
|
|
0.0
|
|
0.0
|
|
0.0
|
|
0.0
|
|
0.0
|
|
0.0
|
|
0.0
|
|
0.0
|
|
|
Goodwill &
Other Intangibles
|
|
92.4
|
|
89.7
|
|
89.3
|
|
89.3
|
|
89.3
|
|
89.3
|
|
89.3
|
|
89.3
|
|
90.9
|
|
89.3
|
|
89.3
|
|
|
Other
|
|
15.1
|
|
10.6
|
|
11.3
|
|
13.4
|
|
13.4
|
|
13.0
|
|
13.0
|
|
14.3
|
|
12.7
|
|
11.3
|
|
12.3
|
|
|
Total
Assets
|
|
558.5
|
|
564.5
|
|
416.1
|
|
443.6
|
|
467.8
|
|
477.8
|
|
477.8
|
|
547.3
|
|
529.4
|
|
416.1
|
|
473.8
|
|
|
Accounts Payable
|
|
54.5
|
|
54.4
|
|
52.4
|
|
58.5
|
|
60.7
|
|
63.8
|
|
63.8
|
|
72.5
|
|
44.4
|
|
52.4
|
|
57.8
|
|
|
Accrued Expenses
|
|
24.4
|
|
29.4
|
|
25.8
|
|
28.1
|
|
32.8
|
|
34.5
|
|
34.5
|
|
38.9
|
|
22.2
|
|
25.8
|
|
29.1
|
|
|
Current Portion
Long-term Debt
|
|
1.7
|
|
1.6
|
|
1.6
|
|
1.6
|
|
1.6
|
|
1.6
|
|
1.6
|
|
1.6
|
|
1.7
|
|
1.6
|
|
1.6
|
|
|
Deferred Revenue
|
|
54.4
|
|
38.5
|
|
37.5
|
|
48.3
|
|
52.8
|
|
45.1
|
|
45.1
|
|
51.0
|
|
48.3
|
|
37.5
|
|
42.3
|
|
|
Other
|
|
1.6
|
|
7.5
|
|
2.7
|
|
3.3
|
|
3.5
|
|
3.5
|
|
3.5
|
|
3.8
|
|
1.1
|
|
2.7
|
|
3.5
|
|
|
Total Current
Liabilities
|
|
136.6
|
|
131.6
|
|
120.0
|
|
139.8
|
|
151.3
|
|
148.5
|
|
148.5
|
|
167.9
|
|
117.6
|
|
120.0
|
|
134.3
|
|
|
Long-term Debt
|
|
2.0
|
|
0.4
|
|
0.0
|
|
0.0
|
|
0.0
|
|
0.0
|
|
0.0
|
|
0.0
|
|
1.6
|
|
0.0
|
|
0.0
|
|
|
Other
|
|
14.9
|
|
23.1
|
|
23.5
|
|
23.5
|
|
23.5
|
|
23.5
|
|
23.5
|
|
23.5
|
|
13.7
|
|
23.5
|
|
23.5
|
|
|
Total Liabilities
|
|
153.6
|
|
155.1
|
|
143.5
|
|
163.3
|
|
174.9
|
|
172.0
|
|
172.0
|
|
191.4
|
|
133.0
|
|
143.5
|
|
157.8
|
|
|
Minorty Interest
|
|
0.0
|
|
0.0
|
|
0.0
|
|
0.0
|
|
0.0
|
|
0.0
|
|
0.0
|
|
0.0
|
|
0.0
|
|
0.0
|
|
0.0
|
|
|
Total Shareholders’
Equity
|
|
404.9
|
|
409.4
|
|
272.6
|
|
280.2
|
|
292.9
|
|
305.8
|
|
305.8
|
|
355.9
|
|
396.5
|
|
272.6
|
|
315.9
|
|
|
Total
Liabilities and Owners Equity
|
|
$
|
558.5
|
|
$
|
564.5
|
|
$
|
416.1
|
|
$
|
443.6
|
|
$
|
467.8
|
|
$
|
477.8
|
|
$
|
477.8
|
|
$
|
547.3
|
|
$
|
529.4
|
|
$
|
416.1
|
|
$
|
473.8
|
|
|
Balance Sheet Metrics
|
|
|
|
|
|
|
|
|
|
|
|
|
|
|
|
|
|
|
|
|
|
|
|
|
DSO
|
|
80
|
|
66
|
|
56
|
|
69
|
|
69
|
|
68
|
|
73
|
|
74
|
|
72
|
|
56
|
|
55
|
|
|
DSO (Unbilled)
|
|
25
|
|
21
|
|
22
|
|
20
|
|
19
|
|
17
|
|
18
|
|
18
|
|
23
|
|
22
|
|
21
|
|
|
DPO
|
|
36
|
|
35
|
|
32
|
|
34
|
|
33
|
|
34
|
|
36
|
|
37
|
|
29
|
|
32
|
|
32
|
|
|
ROE
|
|
0.6
|
%
|
(2.0
|
)%
|
0.6
|
%
|
6.4
|
%
|
15.3
|
%
|
15.3
|
%
|
15.3
|
%
|
18.7
|
%
|
(4.2
|
)%
|
0.6
|
%
|
19.5
|
%
|
|
ROIC
(incl GW)
|
|
(4.8
|
)%
|
(3.4
|
)%
|
5.9
|
%
|
7.1
|
%
|
16.9
|
%
|
16.5
|
%
|
16.5
|
%
|
15.5
|
%
|
(12.1
|
)%
|
5.9
|
%
|
16.2
|
%
|
|
Debt/ Capital
|
|
0.9
|
%
|
0.5
|
%
|
0.6
|
%
|
0.6
|
%
|
0.6
|
%
|
0.5
|
%
|
0.5
|
%
|
0.5
|
%
|
0.8
|
%
|
0.6
|
%
|
0.5
|
%
|
|
Debt/ TTM EBITDA
|
|
0.3x
|
|
0.1x
|
|
0.0x
|
|
0.0x
|
|
0.0x
|
|
0.0x
|
|
0.0x
|
|
0.0x
|
|
(0.2)x
|
|
0.0x
|
|
0.0x
|
|
|
Net Cash/ Share
|
|
$
|
7.02
|
|
$
|
8.84
|
|
$
|
2.91
|
|
$
|
2.62
|
|
$
|
3.02
|
|
$
|
3.60
|
|
$
|
3.53
|
|
$
|
5.33
|
|
$
|
7.43
|
|
$
|
2.91
|
|
$
|
4.93
|
|
|
Book Value/Share
|
|
$
|
18.56
|
|
$
|
18.59
|
|
$
|
13.07
|
|
$
|
14.79
|
|
$
|
15.37
|
|
$
|
15.97
|
|
$
|
15.68
|
|
$
|
18.46
|
|
$
|
18.36
|
|
$
|
13.07
|
|
$
|
16.45
|
|
|
Invested Capital (in
GW)
|
|
355.8
|
|
358.4
|
|
353.9
|
|
365.8
|
|
352.1
|
|
376.2
|
|
376.2
|
|
424.2
|
|
354.6
|
|
353.9
|
|
375.8
|
|
|
Cash
Flow Summary
|
|
|
|
|
|
|
|
|
|
|
|
|
|
|
|
|
|
|
|
|
|
|
|
|
Operating Sources
|
|
679.3
|
|
782.3
|
|
210.7
|
|
169.9
|
|
214.0
|
|
237.4
|
|
832.0
|
|
957.8
|
|
727.1
|
|
793.1
|
|
880.0
|
|
|
Operating Uses
|
|
689.8
|
|
748.9
|
|
194.0
|
|
175.9
|
|
201.4
|
|
221.1
|
|
792.4
|
|
904.3
|
|
731.6
|
|
748.4
|
|
826.4
|
|
|
Free
Cash Flow
|
|
(10.4
|
)
|
33.4
|
|
16.7
|
|
(6.1
|
)
|
12.6
|
|
16.3
|
|
39.5
|
|
53.5
|
|
(4.5
|
)
|
44.7
|
|
53.6
|
|
|
Acquisitions/ LT
Investments
|
|
0.0
|
|
1.9
|
|
0.0
|
|
0.0
|
|
0.0
|
|
0.0
|
|
0.0
|
|
0.0
|
|
2.2
|
|
(0.3
|
)
|
0.0
|
|
|
Non-operating Cash Flow
|
|
(9.1
|
)
|
(4.3
|
)
|
(24.9
|
)
|
(4.9
|
)
|
(4.9
|
)
|
(4.9
|
)
|
(39.5
|
)
|
(19.6
|
)
|
(12.3
|
)
|
(4.0
|
)
|
(19.5
|
)
|
|
Reported CFO
|
|
15.7
|
|
51.2
|
|
20.8
|
|
(1.0
|
)
|
17.7
|
|
21.5
|
|
59.1
|
|
77.2
|
|
18.3
|
|
64.4
|
|
74.9
|
|
|
NOPAT
|
|
(17.2
|
)
|
(12.1
|
)
|
15.2
|
|
12.2
|
|
17.2
|
|
17.5
|
|
62.2
|
|
65.6
|
|
(43.0
|
)
|
20.7
|
|
61.0
|
|
|
EBITDA
|
|
14.8
|
|
17.8
|
|
21.6
|
|
23.8
|
|
32.2
|
|
32.3
|
|
109.8
|
|
121.6
|
|
(14.3
|
)
|
51.7
|
|
114.4
|
|
|
Annual Growth
|
|
|
|
|
|
|
|
|
|
|
|
|
|
|
|
|
|
|
|
|
|
|
|
|
Operating Sources
|
|
8.4
|
%
|
15.2
|
%
|
5.4
|
%
|
(6.5
|
)%
|
4.8
|
%
|
20.8
|
%
|
6.3
|
%
|
15.1
|
%
|
15.4
|
%
|
9.1
|
%
|
11.0
|
%
|
|
Operating Uses
|
|
19.6
|
%
|
8.6
|
%
|
(0.3
|
)%
|
4.9
|
%
|
16.6
|
%
|
3.3
|
%
|
5.8
|
%
|
14.1
|
%
|
24.8
|
%
|
2.3
|
%
|
10.4
|
%
|
|
Free
Cash Flow
|
|
N/A
|
|
N/A
|
|
209.1
|
%
|
N/A
|
|
(60.1
|
)%
|
N/A
|
|
18.5
|
%
|
35.3
|
%
|
N/A
|
|
N/A
|
|
20.0
|
%
|
|
Reported CFO
|
|
(78.8
|
)%
|
226.1
|
%
|
172.6
|
%
|
N/A
|
|
(48.3
|
)%
|
N/A
|
|
15.4
|
%
|
30.7
|
%
|
(73.5
|
)%
|
252.2
|
%
|
16.4
|
%
|
|
Cash Flow per Share Data
|
|
|
|
|
|
|
|
|
|
|
|
|
|
|
|
|
|
|
|
|
|
|
|
|
Free
Cash Flow
|
|
$
|
(0.48
|
)
|
$
|
1.51
|
|
$
|
0.80
|
|
$
|
(0.32
|
)
|
$
|
0.66
|
|
$
|
0.85
|
|
$
|
2.03
|
|
$
|
2.77
|
|
$
|
(0.23
|
)
|
$
|
2.09
|
|
$
|
2.79
|
|
|
Reported CFO
|
|
$
|
0.72
|
|
$
|
2.32
|
|
$
|
1.00
|
|
$
|
(0.05
|
)
|
$
|
0.93
|
|
$
|
1.12
|
|
$
|
3.03
|
|
$
|
4.00
|
|
$
|
0.84
|
|
$
|
2.99
|
|
$
|
3.91
|
|
|
EBITDA
|
|
$
|
0.68
|
|
$
|
0.81
|
|
$
|
1.03
|
|
$
|
1.26
|
|
$
|
1.69
|
|
$
|
1.69
|
|
$
|
5.63
|
|
$
|
6.31
|
|
$
|
(0.67
|
)
|
$
|
2.37
|
|
$
|
5.99
|
|
Notes:
Operating
Sources defined as Revenue + Decrease in operating assets + Adjustments for
acquisitions and reclassifications
Operating
Use defined as Cash expenses + Decrease in operating liabilities + Capital
expenditures & capitalized software
Free
Cash Flow = Operating Sources - Operating Uses
Source: Company Reports and Jefferies & Co.
estimates
5
|
|
|
One-Year Price Target
|
|
Discounted Cash Flow Analysis (10-Year)
|
($ in millions, except per share)
|
Projection Period Assumptions
|
Last
Actual FY End:
|
|
9/30/2007
|
|
|
Exit
Multiple FY End:
|
|
9/30/2017
|
|
|
Price
Target Date:
|
|
2/7/2009
|
|
|
Calendar
Adjustment Factor:
|
|
-1.36
|
|
Discount Assumptions
|
Base
discount rate:
|
|
10.5
|
%
|
|
Incremental
discount rate:
|
|
2
|
%
|
|
Derived
WACC
|
|
13.1
|
%
|
Operating Assumptions
|
|
|
F2008E
|
|
F2009E
|
|
|
Organic
Growth
|
|
18.8
|
%
|
13.0
|
%
|
|
Acquired
Revenue
|
|
0.0
|
%
|
0.0
|
%
|
|
Operating
Margin
|
|
10.3
|
%
|
10.0
|
%
|
|
DSO
|
|
91
|
|
92
|
|
|
ROIC
(In GW)
|
|
16.5
|
%
|
15.5
|
%
|
|
Balance Sheet Adjustments
|
|
Dec-07
|
|
|
Cash &
ST Investments
|
|
62
|
|
|
ST &
LT Debt
|
|
2
|
|
Miscellaneous
|
5-Year
Normal Growth
|
|
15
|
%
|
|
10-Year
Treasury Yield
|
|
3.6
|
%
|
|
Estimated
Beta
|
|
1.68
|
|
|
Debt
Interest Rate
|
|
7.0
|
%
|
|
Expected
S&P 500 Performance
|
|
9.0
|
%
|
|
Diluted
Shares Outstanding
|
|
19.0
|
|
Exit Multiple Assumptions
|
FCF
exit multiple
|
|
10.7x
|
|
|
Incremental
exit multiple
|
|
0.5x
|
|
|
|
|
F2007A
|
|
F2008E
|
|
F2009E
|
|
F2010E
|
|
F2011E
|
|
F2012E
|
|
F2013E
|
|
F2014E
|
|
F2015E
|
|
F2016E
|
|
F2017E
|
|
|
Free cash flow
|
|
33.4
|
|
39.5
|
|
53.5
|
|
61.5
|
|
70.7
|
|
81.4
|
|
91.9
|
|
102.0
|
|
111.2
|
|
119.0
|
|
125.0
|
|
|
Growth Rate
|
|
|
|
19
|
%
|
35
|
%
|
15
|
%
|
15
|
%
|
15
|
%
|
13
|
%
|
11
|
%
|
9
|
%
|
7
|
%
|
5
|
%
|
Note: FCF equals CFO minus Capital Expenditures and
Capitalized Software
|
|
|
10.5% Discount Rate
|
|
12.5% Discount Rate
|
|
14.5% Discount Rate
|
|
|
FCF Multiple
|
|
10.7x
|
|
11.2x
|
|
11.7x
|
|
10.7x
|
|
11.2x
|
|
11.7x
|
|
10.7x
|
|
11.2x
|
|
11.7x
|
|
|
Terminal Value
|
|
1,334
|
|
1,396
|
|
1,459
|
|
1,334
|
|
1,396
|
|
1,459
|
|
1,334
|
|
1,396
|
|
1,459
|
|
|
Present Value of
Terminal Value
|
|
562
|
|
589
|
|
615
|
|
482
|
|
504
|
|
527
|
|
414
|
|
433
|
|
452
|
|
|
Present Value of Cash
Flows
|
|
515
|
|
515
|
|
515
|
|
478
|
|
478
|
|
478
|
|
445
|
|
445
|
|
445
|
|
|
Asset Value
|
|
1,077
|
|
1,103
|
|
1,130
|
|
959
|
|
982
|
|
1,004
|
|
858
|
|
877
|
|
897
|
|
|
|
|
|
|
|
|
|
|
|
|
|
|
|
|
|
|
|
|
|
|
|
Cash
|
|
62
|
|
62
|
|
62
|
|
62
|
|
62
|
|
62
|
|
62
|
|
62
|
|
62
|
|
|
Debt
|
|
2
|
|
2
|
|
2
|
|
2
|
|
2
|
|
2
|
|
2
|
|
2
|
|
2
|
|
|
Implied Equity Value
|
|
1,138
|
|
1,164
|
|
1,191
|
|
1,020
|
|
1,042
|
|
1,065
|
|
919
|
|
938
|
|
958
|
|
|
Implied Equity Value per
Share
|
|
$
|
60.03
|
|
$
|
61.42
|
|
$
|
62.81
|
|
$
|
53.81
|
|
$
|
55.00
|
|
$
|
56.19
|
|
$
|
48.47
|
|
$
|
49.50
|
|
$
|
50.52
|
|
|
|
|
|
|
|
|
|
|
|
|
|
|
|
|
|
|
|
|
|
|
|
Implied
Perpetual Growth Rate
|
|
1.0
|
%
|
1.4
|
%
|
1.8
|
%
|
2.9%
|
|
3.3
|
%
|
3.6
|
%
|
4.7%
|
|
5.1
|
%
|
5.5
|
%
|
|
|
|
|
|
|
|
|
|
|
|
|
|
|
|
|
|
|
|
|
|
|
|
|
|
|
|
|
|
Source: Jefferies & Company, Inc.
6
ANALYST
CERTIFICATIONS
I, Matthew McKay, CFA,
certify that all of the views expressed in this research report accurately
reflect my personal views about the subject security(ies) and subject
company(ies). I also certify that no part of my compensation was, is, or will
be, directly or indirectly, related to the specific recommendations or views
expressed in this research report.
I, Jason O’Connell, certify
that all of the views expressed in this research report accurately reflect my
personal views about the subject security(ies) and subject company(ies). I also
certify that no part of my compensation was, is, or will be, directly or
indirectly, related to the specific recommendations or views expressed in this
research report.
Important
Disclosures
As is the case with all
Jefferies employees, the analyst(s) responsible for the coverage of the
financial instruments discussed in this report receive compensation based in
part on the overall performance of the firm, including investment banking
income. We seek to update our research as appropriate, but various regulations
may prevent us from doing so. Aside from certain industry reports published on
a periodic basis, the large majority of reports are published at irregular
intervals as appropriate in the analyst’s judgement.
Meanings of
Jefferies & Company, Inc, Ratings
Buy - Describes stocks that
we expect to provide a total return (price appreciation plus yield) of 15% or
more within a 12-month period.
Hold - Describes stocks that
we expect to provide a total return (price appreciation plus yield) of plus or
minus 15% within a 12-month period.
Underperform - Describes
stocks that we expect to provide a total negative return (price appreciation
plus yield) of 15% or more within a 12-month period.
Our focus on
mid-capitalization and growth companies implies that many of the companies we
cover are typically more volatile than the overall stock market, which can be
amplified for companies with an average stock price consistently below $10. For
companies in this category only, the expected total return (price appreciation
plus yield) for Buy rated stocks is 20% or more within a 12-month period. For
Hold rated stocks with an average stock price consistently below $10, the
expected total return (price appreciation plus yield) is plus or minus 20%
within a 12-month period. For Underperform rated stocks with an average stock
price consistently below $10, the expected total return (price appreciation
plus yield) is minus 20% within a 12-month period.
NR - The investment rating
and price target have been temporarily suspended. Such suspensions are in
compliance with applicable regulations and/or Jefferies &
Company, Inc. policies.
CS - Coverage Suspended.
Jefferies & Company, Inc. has suspended coverage of this company.
NC - Not covered.
Jefferies & Company, Inc. does not cover this company.
Speculative Buy - Describes
stocks we view with a positive bias, whose company fundamentals and financials
are being monitored, but for which there is insufficient information for Jefferies &
Company, Inc. to assign a Buy, Hold or Underperform Rating. At the
discretion of the analyst, a Speculative buy-rated stock could also include
stocks with a price under $5, or where the company is not investment grade to
highlight the risk of the situation.
Speculative Underperform -
Describes stocks we view with a negative bias, whose company fundamentals and
financials are being monitored, but for which there is insufficient information
for Jefferies & Company, Inc. to assign a Buy, Hold or Underperform
Rating. At the discretion of the analyst, a Speculative underperform-rated
stock could also include stocks with a price under $5, or where the company is
not investment grade to highlight the risk of the situation.
Restricted - Describes issuers
where, in conjunction with Jefferies engagement in certain transactions,
company policy or applicable securities regulations prohibit certain types of
communications, including investment recommendations.
Monitor - Describes stocks
whose company fundamentals and financials are being monitored, and for which no
financial projections or opinions on the investment merits of the company are
provided.
7
Valuation
Methodology
Jefferies’ methodology for
assigning ratings may include the following: market capitalization, maturity,
growth/value, volatility and expected total return over the next 12 months. The
price targets are based on several methodologies, which may include, but are
not restricted to, analyses of market risk, growth rate, revenue stream,
discounted cash flow (DCF), EBITDA, EPS, cash flow (CF), free cash flow (FCF),
EV/EBITDA, P/E, PE/growth, P/CF, P/FCF, premium (discount)/average group
EV/EBITDA, premium (discount)/average group P/E, sum of the parts, net asset
value, dividend returns, and return on equity (ROE) over the next 12 months.
Risk which
may impede the achievement of our Price Target
This report was prepared for
general circulation and does not provide investment recommendations specific to
individual investors. As such, the financial instruments discussed in this
report may not be suitable for all investors and investors must make their own
investment decisions based upon their specific investment objectives and
financial situation utilizing their own financial advisors as they deem
necessary. Past performance of the financial instruments recommended in this
report should not be taken as an indication or guarantee of future results. The
price, value of, and income from, any of the financial instruments mentioned in
this report can rise as well as fall and may be affected by changes in
economic, financial and political factors. If a financial instrument is
denominated in a currency other than the investor’s home currency, a change in exchange
rates may adversely affect the price of, value of, or income derived from the
financial instrument described in this report. In addition, investors in
securities such as ADRs, whose values are affected by the currency of the
underlying security, effectively assume currency risk.
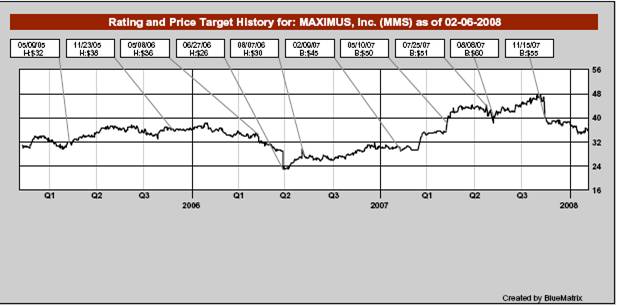
Distribution of Ratings
|
|
|
|
|
|
|
IB Serv./Past 12 Mos.
|
|
|
Rating
|
|
Count
|
|
Percent
|
|
Count
|
|
Percent
|
|
|
BUY [BUY/ SB]
|
|
509
|
|
58.71
|
|
60
|
|
11.79
|
|
|
|
|
|
|
|
|
|
|
|
|
|
HOLD [HOLD]
|
|
337
|
|
38.87
|
|
28
|
|
8.31
|
|
|
|
|
|
|
|
|
|
|
|
|
|
SELL [SU/ UNPF]
|
|
21
|
|
2.42
|
|
3
|
|
14.29
|
|
OTHER
DISCLOSURES
This
material has been prepared by Jefferies & Company, Inc. a
U.S.-registered broker-dealer, employing appropriate expertise, and in the
belief that it is fair and not misleading. The information upon which this
material is based was obtained from sources believed to be reliable, but has
not been independently verified, therefore, we do not guarantee its accuracy.
Additional and supporting information is available upon request. This is not an
offer or solicitation of an offer to buy or sell any security or investment.
Any opinion or estimates constitute our best judgment as of this date, and are
subject to change without notice. Jefferies & Company, Inc. and
Jefferies International Limited and their
8
affiliates and their
respective directors, officers and employees may buy or sell securities
mentioned herein as agent or principal for their own account.
Additional
information for UK and Canadian investors
This material is approved
for distribution in the United Kingdom by Jefferies International Limited which
is authorized and regulated by the Financial Services Authority (“FSA”). While
we believe this information and materials upon which this information was based
are accurate, except for any obligations under the rules of the FSA, we do
not guarantee its accuracy. This material is intended for use only by a person
or entity that qualifies as an authorised person or exempt person within the
meaning of section 19 of the UK Financial Services and Markets Act 2000 (the “Act”)
or qualifies as a person to whom the financial promotion restrictions imposed
by the Act does not apply by virtue of the Financial Services and Markets Act
2000 (Financial Promotion) Order 2005, or is a person classified as an “intermediate
customer” for the purposes of the Conduct of Business Rules of the FSA.
None of the investments or investment services mentioned or described herein
are available to other persons in the UK and in particular are not available to
“private customers” as defined by the rules of the FSA. For Canadian
investors, this material is intended for use only by professional or
institutional investors. None of the investments or investment services
mentioned or described herein are available to other persons or to anyone in
Canada who is not a “Designated Institution” as defined by the Securities Act
(Ontario).
This material does not
constitute a personal recommendation or take into account the particular
investment objectives, financial situations, or needs of individual clients.
Clients should consider whether any advice or recommendation in this report is
suitable for their particular circumstances and, if appropriate, seek
professional advice, including tax advice. The price and value of the
investments referred to herein and the income from them may fluctuate. Past
performance is not a guide to future performance, future returns are not
guaranteed, and a loss of original capital may occur. Fluctuations in exchange
rates could have adverse effects on the value or price of, or income derived
from, certain investments.
Jefferies &
Company, Inc. research reports are disseminated and available primarily
electronically, and, in some cases, in printed form. Electronic research is
simultaneously available to all clients. This report or any portion hereof may
not be reprinted, sold or redistributed without the written consent of
Jefferies & Company, Inc. Jefferies International Limited has
adopted a conflicts management policy in connection with the preparation and
publication of research, the details of which are available upon request in
writing to: The Compliance Officer, Jefferies International Limited, Vintners
Place, 68 Upper Thames Street, London EC4V 3BJ; telephone +44 (0)20 7029 8000;
facsimile +44 (0)20 7029 8010. Jefferies International Limited is authorised
and regulated by the Financial services Authority.
© 2008
Jefferies & Company, Inc,
9
Appendix 3
|
GARP
Research & Securities
|
|
Quarterly Summary
|
Jeff
Burnett
410.318.5014
burnett@garpresearch.com
February 7,
2008
|
|
|
MAXIMUS
(MMS)
|
|
Buy
|
|
|
|
MMS - $36
|
|
Market
Cap: $660 million
|
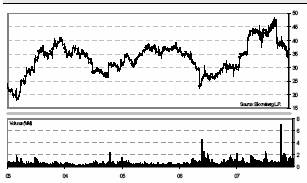
Company
Description:
MAXIMUS provides outsourced
program management support, IT services, and consulting primarily to state &
local governments. The company’s
competitive edge is its 30-year operating history, which provides an embedded
knowledge base of arcane government regulations and program administration and
support needs.
Operating &
Financial Highlights
($ Millions, Adjusted for
Certain Items, Sept. FY)
|
|
|
2007
|
|
2008F
|
|
2009F
|
|
2010F
|
|
|
Sales
|
|
739
|
|
865
|
|
985
|
|
1,125
|
|
|
Operating
Income
|
|
(3
|
)
|
84
|
|
114
|
|
133
|
|
|
|
|
|
|
|
|
|
|
|
|
|
Diluted
Shares
|
|
22
|
|
20
|
|
20
|
|
20
|
|
|
EPS
|
|
$
|
(0.38
|
)
|
$
|
2.75
|
|
$
|
3.63
|
|
$
|
4.20
|
|
|
EPS
(ex 123R)
|
|
$
|
(0.26
|
)
|
$
|
2.87
|
|
$
|
3.75
|
|
$
|
4.32
|
|
|
|
|
|
|
|
|
|
|
|
|
|
P/E
|
|
n/a
|
|
13
|
|
10
|
|
9
|
|
|
|
|
|
|
|
|
|
|
|
|
|
Operating
Margins
|
|
n/a
|
|
10
|
%
|
12
|
%
|
12
|
%
|
|
Capital
Employed
|
|
210
|
|
242
|
|
252
|
|
253
|
|
|
Pretax
ROCE
|
|
n/a
|
|
35
|
%
|
45
|
%
|
53
|
%
|
|
Pretax
ROTCE
|
|
n/a
|
|
55
|
%
|
70
|
%
|
82
|
%
|
FY 2008
Estimated Quarterly Results
|
|
|
Q1
|
|
Q2F
|
|
Q3f
|
|
Q4F
|
|
|
Sales
|
|
202
|
|
210
|
|
223
|
|
230
|
|
|
EPS
|
|
$
|
0.51
|
|
$
|
0.63
|
|
$
|
0.72
|
|
$
|
0.88
|
|
|
EPS
(ex. 123R)
|
|
$
|
0.54
|
|
$
|
0.66
|
|
$
|
0.75
|
|
$
|
0.91
|
|
GARP’s Quintile Ranking System
MMS scores
in GARP’s most attractive growth quintile and most attractive valuation
quintile. See disclaimer for additional information.
Summary
Points
Growth:
· Continued solid backlog of
sales opportunities and contract wins, and strong record of re-bid wins.
Quality:
· Leading position in its core
outsourcing businesses, with intellectual & operational barriers to
entry.
· Strong balance sheet; net
cash of $3/share. Solid cash generation. Pre-tax tangible ROCE is targeted to
exceed 80% within our 3-year investment horizon.
Control of Risk:
· MAXIMUS repurchased $150
million in stock in Q1 FY08 under its Accelerated Share Repurchase (ASR)
program; $40 million remains available for repurchase from prior
authorizations.
· MMS trades at 9x our
out-year (FY 2010F) EPS estimate of $4.20.
Recent
Developments
MAXIMUS’ fiscal Q108 results
were driven by its Operations segment (72% of Q1 sales), with normalized revenues
up 24%, driven by the Texas health & human services contract and
workforce services business. Operations recorded a 13% operating margin, up
from a loss in Q207. Consulting (11%) contributed sales of $22 million and a
modest 5% operating margin reflecting the transition from the contingent fee
business and investment in new markets such as Medicaid fraud. Systems’ (17%)
sales of $34 million were below expectations, and flattish with last year, with
an operating loss of $3 million versus a loss of $1.6 million last year. The
problems stemmed from education systems and justice businesses which required
significant IT spending; we are targeting profitability here by fiscal Q4
(September) 2008. The company’s cash position remains strong. MAXIMUS used $150
million to repurchase stock in Q1 (retiring ~3.8 million shares), enjoyed free
cash flow of $17 million, and ended the quarter with $63 million in net cash
(~$3/share). Management expects free cash flow of $30-40 million in FY 2008.
Driving both the top-line and margins going forward will be the company’s core
Operations segment, we believe. MAXIMUS’ sales pipeline remains robust, and
should reasonably support mid-teens revenue gains going forward. That said, the
state fiscal environment is mixed and could negatively impact discretionary
spending. But nearly 70% of MAXIMUS’ revenue is driven by state run,
federally-funded programs that should be largely resilient to budgetary issues
at the state level. Health care reform is a particularly promising opportunity
for MAXIMUS and its core outsourcing business.
Please refer to important
disclosures on final page. The information contained herein has been obtained
from sources believed reliable but is not necessarily complete and accuracy is
not guaranteed. Opinions do not constitute solicitation of orders.
Recommendation
Rationale
MAXIMUS is the leader in
several niche service markets in the state & local government
outsourcing sector including Medicaid eligibility and welfare-to-work.
Management is focusing on the company’s core health & human services
outsourcing strengths. Historically, MAXIMUS enjoyed high double-digit organic
growth because states outsource only a fraction of their services and the trend
is to do more. The past several years unveiled a marked slowing of new
government programs, yet MAXIMUS managed to grow its top line in the mid-single
digits and weather the budgetary storm. In calendar year 2005, MAXIMUS
strengthened its organization by adding senior managers, cutting
underperforming businesses, and investing in quality control and technology.
CEO Rich Montoni has installed financial discipline in the company; MAXIMUS is
focused on profitability, selectivity regarding its assignments, and
dispositions of non-strategic units. MAXIMUS announced in June 2006 that
it was amending its $370 million, 5-year Texas integrated eligibility &
enrollment subcontract with Accenture because of significant operational and
planning difficulties. This was the first time that MAXIMUS had agreed to
subcontract for a large scale assignment, and it proved to be a costly mistake.
In May 2007, then company announced that it extricated itself from a
contractor role on this project and now works as a prime contractor directly
with the Texas health & human services agency. We believe management’s
distraction with Texas is now behind us, and we anticipate a more
discriminating acceptance of new projects. Meanwhile, MAXIMUS generates cash,
enjoys a strong balance sheet ($3/share in net cash), and possesses a powerful
brand in the government sector based on its imbedded knowledge and 30-year
operating history. The company’s contract wins, strong re-bid wins, and robust
pipeline give us confidence that MAXIMUS can revert to its growth trajectory in
FY 2008.
Operations
With the exception of a
rather unusual FY 2007, MAXIMUS has been profitable every year since its
founding in 1975. The company employs minimal capital and can achieve a pretax
return on tangible capital (ROCE) exceeding 80% by FY (September) 2010F,
according to our estimate. However, deep problems associated with the company’s
Texas subcontract decimated reported earnings (and hence ROCE) beginning in FY
2006, but we project that this metric will rise again to strong levels within
our 3-year investment horizon.
MAXIMUS has three business
lines: Operations (68% of FY 2007 revenues), Consulting (13%), and Systems
(19%). The Operations segment includes health services such as project
management services for Medicaid and the Children’s Health Insurance Plan
(CHIP). MAXIMUS plugs in to state welfare records and assists states in making
sure that those who are eligible for Medicaid actually receive it. In addition
to Medicaid outreach, education and enrollment services, MAXIMUS customizes
information systems for state Medicaid programs, collects and analyses data,
and produces program materials. The company also administers programs for
uninsured and underinsured children as part of the CHIP in various states. In November 2004,
MAXIMUS signed a 10-year, $268 million health benefit administration contract
with the government of British Columbia (BC). The implementation of this
complex contract has been troublesome and MAXIMUS had been fined for certain
non-compliance issues. MAXIMUS appears to have its controls now in place and we
anticipate that it will be profitable in FY 2008. Human services-related
functions are included in the Operations segment, including child support
enforcement and welfare-to-work programs. The child care business is driven by
rigid federal performance standards. MAXIMUS typically recovers funds from
deadbeat dads and is compensated versus performance benchmarks. In addition to
enforcement services, MAXIMUS also performs collections, customer service,
payment processing, and systems consulting. MAXIMUS manages welfare-to-work
programs (typically 3-year contracts) and Workforce Investment Act programs
(state administered, federal job training funds for adults, youth, and
dislocated workers). The company’s Texas subcontract referenced above also
falls in the Operations segment. The company’s prowess in handling large
contracts had justifiably been called into question, but management has pledged
to avoid situations such as this going forward and will pursue prime contractor
roles on manageable assignments. Operating margins reached 8.2% in Q1 FY 08 and
management targets 10% as the corporate goal. MAXIMUS will focus on growing its
core health & human services opportunities going forward and expects
this segment to drive overall revenues in FY 08.
The Consulting segment
includes traditional management consulting and information technology (IT)
consulting to state & local governments in planning, design,
procurement, and implementation of IT systems. Beginning in FY 2004, MAXIMUS
experienced lower-than-anticipated profitability in Consulting due to increased
competition and reduced reimbursement levels from the federal government.
MAXIMUS is in the process of turning this division around but the process will
likely not be achieved in the short term.
The Systems business assists
clients with enterprise resource planning (ERP) implementations, including
PeopleSoft software for a wide range of tasks and Smart Card implementations
for federal and state/local governments. MAXIMUS also provides specialized
software programs for state court systems and jury management, and creates and
manages IT systems for state criminal justice systems. The company considered
FY07 as a ‘transition year’ for Systems, as it continues to resolve
unprofitable legacy contracts.
2
Competition
MAXIMUS has several
rivalries in its outsourcing businesses. We estimate that MAXIMUS has 70% of
the market for health care services, with Benova (a subsidiary of FleetBoston
Financial) being the next major competitor. In child support, MAXIMUS competes
against Affiliated Computer Services and privately-held Policy Studies
Incorporated (PSI). GARP believes that MAXIMUS has half of the welfare services
market, with non-profit organizations like United Way and Goodwill offering
similar services. The markets for the company’s other services are considerably
more competitive. In consulting, competitors include Accenture, the Big 4
accounting firms and several boutiques. In Systems, MAXIMUS competes against a
large number of players including Unisys, SAP, Oracle, BearingPoint, Accenture,
Deloitte, Northrop Grumman (NOC - Neutral), and Electronic Data Systems.
Market
Governments are increasingly
outsourcing key functions to the private sector to enable performance-based
management. That said, only a tiny percentage of these expenditures are
currently outsourced and MAXIMUS still commands the leading market share in its
space. We believe the trend towards outsourcing will only grow over time as
fiscal pressures, changing regulations, and increased accountability compel
state & local governments to rationalize programs and improve quality
and efficiency. Importantly, outsourcing continues to be a low cost alternative
that has barely penetrated this market. Demographics within the state workforce
point to the likelihood of increased secular demand for MAXIMUS’ services over
the long term, given the pervasive graying of the state and local government
workforce, implying increased opportunities for contractors. Meanwhile, 60% of
the federal workforce alone will become eligible for retirement over the next
10 years. The potential market for state operated support programs exceeds $29
billion and is driven by legislation to reform federal, state, and local
welfare and health and human services programs.
Risks
We believe that most of
MAXIMUS’s businesses are ultimately tied to federally-mandated programs that
would likely continue despite fiscal issues at the state level. However,
pressures such as potential reductions in federal assistance and increased
costs from entitlement programs such as Medicaid could subdue discretionary spending by states, in our
opinion. We continue to believe in the merits of this outsourcing trend, and
MAXIMUS is well-positioned to benefit from new opportunities that will arise as
budgets continue to stabilize and programs are expanded. Beginning in late FY
2004, the company experienced increased competition across its businesses,
though MAXIMUS’s solid sales and backlog statistics, combined with its deep
experience & quality reputation in serving state & local
governments, will likely translate into reasonable growth opportunities.
MAXIMUS evolved in 2005-2006
as a bidder for larger outsourcing contracts, with a corresponding extension of
its sales cycles. However, the company’s negative experience in this area -—
particularly with its Texas health & human services subcontract with
Accenture — has refocused senior management on more appropriate assignments.
MAXIMUS currently is prime contractor with the Texas on a renegotiated
contract.
3
Maximus, Inc.
Fiscal
Year Sep 30
Operating &
Financial Highlights
($
Millions, Adjusted for Certain Items)
|
|
|
2003
|
|
2004
|
|
2005
|
|
2006
|
|
2007
|
|
2008F
|
|
2009F
|
|
2010F
|
|
|
Revenue
|
|
558.3
|
|
603.8
|
|
647.5
|
|
700.8
|
|
738.6
|
|
865.0
|
|
985.0
|
|
1,125.0
|
|
|
Operating
Income
|
|
57.0
|
|
63.0
|
|
63.3
|
|
(2.8
|
)
|
(2.7
|
)
|
83.9
|
|
114.0
|
|
133.0
|
|
|
Net
Income
|
|
35.3
|
|
38.8
|
|
36.9
|
|
2.5
|
|
(8.3
|
)
|
54.2
|
|
72.6
|
|
84.0
|
|
|
Avg
Shares Outstanding- Diluted
|
|
21.3
|
|
22.0
|
|
21.7
|
|
21.8
|
|
21.9
|
|
19.7
|
|
20.0
|
|
20.0
|
|
|
EPS - Diluted
|
|
$
|
1.66
|
|
$
|
1.76
|
|
$
|
1.70
|
|
$
|
0.11
|
|
$
|
(0.38
|
)
|
$
|
2.75
|
|
$
|
3.63
|
|
$
|
4.20
|
|
|
|
|
|
|
|
|
|
|
|
|
|
|
|
|
|
|
|
|
|
Diluted EPS Without FAS 123R
|
|
|
|
|
|
$
|
1.86
|
|
$
|
0.22
|
|
$
|
(0.26
|
)
|
$
|
2.87
|
|
$
|
3.75
|
|
$
|
4.32
|
|
|
|
|
|
|
|
|
|
|
|
|
|
|
|
|
|
|
|
|
|
Capital Employed
|
|
|
|
|
|
|
|
|
|
|
|
|
|
|
|
|
|
|
Property
Plant & Equipment
|
|
40.9
|
|
44.0
|
|
55.1
|
|
67.3
|
|
67.0
|
|
67.0
|
|
67.0
|
|
67.0
|
|
|
Operating
Working Capital
|
|
84.6
|
|
91.9
|
|
69.4
|
|
91.9
|
|
52.5
|
|
85.0
|
|
95.0
|
|
96.0
|
|
|
Other
/ Intangibles
|
|
94.8
|
|
105.2
|
|
106.0
|
|
89.3
|
|
90.0
|
|
90.0
|
|
90.0
|
|
90.0
|
|
|
total
|
|
220.3
|
|
241.0
|
|
230.5
|
|
248.5
|
|
209.5
|
|
242.0
|
|
252.0
|
|
253.0
|
|
|
|
|
|
|
|
|
|
|
|
|
|
|
|
|
|
|
|
|
|
Financing
|
|
|
|
|
|
|
|
|
|
|
|
|
|
|
|
|
|
|
Debt
|
|
4.6
|
|
6.7
|
|
5.1
|
|
2.0
|
|
2.0
|
|
2.0
|
|
2.0
|
|
2.0
|
|
|
Shareholders
Equity
|
|
333.2
|
|
373.5
|
|
406.0
|
|
404.9
|
|
404.6
|
|
316.8
|
|
377.4
|
|
429.4
|
|
|
(Less:
Cash)
|
|
(117.5
|
)
|
(139.3
|
)
|
(180.6
|
)
|
(158.4
|
)
|
(197.1
|
)
|
(76.8
|
)
|
(127.4
|
)
|
(178.4
|
)
|
|
total
|
|
220.3
|
|
241.0
|
|
230.5
|
|
248.5
|
|
209.5
|
|
242.0
|
|
252.0
|
|
253.0
|
|
|
|
|
|
|
|
|
|
|
|
|
|
|
|
|
|
|
|
|
|
Ratios (%)
|
|
|
|
|
|
|
|
|
|
|
|
|
|
|
|
|
|
|
Operating
Margin
|
|
10.2
|
%
|
10.4
|
%
|
9.8
|
%
|
n/a
|
|
n/a
|
|
9.7
|
%
|
11.6
|
%
|
11.8
|
%
|
|
Return
on Capital Employed
|
|
25.9
|
%
|
26.2
|
%
|
27.5
|
%
|
n/a
|
|
n/a
|
|
34.7
|
%
|
45.2
|
%
|
52.6
|
%
|
|
Return
on Tangible Capital
|
|
43.4
|
%
|
43.1
|
%
|
46.6
|
%
|
n/a
|
|
n/a
|
|
55.2
|
%
|
70.4
|
%
|
81.6
|
%
|
|
Shareholders
Equity / Capital
|
|
151.2
|
%
|
155.0
|
%
|
176.2
|
%
|
162.9
|
%
|
193.1
|
%
|
130.9
|
%
|
149.8
|
%
|
169.7
|
%
|
|
|
|
|
|
|
|
|
|
|
|
|
|
|
|
|
|
|
|
|
Valuation
|
|
|
|
|
|
|
|
|
|
|
|
|
|
|
|
|
|
|
Price
Earnings Multiple
|
|
|
|
|
|
|
|
|
|
n/a
|
|
13.1
|
|
9.9
|
|
8.6
|
|
|
|
|
|
|
|
|
|
|
|
|
|
|
|
|
|
|
|
|
|
Segment Estimates
|
|
|
|
|
|
|
|
|
|
|
|
|
|
|
|
|
|
|
Revenue
|
|
|
|
|
|
|
|
|
|
|
|
|
|
|
|
|
|
|
Consulting
|
|
102.6
|
|
103.3
|
|
107.3
|
|
93.7
|
|
93.7
|
|
88.0
|
|
100.0
|
|
110.0
|
|
|
Systems
|
|
133.4
|
|
139.1
|
|
137.1
|
|
141.3
|
|
141.3
|
|
137.0
|
|
145.0
|
|
165.0
|
|
|
Operations
|
|
322.2
|
|
361.4
|
|
403.1
|
|
503.6
|
|
503.6
|
|
640.0
|
|
740.0
|
|
850.0
|
|
|
Other
|
|
0.0
|
|
0.0
|
|
0.0
|
|
(37.8
|
)
|
0.0
|
|
0.0
|
|
0.0
|
|
0.0
|
|
|
total
|
|
558.3
|
|
603.8
|
|
647.5
|
|
700.8
|
|
738.6
|
|
865.0
|
|
985.0
|
|
1,125.0
|
|
|
|
|
|
|
|
|
|
|
|
|
|
|
|
|
|
|
|
|
|
Operating
Income
|
|
|
|
|
|
|
|
|
|
|
|
|
|
|
|
|
|
|
Consulting
|
|
15.6
|
|
11.0
|
|
10.7
|
|
14.5
|
|
6.4
|
|
5.0
|
|
6.0
|
|
8.0
|
|
|
Systems
|
|
15.3
|
|
15.4
|
|
11.4
|
|
(0.9
|
)
|
(4.7
|
)
|
(4.5
|
)
|
3.0
|
|
5.0
|
|
|
Operations
|
|
25.1
|
|
35.1
|
|
38.5
|
|
(9.5
|
)
|
39.1
|
|
84.0
|
|
104.0
|
|
119.0
|
|
|
Corporate
/ Other
|
|
1.1
|
|
1.6
|
|
2.7
|
|
(7.0
|
)
|
(43.5
|
)
|
(0.6
|
)
|
1.0
|
|
1.0
|
|
|
total
|
|
57.0
|
|
63.0
|
|
63.3
|
|
(2.8
|
)
|
(2.7
|
)
|
83.9
|
|
114.0
|
|
133.0
|
|
|
|
|
|
|
|
|
|
|
|
|
|
|
|
|
|
|
|
|
|
|
|
|
|
|
|
4
Copyright © 2008, GARP
Research & Securities Co. All rights reserved.
GARP Research &
Securities Co. (“GARP Research”) is a dually registered broker dealer and
investment adviser, a member organization of FINRA and SIPC, and accredited
member of the Investorside Research Association. GR&S is an independent
research firm that provides research to institutional investors. Weedflower, Inc.,
a registered investment adviser, serves as the investment manager to the
Gaineswood Fund, LP (the “Partnership”) and has discretionary investment
authority over the Partnership’s assets. GARP Capital, LLC is the general
partner for Partnership. GARP Research & Securities Co., Weedflower, Inc.,
GARP Capital, LLC, and the Gaineswood Fund, LP (collectively “GARP”) are under
common ownership and control.
|

|
|
The
Investorside Research Association certifies its
members have no investment
banking conflicts.
|
GARP Research, its advisory
clientele, their partners, principals, officers, employees and affiliates may
hold positions in or options on the securities discussed.
The information contained
herein has been obtained from sources believed reliable but is not necessarily
complete and accuracy is not guaranteed. Opinions expressed are subject to
change without notice and do not constitute solicitation of orders. Within the
body of this and previous reports GARP Research & Securities Co.
attempts to examine competitive threats, secular and cyclical demand shifts, or
financial considerations which can impose risk upon its clients.
The table below lists all
holdings by GARP Research analysts and/or their family members of GARP-rated
stocks. Outside of this ownership disclosed in the table below, the analysts
are not aware of any other material conflict of interest. Likewise, GARP
Research & Securities Co. does not hold a position in any stocks. GARP
Research & Securities Co. does not make a market in any securities.
Analyst Ownership in GARP Recommended Securities
|
Analyst
|
|
Ownership
|
|
Jeff Burnett
|
|
None
|
|
Brett Carson
|
|
Cosi, ICON
Plc., International Rectifier, PPD Inc., Synopsys
|
|
Seth Dadds
|
|
Ameritrade, Cree,
E*Trade, Illumina
|
|
Rob Furlong
|
|
Analog Devices, Cosi, Flextronics,
Sangamo, Taser International, ZipRealty
|
|
Alastair Mackay
|
|
None
|
|
George Sakellaris
|
|
Gevity HR, ZipRealty,
Cree, EW Scripps, International Rectifier, Sangamo, Cosi, Gemstar-TV
Guide
|
Additional information is
available upon request by contacting GARP Research & Securities Co.’s
Chief Compliance Officer at (410) 318-5018.
GARP Research is mostly a
fundamental equity research product. We utilize a BUY, NEUTRAL, and AVOID
(SELL) rating system based on an approach balancing growth against valuation
with a proprietary matrix. The percentage of BUY, NEUTRAL, and AVOID ratings
was recently 70-75%, 20-30%, and 0-5%, respectively. GARP Research does not
conduct corporate finance activities in the stocks it covers, and does not plan
to conduct such activities in the foreseeable future. The model keys off of
projections of per diluted share earnings over a three year time horizon, which
in some cases involves the use of certain pro forma adjustments to GAAP.
Another important consideration is whether the underlying company possesses
5
characteristics consistent
with GARP’s investment philosophy, in particular the firm’s methods of
assessing quality (through competitive assessment and current or projected return
on invested capital) and control of risk (technical analysis and quantitative
measures). Ratings may also take into account growth beyond terminus years and
capital gains taxation.
Reasonable valuation is
essential to BUY recommendations. Companies with annual growth rates as low as
9% if valuation is 10x out-year earnings or lower could qualify, but faster
growing firms are permitted higher valuations, such as a multiple of less than
16x out-year EPS for a 17% growth rate. There are other combinations of growth
rates and earnings multiples that represent a frontier that delineates
attractive versus unattractive equities, but our model is not purely linear.
For example, near the “middle” of these outliers would be firms that trade at
10x to 12x out-year earnings whose earnings growth rate approaches 12% or
better. A NEUTRAL rating occurs when valuation lies below this EPS-growth
frontier, or our assessment of quality or risk elicits caution. A rating of
AVOID is defined by a boundary whose maximum constraint is having a PE multiple
of over 16x out-year EPS, and growth of less than 12%. Also, substantive
non-quantitative risks may be a requisite before an AVOID rating is assigned.
In our valuation analysis, we may take into account cash per share, new accounting
standards, pro forma earnings or cash flow adjustments, or other items that
create deviation from standard calculations. Ratings are also often maintained
once equity shifts into a higher or lower quintile in order to avoid excessive
reclassifications due to volatility near break points. Ratings of appreciated
securities might also be maintained because we are aware that our “out-year”
could shift, thereby reestablishing an attractive quintile score simply through
the passage of time. Moreover, long-term technical analysis may be used to aid
in decisions regarding the classification of a stock, particularly when
volatility near a break point has been experienced. Additional information is
available upon request.
Past performance is not
indicative of future results.
Analyst
Certification
All of the views expressed
in the report accurately reflect the personal views of the research analyst
about any and all of the subject companies. No part of the compensation of the
research analyst named herein was, is, or will be, directly or indirectly,
related to the specific recommendations or views expressed by the research
analyst in this report. Neither the research analyst nor a member of the
analyst’s household serves as an officer, director or advisory board member of
any company mentioned in the report.
-Jeff Burnett
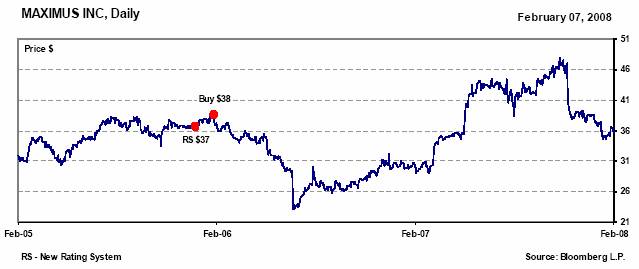
6
|
GARP Research & Securities Co.
|
|
Main:
(410) 764-1300
|
|
2800 Quarry Lake Drive,
Suite 140
|
|
Fax:
(410) 318-5048
|
|
Baltimore, Maryland 21209
|
|
www.garpresearch.com
|
INVESTMENT RESEARCH & INSTITUTIONAL SALES
|
Jeff
Burnett
|
|
burnett@garpresearch.com
|
|
410-318-5014
|
|
Brett
Carson, CFA
|
|
carson@garpresearch.com
|
|
410-318-5031
|
|
Seth
Dadds
|
|
dadds@garpresearch.com
|
|
410-318-5021
|
|
Robert
Furlong, CFA
|
|
furlong@garpresearch.com
|
|
410-318-5015
|
|
Alistair
Mackay, Ph.D.
|
|
mackay@garpresearch.com
|
|
410-318-5022
|
|
Seth
Moshman, CPA
|
|
moshman@garpresearch.com
|
|
410-318-5017
|
|
George
Sakellaris, CFA
|
|
sakellaris@garpresearch.com
|
|
410-318-5016
|
PUBLICATIONS
More information about our
firm, our coverage our research and our performance history can be found on our
website, or by typing GRCO <Go>
on Bloomberg.
Entitled clients can access
our research on Thomson, Reuters, Bloomberg,
Capital IQ, Factset and Zacks Investment Research. Please contact us should you need
proper entitlement for access.
INSTITUTIONAL
EQUITY TRADING INSTRUCTIONS
GARP Research, Inc., a
FINRA-registered broker dealer and a member of the SIPC. We offer several ways
to facilitate the payment of our investment research services.
Commission Sharing Agreements:
GARP Research has Commission
Sharing Agreements (CSA’s) with Lehman
Brothers, Citigroup, Goldman
Sachs, and Instinet.
Institutional clients can place orders through their normal trading contacts at
these firms and direct commission dollars to our firm in payment for our
research services.
Our primary contact(s) at
Lehman Brothers are:
|
Chris
Caras
|
|
Kevin Petrello
|
|
Vice
President
|
|
SVP-Head of US Commission
Management
|
|
212-526-9490
|
|
212-526-9459
|
|
chcaras@lehman.com
|
|
kpetrell@lehman.com
|
Bear Stearns & Co.:
GARP Research also clears
through Bear Stearns Securities Corp. on a fully-disclosed basis. Orders can be
placed through any existing coverage at Bear Stearns institutional trading
desks. When placing orders, please specify that the order is for the “credit of
GARP Research — Office 504”. Please use DTC number 352. Our Broker/Dealer
number is 58712.
If
you have any questions, please call Seth Moshman or Jeff Burnett.
7
Appendix 4
|

|
|
Maximus, Inc.
MMS — NYSE
Hold
|
|
Commercial
IT Services
|
|
|
|
|
November 14, 2008
|
|
|
|
From
|
|
To
|
|
|
Changes
|
|
(Previous)
|
|
(Current)
|
|
|
Rating
|
|
—
|
|
Hold
|
|
|
FY09E
EPS
|
|
$
|
3.07
|
|
$3.11
|
|
|
(Net)
|
|
|
|
|
|
|
FY10E
EPS
|
|
—
|
|
$3.35
|
|
|
(Net)
|
|
|
|
|
Stock Data
|
|
|
|
|
Price
(11/13/08):
|
|
$31.02
|
|
|
52-Week
Range:
|
|
$48
– $26
|
|
|
Market
Cap.($mm):
|
|
$580.1
|
|
|
Shr.O/S-Diluted
(mm):
|
|
18.7
|
|
|
Enterprise
Val. ($mm):
|
|
$460.8
|
|
|
Avg
Daily Vol (3 Mo):
|
|
226,463
|
|
|
LT
Debt/Total Cap.:
|
|
0.0
|
%
|
|
Net
Cash/Share:
|
|
$6.45
|
|
|
Dividend
($):
|
|
$0.40
|
|
|
Yield
(%):
|
|
1.3
|
%
|
|
Book
Value/Share:
|
|
$15.95
|
|
|
S&P
Index:
|
|
911.29
|
|
|
|
|
|
|
|
|
|
EPS (Net)
|
|
2008 A
|
|
2009 E
|
|
2010 E
|
|
|
1Q
|
|
$
|
0.59A
|
|
$
|
0.67
|
|
$
|
0.74
|
|
|
2Q
|
|
0.75A
|
|
0.77
|
|
0.83
|
|
|
3Q
|
|
0.81A
|
|
0.80
|
|
0.85
|
|
|
4Q
|
|
0.71A
|
|
0.88
|
|
0.93
|
|
|
FY Sep
|
|
$
|
2.86A
|
|
$
|
3.11
|
|
$
|
3.35
|
|
|
P/E
|
|
10.8x
|
|
10.0x
|
|
9.3x
|
|
F3Q07 per
share results do not include legal settlement charges. 2007 EPS is proforma.
FY08
quarterly EPS estimates are pro forma from continuing operations, and exclude one-time,
nonrecurring items; include $0.03 of
pre-ASR
interest income.
|
Revenue (Net)
|
|
$
|
807.9
|
M
|
$
|
765.8
|
M
|
$
|
818.0
|
M
|
|
EV/Revenue
|
|
0.6
|
x
|
0.6
|
x
|
0.6
|
x
|
FY08
revenue estimates are from continuing operations.
Sloppy
F4Q08 Results; Guidance Impacted By Currency;
|
Maintain
Hold
|
|
|
|
|
|
George A.
Price
|
|
(443) 224-1323
|
|
gaprice@stifel.com
|
|
Shlomo
Rosenbaum
|
|
(443) 224-1322
|
|
shrosenbaum@stifel.com
|
|
Richard
Eskelsen
|
|
(443) 224-1366
|
|
eskelsenr@stifel.com
|
|
|
|
|
|
Analysis
of Sales/Earnings
|
· MMS reported generally
disappointing F4Q08 results relative to our and consensus estimates. While MMS’
outlook remains generally consistent with prior view (excluding currency
impacts), the state & local fiscal situation is deteriorating, and
timing/magnitude of federal assistance is uncertain. While we believe MMS
shares admittedly appear attractively valued, we maintain our Hold rating.
· F4Q08
results. Revenue of $189.1M (up 8.8% YOY on cont. ops. basis)
was below our $194.4M estimate and the $193.2M consensus estimate. Earnings results were sloppy due to several
one-time puts and takes, but at the end of the day, pro forma EPS came in below
our expectations. Margins were also light. The Operations segment performed
well (up 14% YOY, nicely profitable), while the Consulting segment continued to
be a drag on results (down 17% YOY, with a loss, largely due to contract
execution).
· Guidance
maintained, though currency impacting. FY09 revenue guidance was
taken down ~3% due to currency (AUD and CAD depreciating against US$), but
otherwise was intact. FY09 EPS of $3.00 -$3.15 was maintained, though MMS had
to make a sizable share repurchase to offset the lower expected revenue.
Additional share repurchases are planned but incremental to guidance.
· State and
local fiscal conditions deteriorating. State revenues are declining
and the number of states facing budget deficits is increasing, driven by the
weak U.S. economy. While health and social programs often see an uptick in
enrollment during downturns, states are under considerable pressure, and some
have indicated that cuts even in these programs are being considered. The Obama
administration has expressed interest in giving assistance to states, but
timing and magnitude are uncertain.
· MMS shares cheap, but... We acknowledge that MMS
shares appear cheap, trading at 10.5x our new CY08 EPS estimate of $2.94 and
9.7x our new CY09 EPS estimate of $3.18 (up 8.2%), and especially noting MMS
has $121.0M in cash, which comprises almost 21% of the stock’s current market
cap. Still, we remain cautious around the deterioration in S&L fiscal
conditions and uncertainty as to whether and when states will get federal
assistance.
All
relevant disclosures and certifications appear on pages 10 - 11 of this
report.
1
F4Q08
Results: Still A Bit Sloppy
MMS reported disappointing
F4Q08 results, showing that while progress has been made in de-risking the
business, there is still some work to be done. Revenue was slightly below us,
consensus, and prior guidance, and pro forma EPS from continuing operations was
also below our estimate and in the middle of guidance. Included in the quarter
was a $0.02 per share benefit from insurance reimbursement for legal and
settlement costs (primarily relating to the ongoing ACN arbitration), ~$1M in
severance ($0.03 per share) due to corporate headcount reductions resulting
from the prior Systems segment divestiture, and a $0.25 goodwill impairment
charge related to the ERP division of the Systems segment that MMS did not
divest. Margins were below our expectations, driven by weakness in the
Consulting segment (see below). FCF was modestly below our estimate.
RESULTS
VERSUS OUR EXPECTATIONS AT TIME OF EARNINGS ANNOUNCEMENT
KEY METRICS
|
F4Q08
|
|
SN Est.
|
|
Actual
|
|
Year Ago
|
|
Comment
|
|
|
Revenue ($M)
|
|
$
|
194.4
|
|
$
|
189.1
|
|
$
|
201.9
|
|
Below us
and consensus, and slightly below prior guidance of $190M - $195M, following
Systems divestiture.
|
|
|
YOY Growth (as reported)
|
|
-3.7
|
%
|
-6.3
|
%
|
17.5
|
%
|
|
|
|
YOY Growth (cont. ops.)
|
|
11.9
|
%
|
8.8
|
%
|
NA
|
|
|
|
|
Consensus
Revenue ($M)
|
|
$
|
193.2
|
|
|
|
|
|
|
|
|
|
|
|
|
|
|
|
|
|
|
|
Gross
Margin (reported)
|
|
28.8
|
%
|
26.9
|
%
|
27.5
|
%
|
Below our estimate.
|
|
|
EBIT
Margin (GAAP)
|
|
11.4
|
%
|
6.9
|
%
|
10.8
|
%
|
Below our estimate, do to
several unexpected and one-time expenses.
|
|
|
EBIT
Margin (pro forma, excl. one time and legal)
|
|
11.8
|
%
|
11.0
|
%
|
12.1
|
%
|
Excludes
reimbursed legal and settlement expenses, goodwill impairment, and severance; our estimate excl. ~$900K in legal
expenses that we previously modeled,
whereas MMS reported a gain from
insurance/legal reimbursement.
|
|
|
Tax
Rate
|
|
39.0
|
%
|
37.1
|
%
|
42.0
|
%
|
Lower than our estimate;
added $0.02 to EPS, by our calculation.
|
|
|
EPS
(GAAP)
|
|
$
|
(0.09
|
)
|
$
|
(0.09
|
)
|
$
|
0.63
|
|
In line.
|
|
|
YOY Growth
|
|
NM
|
|
NM
|
|
NM
|
|
|
|
|
EPS
(cont. ops., pro forma)
|
|
$
|
0.73
|
|
$
|
0.71
|
|
NA
|
|
Below our estimate.
|
|
|
YOY Growth
|
|
NA
|
|
NA
|
|
NA
|
|
|
|
|
EPS
(cont. ops., pro forma, excl. legal)
|
|
$
|
0.76
|
|
$
|
0.71
|
|
NA
|
|
In the
middle of prior guidance of $0.68 - $0.76; our estimate in this case excludes
~$900K in legal expenses that we previously
modeled.
|
|
|
YOY Growth
|
|
NA
|
|
NA
|
|
NA
|
|
|
|
|
Consensus
EPS
|
|
$
|
(0.10
|
)
|
|
|
|
|
|
|
|
Share
count (M)
|
|
18.9
|
|
18.7
|
|
22.6
|
|
Slightly below us; no
impact to EPS by itself, but with lower tax rate would round up extra $0.01.
|
|
|
A/R
DSO (days)
|
|
76
|
|
76
|
|
78
|
|
In line.
|
|
|
Free Cash Flow ($M), cont. ops.
|
|
$
|
7.4
|
|
$
|
5.2
|
|
$
|
(15.7
|
)
|
Modestly
below our estimate. Including discontinued ops, FCF was $16.9M.
|
|
Source:
Company Filings, FirstCall Estimates, and Stifel Nicolaus Estimates.
Segments:
Operations Strong, Consulting Leaves Room For Improvement
While the Operations segment
continued to perform well, posting YOY revenue growth of 14.4% and an operating
margin of 13.6% (towards top-end of company’s stated range of 10%-15%), the
Consulting segment continues to be a drag. Revenues declined 16.8% YOY and the
operating margin was a negative 8.3% . MMS noted that the majority of the
Consulting loss was as a result of a $2.7M year-end adjustment on a fixed-price
ERP contract that is taking longer
2
than MMS originally thought.
This is a legacy Systems segment contract (not divested) that moved into the
Consulting segment as a result of the ERP division moving into Consulting at
the time of the Systems divestiture. This is a negative in our view, as it is
yet another unexpected contract issue that pops up (MMS has a mixed track
record over time in this regard), and management noted that there are still
several legacy ERP contracts in MMS’ Consulting portfolio. While we applaud MMS
management for the many steps it has taken to (and progress shown in)
de-risking the business (e.g., recent Systems divestiture), it appears that
some operational risk still remains with legacy contracts.
Outlook:
Beyond Currency, Guidance Reiterated
OUR
ESTIMATES VERSUS UPDATED GUIDANCE FOLLOWING DIVESTITURE ANNOUNCEMENT
GUIDANCE
|
F1Q09
|
|
SN Ests.
|
|
Guidance
|
|
Comment
|
|
|
Revenue ($M, cont. ops.)
|
|
$
|
183.8
|
|
No guidance
|
|
MMS did
not give F1Q09 guidance.
|
|
|
Consensus
Revenue ($M)
|
|
$
|
184.6
|
|
|
|
|
|
|
EPS (cont. ops., pro forma)
|
|
$
|
0.67
|
|
No guidance
|
|
MMS did
not give F1Q09 guidance.
|
|
|
Consensus
EPS
|
|
$
|
0.68
|
|
|
|
|
|
|
FY09
|
|
|
|
|
|
|
|
|
Revenue ($M, cont. ops.)
|
|
$
|
788.6
|
|
$750M - $775M
|
|
Reduced
prior guidance of $775M - $800M due to currency (appreciation of US$ against AUD and
CAD).
|
|
|
Consensus
Revenue ($M)
|
|
$
|
786.1
|
|
|
|
|
|
|
EPS
|
|
$
|
3.07
|
|
$3.00 - $3.15
|
|
Reaffirmed
prior guidance of $3.00 - $3.15.
|
|
|
Consensus
EPS
|
|
$
|
3.03
|
|
|
|
|
|
|
FCF ($M)
|
|
$
|
51.1
|
|
$40M - $50M
|
|
Includes
cash from ops of $60M - $70M, but excludes $11M payment due to divestiture, so
reported FCF will be lower than the
$40M-$50M range, all else being
equal.
|
|
Source:
Company Filings, FirstCall Estimates, and Stifel Nicolaus Estimates.
Positives
· New Democratic regime in
Washington should favor programs (ex. , SCHIP) that benefit MMS.
· Additionally, in a
recession, volumes of people enrolled in public social and health programs
(such as Medicaid and welfare-to-work) tends to increase, which could benefit
MMS as a provider of enrollment, eligibility, and welfare-to-work services,
among others.
· Signings, backlog, and
pipeline appear to remain healthy for MMS.
· MMS has $62.1M remaining on
its share repurchase program, and has been active in September and October,
buying a total of one million shares for ~$34.1M since September. Incremental
repurchases could offer potential upside to guidance (current guidance does not
factor in any additional share repurchases, beyond material repurchases made
after the end of F4Q08), but we believe that currency and any continuing
execution issues could offset potential repurchase upside.
Concerns
· The state and local fiscal
situation continues to deteriorate. Recent data released by the Nelson A.
Rockefeller Institute of Government (www. rockinst. org) indicate that C3Q08
state tax revenues were virtually unchanged year-over-year on a nominal basis,
and declined 2.6% nationally on a real basis. The Institute expects tax
revenues to continue to trend down, as the two largest taxes (income and sales
tax) have generally been trending down since C2Q07. The report also noted that
corporate tax collections, while a small part of total tax revenue, declined by
15.3% YOY.
· S&L fiscal pressures (as
described above), combined with credit markets that remain tight and increasing
federal
3
government debt and
financial system guarantees, could create budget delays or even cuts in
programs that were previously thought to be “sacred cows” (such as SCHIP).
· Legacy Systems contracts
that are now included in the Consulting segment could remain a near-term issue
and drag to margins throughout the year.
· FCF was a bit below our
previous estimate and could be viewed by some investors as a negative,
especially considering that guidance does not include an additional $11M
outflow in FY09 due to the divestiture (this will show up in reported FCF).
· Currency is becoming an
increasing issue for MMS, as ~16% of its revenue comes from overseas (primarily
Australia and Canada). We estimate that currency could create a ~3.5% headwind
for MMS in FY09, based on current spot prices.
Additionally, MMS mentioned
that the U.K. is looking to revamp their current welfare-to-work system and MMS
has submitted a bid. We view such a contract very cautiously, given the
problems, delays, and setbacks (some of which remain ongoing) from the last
sizable U.K. health and social program, the NHS Connecting for Health program.
Estimates
Basic Assumptions:
· Revenue growth impacted by
currency (~3.5% headwind, based on current spot prices) and S&L fiscal
pressures.
· MMS utilizes half of their
current $62.1M repurchase authorization pro rata over the next four quarters,
with an average share price assumption of $30.
· Operations segment continues
to perform well, although growth is impacted by currency. Consulting remains a
revenue drag throughout FY09.
· Tax rate remains constant at
~37%.
4
ESTIMATES
|
F1Q09
|
|
Current
|
|
Prior
|
|
Variance
|
|
YOY Change
|
|
Comment
|
|
|
Revenue ($M, as reported)
|
|
$
|
180.7
|
|
$
|
183.8
|
|
$
|
(3.1
|
)
|
-10.5
|
%
|
Revenue increases 2.0% on
a continuing operations basis.
|
|
|
|
|
|
|
|
|
|
|
|
|
|
|
|
Gross
Margin
|
|
27.4
|
%
|
28.5
|
%
|
-
110 bps
|
|
+
130 bps
|
|
|
|
|
Operating Margin (excl. charges)
|
|
10.4
|
%
|
11.1
|
%
|
- 70 bps
|
|
+ 110
bps
|
|
Expect lingering issues
with legacy ERP contracts to continue.
|
|
|
|
|
|
|
|
|
|
|
|
|
|
|
|
Diluted EPS (pro forma, cont. ops.)
|
|
$
|
0.67
|
|
$
|
0.67
|
|
$
|
0.00
|
|
13.6
|
%
|
Unchanged from our
previous estimate.
|
|
|
FCF ($M)
|
|
$
|
11.3
|
|
$
|
10.8
|
|
$
|
0.5
|
|
$
|
27.0
|
|
Flow through from lower
revenue and margins.
|
|
|
|
|
|
|
|
|
|
|
|
|
|
|
|
|
|
|
FY09
|
|
Current
|
|
Prior
|
|
Variance
|
|
YOY Change
|
|
Comment
|
|
|
Revenue ($M, as reported)
|
|
$
|
765.8
|
|
$
|
788.6
|
|
$
|
(22.8
|
)
|
-5.2
|
%
|
Revenue increases 2.8% YOY
on continuing operations basis. Near the middle of revised guidance of $750M
- $775M.
|
|
|
|
|
|
|
|
|
|
|
|
|
|
|
|
Gross
Margin
|
|
28.0
|
%
|
29.2
|
%
|
-
120 bps
|
|
+
170 bps
|
|
|
|
|
Operating Margin (excl. charges)
|
|
11.1
|
%
|
11.8
|
%
|
- 70 bps
|
|
+ 200 bps
|
|
Margins show nice
expansion YOY, as Operations segment makes up majority of business; expect Consulting
to be a margin drag.
|
|
|
|
|
|
|
|
|
|
|
|
|
|
|
|
Diluted EPS (pro forma, cont. ops.)
|
|
$
|
3.11
|
|
$
|
3.07
|
|
$
|
0.04
|
|
8.7
|
%
|
Slightly above the
midpoint of guidance of $3.05 - $3.15. Share repurchases boost EPS.
|
|
|
FCF ($M)
|
|
$
|
39.2
|
|
$
|
51.1
|
|
$
|
(11.9
|
)
|
$
|
5.9
|
|
Guidance of $40M - $50M
excludes $11M payment in FY09 due to divestiture; including that, assume FCF near
high end of range.
|
|
|
|
|
|
|
|
|
|
|
|
|
|
|
|
|
|
|
FY10
|
|
Current
|
|
Prior
|
|
Variance
|
|
YOY Change
|
|
Comment
|
|
|
Revenue ($M, as reported)
|
|
$
|
818.0
|
|
No prior FY10 estimates
|
|
6.8
|
%
|
Expect MMS to post mid to
upper single digit growth going forward.
|
|
|
Gross
Margin
|
|
27.7
|
%
|
|
|
|
|
-
30 bps
|
|
|
|
|
Operating Margin (excl. charges)
|
|
10.8
|
%
|
|
|
|
|
- 30 bps
|
|
Assume margins see some
pressure due to S&L fiscal conditions and price pressure.
|
|
|
|
|
|
|
|
|
|
|
|
|
|
|
|
Diluted EPS (pro forma)
|
|
$
|
3.35
|
|
|
|
|
|
7.6
|
%
|
|
|
|
FCF ($M)
|
|
$
|
50.8
|
|
|
|
|
|
$
|
11.6
|
|
FCF is ~87% of net income.
|
|
|
|
|
|
|
|
|
|
|
|
|
|
|
|
|
Calendar Year
|
|
Current
|
|
Prior
|
|
Variance
|
|
YOY Change
|
|
Comment
|
|
|
CY08
Revenue ($M, as reported)
|
|
$
|
786.7
|
|
$
|
795.2
|
|
$
|
(8.5
|
)
|
0.9
|
%
|
|
|
|
CY08 Pro forma EPS
|
|
$
|
3.18
|
|
$
|
2.96
|
|
$
|
0.22
|
|
NM
|
|
|
|
|
CY09
Revenue ($M, as reported)
|
|
$
|
778.0
|
|
$
|
796.3
|
|
$
|
(18.4
|
)
|
-1.1
|
%
|
|
|
|
CY09 Pro forma EPS
|
|
$
|
3.49
|
|
$
|
3.09
|
|
$
|
0.40
|
|
9.6
|
%
|
|
|
Source:
Company data and Stifel Nicolaus.
Valuation
MMS shares are currently
trading at 10.5x our new CY08 EPS estimate of $2.94 and 9.7x our new CY09 EPS
estimate of $3.18 (up 8.2%) . These are historically very low multiples, as the
last time MMS shares were trading near these valuations was late 2002/early
2003, during the last downturn when the S&L fiscal situation was also bad
(actually further along in the downcycle). Additionally, with $121.0M in cash
currently on the balance sheet, cash comprises almost 21% of stock’s current
market cap.
MMS shares ended up 17.6%
yesterday, versus the S&P 500 up 6.9% . We suspect some short covering, as
some investors may have been expecting an impact to MMS’ business from the
difficult S&L budget environment, as well as buyers in an up market of a
relatively inexpensive stock that has been weak recently.
However, the S&L
backdrop remains concerning, in our view. While MMS indicates it has not seen
any broad fundamental impacts from the poor S&L fiscal environment, we are
still early in the downcycle, and S&L fiscal conditions appear to be
deteriorating on a weekly basis (we note that MMS was impacted during the last
downturn later in the macro cycle, in early 2003). The Center on Budget and
Policy Priorities (www.cbpp.org), which tracks state and locality finances,
notes that 41 states have already either reported or projected budget problems
for the current fiscal year (which began July 1 for most states) or next
fiscal year, and are responding in some cases by cutting spending in areas such
as health care for children, families, seniors, and the disabled. The
Rockefeller Institute of Government (www.rockinst.org) indicates that state
revenues dropped in the last quarter. While the incoming Obama administration
has expressed some interest in fiscal relief for the states, the timing and
magnitude of any aid is uncertain, given large expenditures by the federal
government in areas such as the financial industry and housing. We remain
concerned about the S&L fiscal environment and potential lingering issues in
MMS’ legacy ERP contracts, and would wait for
5
either a more attractive
entry point or incremental details about potential federal aid for the states
before revisiting our rating. Maintain Hold.
Company Description
Founded in 1975, Maximus is
a leader in providing program management support (including both IT services
and business process outsourcing) and consulting services primarily to health
and human services agencies in state and local governments. Maximus utilizes
technology combined with its strong program management skills and understanding
of government agencies’ business processes to result in an operation that is
more efficient than governments could achieve on their own at similar costs.
Maximus is based in McLean, Virginia.
6
Maximus, Inc.
Income Statement
($ in thousands, except
per share)
Fiscal year ends September 30
|
|
|
|
|
|
|
|
|
|
|
|
|
|
|
|
|
|
|
|
|
|
|
|
|
|
|
|
|
|
|
|
|
|
|
|
|
|
|
|
|
|
|
|
|
|
|
|
|
|
|
|
Income Statement
|
|
2007
|
|
1Q08
|
|
2Q08
|
|
3Q08
|
|
4Q08
|
|
2008
|
|
1Q09E
|
|
2Q09E
|
|
3Q09E
|
|
4Q09E
|
|
2009E
|
|
1Q10E
|
|
2Q10E
|
|
3Q10E
|
|
4Q10E
|
|
2010E
|
|
|
Revenue
(as reported)
|
|
$
|
738,646
|
|
$
|
201,950
|
|
$
|
210,584
|
|
$
|
206,324
|
|
$
|
189,069
|
|
$
|
807,927
|
|
$
|
180,713
|
|
$
|
196,515
|
|
$
|
193,787
|
|
$
|
194,792
|
|
$
|
765,807
|
|
$
|
192,869
|
|
$
|
210,037
|
|
$
|
206,799
|
|
$
|
208,332
|
|
$
|
818,037
|
|
|
Year-over-year % Change (as reported)
|
|
5.4
|
%
|
25.3
|
%
|
17.6
|
%
|
5.0
|
%
|
-6.3
|
%
|
9.4
|
%
|
-10.5
|
%
|
-6.7
|
%
|
-6.1
|
%
|
3.0
|
%
|
-5.2
|
%
|
6.7
|
%
|
6.9
|
%
|
6.7
|
%
|
7.0
|
%
|
6.8
|
%
|
|
Year-over-year % Change (continuing ops.)
|
|
|
|
34.4
|
%
|
25.7
|
%
|
11.4
|
%
|
8.8
|
%
|
19.0
|
%
|
2.0
|
%
|
3.6
|
%
|
2.3
|
%
|
3.0
|
%
|
2.8
|
%
|
|
|
|
|
|
|
|
|
|
|
|
Sequential % Change
|
|
5.4
|
%
|
0.0
|
%
|
4.3
|
%
|
-2.0
|
%
|
-8.4
|
%
|
9.4
|
%
|
-4.4
|
%
|
8.7
|
%
|
-1.4
|
%
|
0.5
|
%
|
-5.2
|
%
|
-1.0
|
%
|
8.9
|
%
|
-1.5
|
%
|
0.7
|
%
|
6.8
|
%
|
|
Salaries, wages and other
|
|
561,563
|
|
149,183
|
|
156,694
|
|
151,086
|
|
138,260
|
|
595,223
|
|
131,198
|
|
142,277
|
|
138,364
|
|
139,471
|
|
551,310
|
|
140,601
|
|
152,697
|
|
148,275
|
|
149,790
|
|
591,364
|
|
|
Gross Profit
|
|
177,083
|
|
52,767
|
|
53,890
|
|
55,238
|
|
50,809
|
|
212,704
|
|
49,515
|
|
54,238
|
|
55,423
|
|
55,321
|
|
214,498
|
|
52,267
|
|
57,340
|
|
58,524
|
|
58,541
|
|
226,673
|
|
|
Gross
Margin
|
|
24.0
|
%
|
26.1
|
%
|
25.6
|
%
|
26.8
|
%
|
26.9
|
%
|
26.3
|
%
|
27.4
|
%
|
27.6
|
%
|
28.6
|
%
|
28.4
|
%
|
28.0
|
%
|
27.1
|
%
|
27.3
|
%
|
28.3
|
%
|
28.1
|
%
|
27.7
|
%
|
|
Selling Gen & Admin
|
|
131,752
|
|
33,033
|
|
35,019
|
|
35,213
|
|
29,126
|
|
132,391
|
|
30,011
|
|
32,286
|
|
33,073
|
|
30,982
|
|
126,352
|
|
32,030
|
|
34,508
|
|
35,294
|
|
33,135
|
|
134,967
|
|
|
Stock Option Expense
|
|
3,829
|
|
1,020
|
|
2,154
|
|
1,595
|
|
1,774
|
|
6,543
|
|
800
|
|
800
|
|
800
|
|
800
|
|
3,200
|
|
800
|
|
800
|
|
800
|
|
800
|
|
3,200
|
|
|
Consolidating Adjustment & Other
|
|
—
|
|
—
|
|
—
|
|
—
|
|
—
|
|
—
|
|
—
|
|
—
|
|
—
|
|
—
|
|
—
|
|
—
|
|
—
|
|
—
|
|
—
|
|
—
|
|
|
Charges/Nonrecurring Items
|
|
44,638
|
|
2,200
|
|
931
|
|
3,737
|
|
6,827
|
|
13,695
|
|
—
|
|
—
|
|
—
|
|
—
|
|
—
|
|
—
|
|
—
|
|
—
|
|
—
|
|
—
|
|
|
Total Operating Expense
|
|
180,219
|
|
36,253
|
|
38,104
|
|
40,545
|
|
37,727
|
|
152,629
|
|
30,811
|
|
33,086
|
|
33,873
|
|
31,782
|
|
129,552
|
|
32,830
|
|
35,308
|
|
36,094
|
|
33,935
|
|
138,167
|
|
|
% of Revenue
|
|
24.4
|
%
|
18.0
|
%
|
18.1
|
%
|
19.7
|
%
|
20.0
|
%
|
18.9
|
%
|
17.0
|
%
|
16.8
|
%
|
17.5
|
%
|
16.3
|
%
|
16.9
|
%
|
17.0
|
%
|
16.8
|
%
|
17.5
|
%
|
16.3
|
%
|
16.9
|
%
|
|
Operating Income (GAAP)
|
|
(3,136
|
)
|
16,514
|
|
15,786
|
|
14,693
|
|
13,082
|
|
60,075
|
|
18,704
|
|
21,152
|
|
21,550
|
|
23,539
|
|
84,945
|
|
19,438
|
|
22,032
|
|
22,430
|
|
24,606
|
|
88,506
|
|
|
% Change
|
|
11.0
|
%
|
-195.0
|
%
|
580.4
|
%
|
-248.0
|
%
|
-40.1
|
%
|
-2015.7
|
%
|
13.3
|
%
|
34.0
|
%
|
46.7
|
%
|
79.9
|
%
|
41.4
|
%
|
-67.6
|
%
|
17.8
|
%
|
6.0
|
%
|
14.2
|
%
|
4.2
|
%
|
|
Oper. Margin (GAAP)
|
|
-0.4
|
%
|
8.2
|
%
|
7.5
|
%
|
7.1
|
%
|
6.9
|
%
|
7.4
|
%
|
10.4
|
%
|
10.8
|
%
|
11.1
|
%
|
12.1
|
%
|
11.1
|
%
|
10.1
|
%
|
10.5
|
%
|
10.8
|
%
|
11.8
|
%
|
10.8
|
%
|
|
Oper. Margin (Continuing Ops.)
|
|
|
|
10.9
|
%
|
11.7
|
%
|
14.3
|
%
|
6.9
|
%
|
10.9
|
%
|
|
|
|
|
|
|
|
|
|
|
|
|
|
|
|
|
|
|
|
|
|
Operating
Margin (excl. charges)
|
|
5.6
|
%
|
9.3
|
%
|
7.9
|
%
|
8.9
|
%
|
10.5
|
%
|
9.1
|
%
|
10.4
|
%
|
10.8
|
%
|
11.1
|
%
|
12.1
|
%
|
11.1
|
%
|
10.1
|
%
|
10.5
|
%
|
10.8
|
%
|
11.8
|
%
|
10.8
|
%
|
|
Investment Income
|
|
5,804
|
|
1,501
|
|
107
|
|
490
|
|
325
|
|
2,423
|
|
613
|
|
608
|
|
598
|
|
617
|
|
2,435
|
|
1,005
|
|
1,077
|
|
1,135
|
|
1,227
|
|
4,443
|
|
|
Minority Interest
|
|
451
|
|
—
|
|
—
|
|
—
|
|
—
|
|
—
|
|
—
|
|
—
|
|
—
|
|
—
|
|
—
|
|
—
|
|
—
|
|
—
|
|
—
|
|
—
|
|
|
Income Before Income Taxes
|
|
3,119
|
|
18,015
|
|
15,893
|
|
15,183
|
|
13,407
|
|
62,498
|
|
19,317
|
|
21,759
|
|
22,148
|
|
24,156
|
|
87,381
|
|
20,443
|
|
23,109
|
|
23,565
|
|
25,833
|
|
92,949
|
|
|
Pretax Margin
|
|
0.4
|
%
|
8.9
|
%
|
7.5
|
%
|
7.4
|
%
|
7.1
|
%
|
7.7
|
%
|
10.7
|
%
|
11.1
|
%
|
11.4
|
%
|
12.4
|
%
|
11.4
|
%
|
10.6
|
%
|
11.0
|
%
|
11.4
|
%
|
12.4
|
%
|
11.4
|
%
|
|
% Change
|
|
-22.7
|
%
|
-211.1
|
%
|
303.9
|
%
|
-268.1
|
%
|
-45.1
|
%
|
1903.8
|
%
|
7.2
|
%
|
36.9
|
%
|
45.9
|
%
|
80.2
|
%
|
39.8
|
%
|
-67.3
|
%
|
19.6
|
%
|
8.3
|
%
|
16.6
|
%
|
6.4
|
%
|
|
Provision for Income Taxes
|
|
11,374
|
|
7,410
|
|
6,266
|
|
5,379
|
|
4,979
|
|
24,034
|
|
7,174
|
|
8,081
|
|
8,225
|
|
8,971
|
|
32,451
|
|
7,592
|
|
8,582
|
|
8,751
|
|
9,594
|
|
34,519
|
|
|
Tax Rate
|
|
364.7
|
%
|
41.1
|
%
|
39.4
|
%
|
35.4
|
%
|
37.1
|
%
|
38.5
|
%
|
37.1
|
%
|
37.1
|
%
|
37.1
|
%
|
37.1
|
%
|
37.1
|
%
|
37.1
|
%
|
37.1
|
%
|
37.1
|
%
|
37.1
|
%
|
37.1
|
%
|
|
Income from Continuing Ops.
|
|
(8,255
|
)
|
12,268
|
|
13,489
|
|
17,296
|
|
8,428
|
|
51,481
|
|
12,143
|
|
13,678
|
|
13,923
|
|
15,185
|
|
54,930
|
|
12,851
|
|
14,527
|
|
14,813
|
|
16,239
|
|
58,430
|
|
|
Margin
|
|
-1.1
|
%
|
6.1
|
%
|
6.4
|
%
|
8.4
|
%
|
4.5
|
%
|
6.4
|
%
|
6.7
|
%
|
7.0
|
%
|
7.2
|
%
|
7.8
|
%
|
7.2
|
%
|
6.7
|
%
|
6.9
|
%
|
7.2
|
%
|
7.8
|
%
|
7.1
|
%
|
|
Income from Discontinued
Ops.
|
|
—
|
|
(1,663
|
)
|
(3,862
|
)
|
(5,891
|
)
|
(10,188
|
)
|
(21,604
|
)
|
—
|
|
—
|
|
—
|
|
—
|
|
—
|
|
|
|
|
|
|
|
|
|
|
|
|
Net Income
|
|
(8,255
|
)
|
10,605
|
|
9,627
|
|
11,405
|
|
(1,760)
|
|
29,877
|
|
12,143
|
|
13,678
|
|
13,923
|
|
15,185
|
|
54,930
|
|
|
|
|
|
|
|
|
|
|
|
|
Net Margin
|
|
-1.1
|
%
|
5.3
|
%
|
4.6
|
%
|
5.5
|
%
|
-0.9
|
%
|
3.7
|
%
|
6.7
|
%
|
7.0
|
%
|
7.2
|
%
|
7.8
|
%
|
7.2
|
%
|
|
|
|
|
|
|
|
|
|
|
|
Earnings Per Share (GAAP)
|
|
$
|
(0.40
|
)
|
$
|
0.51
|
|
$
|
0.51
|
|
$
|
0.61
|
|
$
|
(0.09
|
)
|
$
|
1.55
|
|
$
|
0.67
|
|
$
|
0.77
|
|
$
|
0.80
|
|
$
|
0.88
|
|
$
|
3.12
|
|
$
|
0.74
|
|
$
|
0.83
|
|
$
|
0.85
|
|
$
|
0.93
|
|
$
|
3.35
|
|
|
% Change
|
|
NM
|
|
NM
|
|
NM
|
|
NM
|
|
NM
|
|
NM
|
|
31.4
|
%
|
51.0
|
%
|
31.1
|
%
|
NM
|
|
101.3
|
%
|
-52.2
|
%
|
23.7
|
%
|
10.0
|
%
|
16.5
|
%
|
7.4
|
%
|
|
Earnings Per Share
(Continuing Ops.)
|
|
|
|
$
|
0.59
|
|
$
|
0.72
|
|
$
|
0.92
|
|
$
|
0.45
|
|
$
|
2.67
|
|
$
|
0.67
|
|
$
|
0.77
|
|
$
|
0.80
|
|
$
|
0.88
|
|
$
|
3.11
|
|
$
|
0.74
|
|
$
|
0.83
|
|
$
|
0.85
|
|
$
|
0.93
|
|
$
|
3.35
|
|
|
% Change
|
|
|
|
|
|
|
|
|
|
|
|
|
|
13.6
|
%
|
6.9
|
%
|
-13.0
|
%
|
95.6
|
%
|
16.5
|
%
|
10.4
|
%
|
7.8
|
%
|
6.3
|
%
|
5.7
|
%
|
7.7
|
%
|
|
Earnings Per Share (Continuing Ops.,
pro forma)
|
|
|
|
$
|
0.59
|
|
$
|
0.75
|
|
$
|
0.81
|
|
$
|
0.71
|
|
$
|
2.86
|
|
$
|
0.67
|
|
$
|
0.77
|
|
$
|
0.80
|
|
$
|
0.88
|
|
$
|
3.11
|
|
$
|
0.74
|
|
$
|
0.83
|
|
$
|
0.85
|
|
$
|
0.93
|
|
$
|
3.35
|
|
|
% Change
|
|
|
|
|
|
|
|
|
|
|
|
|
|
13.6
|
%
|
2.7
|
%
|
-1.2
|
%
|
23.9
|
%
|
8.7
|
%
|
10.4
|
%
|
7.8
|
%
|
6.3
|
%
|
5.7
|
%
|
7.7
|
%
|
|
Shares Outstanding (000s)
|
|
22,029
|
|
20,854
|
|
18,763
|
|
18,819
|
|
18,742
|
|
19,295
|
|
18,008
|
|
17,749
|
|
17,490
|
|
17,318
|
|
17,641
|
|
17,368
|
|
17,418
|
|
17,468
|
|
17,518
|
|
17,443
|
|
|
|
|
|
|
|
|
|
|
|
|
|
|
|
|
|
|
|
|
|
|
|
|
|
|
|
|
|
|
|
|
|
|
|
|
|
|
|
|
|
|
|
|
|
|
|
|
|
|
|
|
|
|
|
|
|
|
|
|
|
|
|
|
|
|
|
|
|
|
|
|
|
|
|
|
|
|
|
|
|
|
|
Calendar Year
|
|
|
|
|
|
|
|
|
|
|
|
|
|
|
|
|
|
|
|
CY08
|
|
CY09
|
|
CY010
|
|
|
EPS
(Continuing Ops., pro forma)
|
|
|
|
|
|
|
|
|
|
|
|
|
|
|
|
|
|
|
|
$
|
2.94
|
|
$
|
3.18
|
|
$
|
3.49
|
|
|
% Change YOY
|
|
|
|
|
|
|
|
|
|
|
|
|
|
|
|
|
|
|
|
|
|
8.2
|
%
|
9.6
|
%
|
|
|
|
|
|
|
|
|
|
|
|
|
|
|
|
|
|
|
|
|
|
|
|
|
|
|
|
|
|
|
|
|
|
|
|
|
|
|
|
|
|
|
|
|
|
|
|
|
|
|
|
|
|
|
|
|
|
|
|
|
|
|
|
|
|
|
|
|
|
|
|
|
|
|
|
|
|
|
|
|
|
|
Ratios
|
|
2007
|
|
1Q08
|
|
2Q08
|
|
3Q08
|
|
4Q08
|
|
2008
|
|
1Q09E
|
|
2Q09E
|
|
3Q09E
|
|
4Q09E
|
|
2009E
|
|
1Q10E
|
|
2Q10E
|
|
3Q10E
|
|
4Q10E
|
|
2010E
|
|
|
A/R in Days Sales
|
|
85
|
|
75
|
|
75
|
|
77
|
|
76
|
|
71
|
|
76
|
|
77
|
|
77
|
|
77
|
|
78
|
|
75
|
|
76
|
|
76
|
|
76
|
|
77
|
|
|
A/P and Accrued Days Op.
Exp.
|
|
28
|
|
26
|
|
25
|
|
25
|
|
26
|
|
24
|
|
25
|
|
25
|
|
25
|
|
25
|
|
25
|
|
24
|
|
24
|
|
24
|
|
24
|
|
24
|
|
|
Current Ratio
|
|
3.03
|
|
2.1
|
|
2.3
|
|
2.4
|
|
2.4
|
|
2.45
|
|
2.6
|
|
2.5
|
|
2.5
|
|
2.6
|
|
2.61
|
|
2.7
|
|
2.7
|
|
2.9
|
|
3.0
|
|
2.99
|
|
|
Return on Assets, avg
|
|
-1.5
|
%
|
8.7
|
%
|
9.1
|
%
|
9.1
|
%
|
7.8
|
%
|
41.7
|
%
|
11.2
|
%
|
12.4
|
%
|
12.5
|
%
|
13.4
|
%
|
49.3
|
%
|
11.1
|
%
|
12.2
|
%
|
12.0
|
%
|
12.8
|
%
|
48.2
|
%
|
|
Return on Equity, avg.
|
|
-2.0
|
%
|
12.4
|
%
|
13.8
|
%
|
13.5
|
%
|
11.3
|
%
|
14.7
|
%
|
16.0
|
%
|
17.7
|
%
|
17.7
|
%
|
18.9
|
%
|
17.6
|
%
|
15.5
|
%
|
16.9
|
%
|
16.5
|
%
|
17.4
|
%
|
16.5
|
%
|
|
NOPAT/Capital*
|
|
1.9
|
%
|
10.8
|
%
|
13.0
|
%
|
12.4
|
%
|
10.5
|
%
|
13.5
|
%
|
14.7
|
%
|
16.3
|
%
|
16.4
|
%
|
17.5
|
%
|
16.2
|
%
|
14.0
|
%
|
15.3
|
%
|
15.0
|
%
|
15.9
|
%
|
15.0
|
%
|
|
Book Value, end
|
|
$
|
18.36
|
|
$
|
13.07
|
|
$
|
15.18
|
|
$
|
15.78
|
|
$
|
15.95
|
|
$
|
15.49
|
|
$
|
17.04
|
|
$
|
17.56
|
|
$
|
18.12
|
|
$
|
18.83
|
|
$
|
18.48
|
|
$
|
19.46
|
|
$
|
20.18
|
|
$
|
20.92
|
|
$
|
21.73
|
|
$
|
21.82
|
|
|
|
|
|
|
|
|
|
|
|
|
|
|
|
|
|
|
|
|
|
|
|
|
|
|
|
|
|
|
|
|
|
|
|
|
|
|
|
|
|
|
|
|
|
|
|
|
|
|
|
|
|
Some
calculations may vary due to rounding.
|
|
|
|
|
Source: Maximus, Inc. data and Stifel Nicolaus estimates
|
|
|
|
|
|
11/13/2008
|
|
|
|
|
|
|
|
|
George A. Price, Jr.
|
Shlomo H. Rosenbaum
|
Richard M. Eskelsen
|
|
|
(443) 224-1323
|
(443) 224-1322
|
(443) 224-1366
|
|
|
gaprice@stifel.com
|
shrosenbaum@stifel.com
|
eskelsenr@stifel.com
|
|
7
Maximus, Inc.
Balance Sheet and Cash Flow
($
in thousands)
FY ends September 30
|
|
|
|
|
|
|
|
|
|
|
|
|
|
|
|
|
|
|
|
|
|
|
|
|
|
|
|
|
|
|
|
|
|
|
|
|
|
|
|
|
|
|
|
|
|
|
|
Balance Sheet
|
|
FY07
|
|
1Q08
|
|
2Q08
|
|
3Q08
|
|
4Q08
|
|
FY08
|
|
1Q09E
|
|
2Q09E
|
|
3Q09E 4
|
|
4Q09E
|
|
FY09 E
|
|
1Q10E
|
|
2Q10E
|
|
3Q10E
|
|
4Q10E
|
|
FY10 E
|
|
|
Cash and short-term
investments
|
|
|
|
$
|
62,654
|
|
$
|
63,747
|
|
$
|
78,271
|
|
$
|
120,957
|
|
|
|
$
|
124,235
|
|
$
|
118,767
|
|
$
|
120,524
|
|
$
|
126,162
|
|
|
|
$
|
141,809
|
|
$
|
145,427
|
|
$
|
157,133
|
|
$
|
169,958
|
|
|
|
|
Accounts receivable, net
|
|
|
|
119,267
|
|
122,692
|
|
126,793
|
|
128,819
|
|
|
|
112,444
|
|
124,459
|
|
120,579
|
|
119,040
|
|
|
|
117,864
|
|
130,690
|
|
126,377
|
|
124,999
|
|
|
|
|
Unbilled receivables
|
|
|
|
49,771
|
|
52,314
|
|
49,721
|
|
30,695
|
|
|
|
40,158
|
|
43,670
|
|
45,217
|
|
47,616
|
|
|
|
42,860
|
|
46,675
|
|
48,253
|
|
50,926
|
|
|
|
|
Prepaid and other
current assets
|
|
|
|
7,688
|
|
15,719
|
|
11,649
|
|
10,215
|
|
|
|
10,215
|
|
10,215
|
|
10,215
|
|
10,215
|
|
|
|
10,215
|
|
10,215
|
|
10,215
|
|
10,215
|
|
|
|
|
Deferred taxes
|
|
|
|
11,267
|
|
9,490
|
|
10,255
|
|
10,812
|
|
|
|
10,812
|
|
10,812
|
|
10,812
|
|
10,812
|
|
|
|
10,812
|
|
10,812
|
|
10,812
|
|
10,812
|
|
|
|
|
Total
current assets
|
|
|
|
250,647
|
|
263,962
|
|
276,689
|
|
301,498
|
|
|
|
297,864
|
|
307,923
|
|
307,347
|
|
313,844
|
|
|
|
323,560
|
|
343,819
|
|
352,791
|
|
366,910
|
|
|
|
|
Property, plant and
equipment, net
|
|
|
|
35,580
|
|
34,333
|
|
33,799
|
|
33,994
|
|
|
|
38,879
|
|
41,192
|
|
43,436
|
|
45,706
|
|
|
|
46,481
|
|
47,557
|
|
48,576
|
|
49,622
|
|
|
|
|
Net Software Development
Costs
|
|
|
|
29,306
|
|
29,183
|
|
29,714
|
|
14,125
|
|
|
|
14,125
|
|
14,125
|
|
14,125
|
|
14,125
|
|
|
|
14,125
|
|
14,125
|
|
14,125
|
|
14,125
|
|
|
|
|
Deferred contract costs
|
|
|
|
7,712
|
|
6,273
|
|
5,435
|
|
5,324
|
|
|
|
5,324
|
|
5,324
|
|
5,324
|
|
5,324
|
|
|
|
5,324
|
|
5,324
|
|
5,324
|
|
5,324
|
|
|
|
|
Deferred taxes
|
|
|
|
—
|
|
—
|
|
—
|
|
7,722
|
|
|
|
7,722
|
|
7,722
|
|
7,722
|
|
7,722
|
|
|
|
7,722
|
|
7,722
|
|
7,722
|
|
7,722
|
|
|
|
|
Other assets
|
|
|
|
92,833
|
|
92,518
|
|
91,326
|
|
69,483
|
|
|
|
69,483
|
|
69,483
|
|
69,483
|
|
69,483
|
|
|
|
69,483
|
|
69,483
|
|
69,483
|
|
69,483
|
|
|
|
|
Total
assets
|
|
|
|
416,078
|
|
426,269
|
|
436,963
|
|
432,146
|
|
|
|
433,397
|
|
445,769
|
|
447,437
|
|
456,204
|
|
|
|
466,695
|
|
488,030
|
|
498,021
|
|
513,186
|
|
|
|
|
Current
liabilities:
|
|
|
|
|
|
|
|
|
|
|
|
|
|
|
|
|
|
|
|
|
|
|
|
|
|
|
|
|
|
|
|
|
|
|
Accounts payable
|
|
|
|
52,441
|
|
53,391
|
|
51,802
|
|
48,950
|
|
|
|
44,780
|
|
48,490
|
|
47,621
|
|
47,348
|
|
|
|
46,035
|
|
49,921
|
|
48,952
|
|
48,780
|
|
|
|
|
Accrued compensation and
benefits
|
|
|
|
25,771
|
|
28,390
|
|
29,417
|
|
26,684
|
|
|
|
25,077
|
|
27,154
|
|
24,763
|
|
24,621
|
|
|
|
26,854
|
|
29,121
|
|
26,516
|
|
26,423
|
|
|
|
|
Billings in excess of
costs and estimated earnings
|
|
|
|
37,461
|
|
33,151
|
|
33,836
|
|
19,676
|
|
|
|
18,806
|
|
20,451
|
|
20,167
|
|
20,272
|
|
|
|
17,928
|
|
19,524
|
|
19,223
|
|
19,366
|
|
|
|
|
Notes payable &
other (cap. lease obligations)
|
|
|
|
1,643
|
|
1,238
|
|
830
|
|
417
|
|
|
|
417
|
|
417
|
|
417
|
|
417
|
|
|
|
417
|
|
417
|
|
417
|
|
417
|
|
|
|
|
Income taxes payable
|
|
|
|
—
|
|
—
|
|
—
|
|
12,662
|
|
|
|
12,662
|
|
12,662
|
|
12,662
|
|
12,662
|
|
|
|
12,662
|
|
12,662
|
|
12,662
|
|
12,662
|
|
|
|
|
Deferred taxes
|
|
|
|
2,675
|
|
998
|
|
1,237
|
|
14,919
|
|
|
|
14,919
|
|
14,919
|
|
14,919
|
|
14,919
|
|
|
|
14,919
|
|
14,919
|
|
14,919
|
|
14,919
|
|
|
|
|
S corporation
distribution payable
|
|
|
|
—
|
|
—
|
|
—
|
|
—
|
|
|
|
—
|
|
—
|
|
—
|
|
—
|
|
|
|
—
|
|
—
|
|
—
|
|
—
|
|
|
|
|
Total
current liabilities
|
|
|
|
119,991
|
|
117,168
|
|
117,122
|
|
123,308
|
|
|
|
116,662
|
|
124,093
|
|
120,550
|
|
120,239
|
|
|
|
118,815
|
|
126,565
|
|
122,689
|
|
122,567
|
|
|
|
|
Long-term debt
|
|
|
|
—
|
|
—
|
|
—
|
|
—
|
|
|
|
—
|
|
—
|
|
—
|
|
—
|
|
|
|
—
|
|
—
|
|
—
|
|
—
|
|
|
|
|
Deferred taxes
|
|
|
|
11,202
|
|
12,752
|
|
11,810
|
|
1,617
|
|
|
|
1,617
|
|
1,617
|
|
1,617
|
|
1,617
|
|
|
|
1,617
|
|
1,617
|
|
1,617
|
|
1,617
|
|
|
|
|
Other liabilities
|
|
|
|
12,319
|
|
11,470
|
|
10,996
|
|
8,315
|
|
|
|
8,315
|
|
8,315
|
|
8,315
|
|
8,315
|
|
|
|
8,315
|
|
8,315
|
|
8,315
|
|
8,315
|
|
|
|
|
Total
liabilities
|
|
|
|
143,512
|
|
141,390
|
|
139,928
|
|
133,240
|
|
|
|
126,594
|
|
134,025
|
|
130,482
|
|
130,171
|
|
|
|
128,747
|
|
136,497
|
|
132,621
|
|
132,499
|
|
|
|
|
Redeemable common stock
|
|
|
|
—
|
|
—
|
|
—
|
|
—
|
|
|
|
—
|
|
—
|
|
—
|
|
—
|
|
|
|
—
|
|
—
|
|
—
|
|
—
|
|
|
|
|
Common stock
|
|
|
|
—
|
|
—
|
|
—
|
|
—
|
|
|
|
—
|
|
—
|
|
—
|
|
—
|
|
|
|
—
|
|
—
|
|
—
|
|
—
|
|
|
|
|
Additional paid-in
capital
|
|
|
|
31,976
|
|
36,514
|
|
39,130
|
|
44,756
|
|
|
|
41,511
|
|
33,748
|
|
25,986
|
|
20,811
|
|
|
|
20,811
|
|
20,811
|
|
20,811
|
|
20,811
|
|
|
|
|
Retained earnings
|
|
|
|
240,590
|
|
248,365
|
|
257,905
|
|
254,150
|
|
|
|
265,293
|
|
277,996
|
|
290,970
|
|
305,223
|
|
|
|
317,137
|
|
330,723
|
|
344,589
|
|
359,877
|
|
|
|
|
Total
stockholders’ equity
|
|
|
|
272,566
|
|
284,879
|
|
297,035
|
|
298,906
|
|
|
|
306,803
|
|
311,744
|
|
316,955
|
|
326,034
|
|
|
|
337,948
|
|
351,533
|
|
365,400
|
|
380,687
|
|
|
|
|
Total
liab & stockholders’ equity
|
|
|
|
416,078
|
|
426,269
|
|
436,963
|
|
432,146
|
|
|
|
433,397
|
|
445,769
|
|
447,437
|
|
456,204
|
|
|
|
466,695
|
|
488,030
|
|
498,021
|
|
513,186
|
|
|
|
|
|
|
|
|
|
|
|
|
|
|
20.8
|
%
|
|
|
|
|
|
|
|
|
|
|
|
|
|
|
|
|
|
|
|
|
|
|
|
|
|
|
|
|
|
|
|
|
|
|
|
|
|
|
|
|
|
|
|
|
|
|
|
|
|
|
|
|
|
|
|
|
|
|
|
|
|
|
|
|
|
|
|
|
|
|
|
|
|
|
|
|
|
|
|
|
|
|
|
|
|
|
|
|
|
|
|
|
|
|
|
|
|
|
|
|
|
|
|
|
|
|
|
|
|
|
|
|
|
|
|
|
|
Cash Flow Statement
|
|
FY07
|
|
1Q08
|
|
2Q08
|
|
3Q08
|
|
4Q08
|
|
FY08
|
|
1Q09E
|
|
2Q09E
|
|
3Q09E
|
|
4Q09E
|
|
FY09E
|
|
1Q10E
|
|
2Q10E
|
|
3Q10E
|
|
4Q10E
|
|
FY10E
|
|
|
Cash flows from
operating activities
|
|
|
|
|
|
|
|
|
|
|
|
|
|
|
|
|
|
|
|
|
|
|
|
|
|
|
|
|
|
|
|
|
|
|
Net income
|
|
$
|
(8,255
|
)
|
$
|
10,605
|
|
$
|
9,627
|
|
$
|
11,405
|
|
$
|
(1,760
|
)
|
$
|
29,877
|
|
$
|
12,143
|
|
$
|
13,678
|
|
$
|
13,923
|
|
$
|
15,185
|
|
$
|
54,930
|
|
$
|
12,851
|
|
$
|
14,527
|
|
$
|
14,813
|
|
$
|
16,239
|
|
$
|
58,430
|
|
|
Deferred taxes
|
|
|
|
4,195
|
|
3,327
|
|
(1,707
|
)
|
(20,089
|
)
|
|
|
—
|
|
—
|
|
—
|
|
—
|
|
|
|
—
|
|
—
|
|
—
|
|
—
|
|
|
|
|
Depreciation and
amortization
|
|
|
|
5,039
|
|
4,799
|
|
4,271
|
|
(1,581
|
)
|
|
|
2,600
|
|
2,600
|
|
2,600
|
|
2,600
|
|
|
|
2,600
|
|
2,600
|
|
2,600
|
|
2,600
|
|
|
|
|
Other
|
|
|
|
3,600
|
|
2,154
|
|
(4,588
|
)
|
33,370
|
|
|
|
800
|
|
800
|
|
800
|
|
800
|
|
|
|
800
|
|
800
|
|
800
|
|
800
|
|
|
|
|
Funds
from operations
|
|
|
|
23,439
|
|
19,907
|
|
9,381
|
|
9,940
|
|
|
|
15,543
|
|
17,078
|
|
17,323
|
|
18,585
|
|
|
|
16,251
|
|
17,927
|
|
18,213
|
|
19,639
|
|
|
|
|
(Increase) decrease in
A/R
|
|
|
|
13,695
|
|
(3,425
|
)
|
(4,101
|
)
|
(2,026
|
)
|
|
|
16,375
|
|
(12,016
|
)
|
3,881
|
|
1,539
|
|
|
|
1,175
|
|
(12,826
|
)
|
4,313
|
|
1,378
|
|
|
|
|
(Increase) decrease in
excess costs and earnings
|
|
|
|
(7,571
|
)
|
(2,543
|
)
|
2,593
|
|
19,026
|
|
|
|
(9,463
|
)
|
(3,512
|
)
|
(1,547
|
)
|
(2,399
|
)
|
|
|
4,756
|
|
(3,815
|
)
|
(1,578
|
)
|
(2,672
|
)
|
|
|
|
(Increase) decrease in
prepaid other c/a
|
|
|
|
1,471
|
|
(8,031
|
)
|
4,070
|
|
1,434
|
|
|
|
—
|
|
—
|
|
—
|
|
—
|
|
|
|
—
|
|
—
|
|
—
|
|
—
|
|
|
|
|
(Increase) decrease in
other assets
|
|
|
|
—
|
|
—
|
|
—
|
|
—
|
|
|
|
—
|
|
—
|
|
—
|
|
—
|
|
|
|
—
|
|
—
|
|
—
|
|
—
|
|
|
|
|
Increase (decrease) in
compensation
|
|
|
|
(3,678
|
)
|
2,619
|
|
1,027
|
|
(2,733
|
)
|
|
|
(1,607
|
)
|
2,077
|
|
(2,391
|
)
|
(142
|
)
|
|
|
2,233
|
|
2,267
|
|
(2,605
|
)
|
(93
|
)
|
|
|
|
Increase (decrease) in
A/P
|
|
|
|
(1,984
|
)
|
950
|
|
(1,589
|
)
|
(2,852
|
)
|
|
|
(4,170
|
)
|
3,710
|
|
(868
|
)
|
(273
|
)
|
|
|
(1,313
|
)
|
3,886
|
|
(970
|
)
|
(172
|
)
|
|
|
|
Increase (decrease) in
income tax payable
|
|
|
|
—
|
|
—
|
|
—
|
|
12,662
|
|
|
|
—
|
|
—
|
|
—
|
|
—
|
|
|
|
—
|
|
—
|
|
—
|
|
—
|
|
|
|
|
Increase (decrease) in
excess billings
|
|
|
|
(680
|
)
|
(2,871
|
)
|
1,523
|
|
(14,049
|
)
|
|
|
(870
|
)
|
1,644
|
|
(284
|
)
|
105
|
|
|
|
(2,343
|
)
|
1,596
|
|
(301
|
)
|
142
|
|
|
|
|
Increase (decrease) in
other liabilities
|
|
|
|
2,176
|
|
(849
|
)
|
(474
|
)
|
(2,681
|
)
|
|
|
—
|
|
—
|
|
—
|
|
—
|
|
|
|
—
|
|
—
|
|
—
|
|
—
|
|
|
|
|
Other changes to working
capital (plug)
|
|
|
|
(6,079
|
)
|
(1,253
|
)
|
369
|
|
(240
|
)
|
|
|
—
|
|
—
|
|
—
|
|
—
|
|
|
|
—
|
|
—
|
|
—
|
|
—
|
|
|
|
|
Working
capital changes
|
|
|
|
(2,650
|
)
|
(15,403
|
)
|
3,418
|
|
8,541
|
|
|
|
265
|
|
(8,096
|
)
|
(1,209
|
)
|
(1,171
|
)
|
|
|
4,508
|
|
(8,891
|
)
|
(1,141
|
)
|
(1,416
|
)
|
|
|
|
Net
cash provided by operating activities
|
|
51,190
|
|
20,789
|
|
4,504
|
|
12,799
|
|
18,481
|
|
56,573
|
|
15,809
|
|
8,983
|
|
16,113
|
|
17,414
|
|
58,319
|
|
20,759
|
|
9,036
|
|
17,072
|
|
18,223
|
|
65,089
|
|
|
Capital expenditures,
net
|
|
(17,893
|
)
|
(4,083
|
)
|
(3,055
|
)
|
(6,730
|
)
|
(1,581
|
)
|
(15,449
|
)
|
(4,518
|
)
|
(4,913
|
)
|
(4,845
|
)
|
(4,870
|
)
|
(19,145
|
)
|
(3,375
|
)
|
(3,676
|
)
|
(3,619
|
)
|
(3,646
|
)
|
(14,316
|
)
|
|
% of revenue
|
|
2.4
|
%
|
2.0
|
%
|
1.5
|
%
|
3.3
|
%
|
0.8
|
%
|
1.9
|
%
|
2.5
|
%
|
2.5
|
%
|
2.5
|
%
|
2.5
|
%
|
2.5
|
%
|
1.8
|
%
|
1.8
|
%
|
1.8
|
%
|
1.8
|
%
|
7.4
|
%
|
|
Acquisitions
|
|
|
|
—
|
|
—
|
|
10,572
|
|
29,885
|
|
|
|
—
|
|
—
|
|
—
|
|
—
|
|
|
|
—
|
|
—
|
|
—
|
|
—
|
|
|
|
|
Other investing
activities (plug)
|
|
|
|
—
|
|
—
|
|
59
|
|
(2,815
|
)
|
|
|
(2,967
|
)
|
—
|
|
—
|
|
—
|
|
|
|
—
|
|
—
|
|
—
|
|
—
|
|
|
|
|
Net
cash used by investing activities
|
|
|
|
(4,083
|
)
|
(3,053
|
)
|
3,901
|
|
25,489
|
|
|
|
(7,485
|
)
|
(4,913
|
)
|
(4,845
|
)
|
(4,870
|
)
|
|
|
(3,375
|
)
|
(3,676
|
)
|
(3,619
|
)
|
(3,646
|
)
|
|
|
|
Free
Cash Flow (excluding acquisitions)
|
|
33,297
|
|
16,706
|
|
1,449
|
|
6,069
|
|
16,900
|
|
41,124
|
|
11,291
|
|
4,070
|
|
11,269
|
|
12,544
|
|
39,174
|
|
17,384
|
|
5,360
|
|
13,453
|
|
14,577
|
|
50,774
|
|
|
% of net income
|
|
-403.4
|
%
|
|
|
|
|
|
|
|
|
79.9
|
%
|
|
|
|
|
|
|
|
|
71.3
|
%
|
|
|
|
|
|
|
|
|
86.9
|
%
|
|
Increase (decrease) in
debt
|
|
|
|
(401
|
)
|
(404
|
)
|
(408
|
)
|
(414
|
)
|
|
|
—
|
|
—
|
|
—
|
|
—
|
|
|
|
—
|
|
—
|
|
—
|
|
—
|
|
|
|
|
Increase (decrease) in
equity
|
|
|
|
(148,733
|
)
|
2,195
|
|
97
|
|
990
|
|
|
|
(3,246
|
)
|
(7,763
|
)
|
(7,763
|
)
|
(5,175
|
)
|
|
|
—
|
|
—
|
|
—
|
|
—
|
|
|
|
|
Other financing
activities (incl. dividend)
|
|
|
|
(1,925
|
)
|
(2,149
|
)
|
(1,865
|
)
|
(1,860
|
)
|
|
|
(1,801
|
)
|
(1,775
|
)
|
(1,749
|
)
|
(1,732
|
)
|
|
|
(1,737
|
)
|
(1,742
|
)
|
(1,747
|
)
|
(1,752
|
)
|
|
|
|
Net
cash provided from financing activities
|
|
|
|
(151,059
|
)
|
(358
|
)
|
(2,176
|
)
|
(1,284
|
)
|
|
|
(5,046
|
)
|
(9,537
|
)
|
(9,512
|
)
|
(6,907
|
)
|
|
|
(1,737
|
)
|
(1,742
|
)
|
(1,747
|
)
|
(1,752
|
)
|
|
|
|
Net increase (decrease)
in cash and cash equivalents
|
|
38,635
|
|
(134,353
|
)
|
1,093
|
|
14,524
|
|
42,686
|
|
(76,050
|
)
|
3,278
|
|
(5,468
|
)
|
1,757
|
|
5,638
|
|
5,205
|
|
15,647
|
|
3,618
|
|
11,706
|
|
12,825
|
|
43,797
|
|
|
|
|
|
|
|
|
|
|
|
|
|
|
|
|
|
|
|
|
|
|
|
|
|
|
|
|
|
|
|
|
|
|
|
|
|
|
|
|
|
|
|
|
|
|
|
|
Source: Maximus, Inc. and Stifel Nicolaus estimates
8
|
Commercial IT Services Companies
|
|
Stifel, Nicolaus &
Company, Inc.
|
Valuation Data:
($ in millions, except per share data)
|
|
|
|
|
|
|
|
|
|
|
|
|
|
|
|
|
|
|
|
|
|
|
|
|
|
|
|
|
|
|
|
|
|
|
|
|
|
|
|
|
|
|
|
|
|
|
|
|
|
|
|
|
Equity
|
|
Price/Earnings Ratio
|
|
PE/Growth (PEG)
|
|
Enterprise
|
|
Enterprise Value/
|
|
Cash Flow
|
|
|
|
|
|
|
Price
|
|
Annual
|
|
Annual
|
|
Market
|
|
CY
|
|
CY
|
|
CY
|
|
CY
|
|
Market
|
|
Trailing Twelve Months
|
|
Enterprise Value/
|
|
CY08 FCF
|
|
|
Ticker
|
|
Company
|
|
11/13/2008
|
|
High
|
|
Low
|
|
Value
|
|
2008
|
|
2009
|
|
2008
|
|
2009
|
|
Value
|
|
Revenue
|
|
EBIT
|
|
EBITDA
|
|
TTM FCF
|
|
CY08 FCF
|
|
CY09 FCF
|
|
Yield
|
|
|
ACN
|
|
Accenture, Ltd. (1) (3) (11)
|
|
$
|
29.37
|
|
$
|
43.04
|
|
$
|
24.76
|
|
$
|
23,788
|
|
10.7x
|
|
10.3x
|
|
0.3
|
|
2.8
|
|
$
|
20,173
|
|
0.80x
|
|
6.6x
|
|
5.7x
|
|
8.1x
|
|
7.9x
|
|
8.1x
|
|
10.7
|
%
|
|
ACS
|
|
Affiliated Comp. Services, Inc.
(1) (7) (11)
|
|
41.40
|
|
57.40
|
|
36.84
|
|
4,061
|
|
11.3
|
|
10.2
|
|
1.3
|
|
0.9
|
|
5,997
|
|
0.96
|
|
8.6
|
|
5.5
|
|
10.4
|
|
12.6
|
|
13.7
|
|
11.7
|
|
|
BE
|
|
BearingPoint, Inc. (9) *
|
|
0.06
|
|
4.60
|
|
0.06
|
|
13
|
|
Neg
|
|
Neg
|
|
Neg
|
|
Neg
|
|
641
|
|
0.19
|
|
Neg
|
|
NM
|
|
Neg
|
|
Neg
|
|
NE
|
|
NE
|
|
|
CBR
|
|
CIBER, Inc. (1) (11)
|
|
4.62
|
|
8.97
|
|
3.57
|
|
279
|
|
8.5
|
|
8.4
|
|
0.6
|
|
3.8
|
|
421
|
|
0.35
|
|
7.2
|
|
5.4
|
|
8.7
|
|
7.4
|
|
12.4
|
|
20.4
|
|
|
CSC
|
|
CSC (1) (5) (11)
|
|
30.58
|
|
55.25
|
|
25.95
|
|
4,682
|
|
7.7
|
|
7.1
|
|
Neg
|
|
0.9
|
|
7,714
|
|
0.45
|
|
6.4
|
|
3.1
|
|
7.8
|
|
11.3
|
|
12.0
|
|
14.5
|
|
|
DTPI
|
|
Diamond Mgmt. & Tech. Consultants
(1) (6) (11)
|
|
4.07
|
|
8.21
|
|
1.84
|
|
108
|
|
NM
|
|
NM
|
|
NM
|
|
NM
|
|
60
|
|
0.32
|
|
9.9
|
|
7.7
|
|
Neg
|
|
Neg
|
|
Neg
|
|
Neg
|
|
|
HCKT
|
|
The Hackett Group, Inc.
|
|
2.84
|
|
6.65
|
|
2.69
|
|
119
|
|
8.6
|
|
7.7
|
|
0.1
|
|
0.1
|
|
98
|
|
0.53
|
|
6.3
|
|
5.3
|
|
5.4
|
|
NE
|
|
NE
|
|
NE
|
|
|
HEW
|
|
Hewitt Associates Inc. (1) (4)
|
|
24.42
|
|
43.00
|
|
23.07
|
|
2,489
|
|
12.1
|
|
11.1
|
|
0.6
|
|
1.2
|
|
2,633
|
|
0.83
|
|
8.4
|
|
5.3
|
|
11.3
|
|
12.8
|
|
8.4
|
|
8.3
|
|
|
MMS
|
|
Maximus, Inc. (1) (10) (11)
|
|
31.02
|
|
47.50
|
|
25.94
|
|
581
|
|
10.5
|
|
9.7
|
|
0.2
|
|
1.2
|
|
460
|
|
0.62
|
|
5.3
|
|
4.7
|
|
12.7
|
|
12.9
|
|
10.2
|
|
6.2
|
|
|
NSTC
|
|
Ness Technologies, Inc.
|
|
4.76
|
|
13.00
|
|
4.51
|
|
188
|
|
4.8
|
|
5.1
|
|
0.0
|
|
Neg
|
|
206
|
|
0.32
|
|
5.2
|
|
3.7
|
|
8.5
|
|
NE
|
|
NE
|
|
NE
|
|
|
PER
|
|
Perot Systems Corp. (1) (8) (11)
|
|
12.45
|
|
18.82
|
|
11.05
|
|
1,526
|
|
12.8
|
|
11.9
|
|
0.5
|
|
1.6
|
|
1,461
|
|
0.52
|
|
8.0
|
|
4.9
|
|
8.4
|
|
10.3
|
|
12.0
|
|
9.3
|
|
|
PRFT
|
|
Perficient, Inc.
|
|
4.21
|
|
18.19
|
|
3.74
|
|
130
|
|
5.5
|
|
4.8
|
|
Neg
|
|
0.3
|
|
111
|
|
0.48
|
|
4.1
|
|
3.3
|
|
4.4
|
|
NE
|
|
NE
|
|
NE
|
|
|
UIS
|
|
Unisys Corp.
|
|
0.67
|
|
7.90
|
|
0.50
|
|
240
|
|
Neg
|
|
4.5
|
|
Neg
|
|
Neg
|
|
1,378
|
|
0.25
|
|
8.4
|
|
2.5
|
*
|
19.9
|
|
NE
|
|
NE
|
|
NE
|
|
|
|
|
Mean:
|
|
|
|
|
|
|
|
Total
|
|
9.3x
|
|
8.3x
|
|
0.5x
|
|
1.4x
|
|
Total
|
|
0.53x
|
|
7.0x
|
|
4.7x
|
|
9.6x
|
|
10.7x
|
|
11.0x
|
|
11.6
|
%
|
|
|
|
Median:
|
|
|
|
|
|
|
|
$
|
38,203
|
|
9.6
|
|
8.4
|
|
0.4
|
|
1.2
|
|
$
|
41,355
|
|
0.50
|
|
6.9
|
|
5.1
|
|
8.5
|
|
11.3
|
|
12.0
|
|
10.7
|
|
|
|
|
Mean: (Larger Caps) (2)
|
|
|
|
|
|
|
|
|
|
10.9x
|
|
9.2x
|
|
0.7x
|
|
1.5x
|
|
|
|
0.6x
|
|
7.7x
|
|
4.5x
|
|
11.0x
|
|
11.0x
|
|
10.8x
|
|
10.9
|
%
|
|
|
|
Median: (Larger Caps) (2)
|
|
|
|
|
|
|
|
|
|
11.3
|
|
10.2
|
|
0.6
|
|
1.2
|
|
|
|
0.7
|
|
8.2
|
|
5.1
|
|
9.4
|
|
11.3
|
|
12.0
|
|
10.7
|
|
|
|
|
|
|
|
|
|
|
|
|
|
|
|
|
|
|
|
|
|
|
|
|
|
|
|
|
|
|
|
|
|
|
|
|
|
|
|
|
|
|
|
|
|
|
|
|
|
|
|
|
|
|
|
|
|
|
|
|
|
|
|
|
|
|
|
|
|
|
|
|
|
|
|
|
|
|
|
|
|
|
|
|
|
Financial Data:
($ in
millions)
|
|
|
|
|
|
|
|
|
|
|
|
|
|
|
|
|
|
|
|
|
|
|
|
|
|
|
|
|
|
|
|
|
|
|
|
|
|
|
|
|
|
|
|
|
|
|
|
|
|
|
|
|
|
|
|
|
Balance Sheet Data
|
|
|
|
|
|
|
|
|
|
|
|
|
|
|
|
|
|
|
|
|
|
|
Trailing Twelve Months
|
|
|
|
Goodwill
|
|
Total
|
|
TTM Capex/
|
|
|
|
|
|
|
|
Returns
|
|
|
|
|
|
|
TTM
|
|
Revenue/EPS Growth
|
|
Gross
|
|
|
|
|
|
Net
|
|
Cash
|
|
as % of
|
|
Debt/
|
|
TTM
|
|
Total
|
|
LQA Rev. per
|
|
|
|
TTM
|
|
CY08
|
|
|
Ticker
|
|
Company
|
|
Revenue
|
|
CY08
|
|
CY09
|
|
Margin
|
|
EBIT
|
|
EBITDA
|
|
Income
|
|
Balance
|
|
Total Assets
|
|
Total Capital
|
|
Revenue
|
|
Employees
|
|
Employee
|
|
DSO
|
|
ROE/ROIC
|
|
ROE/ROIC
|
|
|
ACN
|
|
Accenture, Ltd. (1) (3) (11)
|
|
$
|
25,313.8
|
|
15.1 / 31.5
|
%
|
-1.8 / 3.6
|
%
|
28.4
|
%
|
12.0
|
%
|
13.9
|
%
|
8.3
|
%
|
$
|
3,623.0
|
|
6.7
|
%
|
0.3
|
%
|
1.3
|
%
|
186,805
|
|
140,490
|
|
62
|
|
74.7 / 72.5
|
%
|
86.9 / 73.6
|
%
|
|
ACS
|
|
Affiliated Comp. Services, Inc.
(1) (7) (11)
|
|
6,271.9
|
|
7.2 / 8.4
|
|
6.9 / 10.9
|
|
53.5
|
|
11.2
|
|
17.4
|
|
5.7
|
|
434.8
|
|
49.5
|
|
50.0
|
|
4.9
|
|
63,000
|
|
101,870
|
|
80
|
|
15.6 / 10.4
|
|
15.4 / 10.4
|
|
|
BE
|
|
BearingPoint, Inc. (9) *
|
|
3,430.7
|
|
-2.9 / -82.2
|
|
0.9 / -96.7
|
|
16.2
|
|
Neg
|
|
0.3
|
|
Neg
|
|
350.9
|
|
27.1
|
|
176.3
|
|
1.0
|
|
15,900
|
|
223,075
|
|
72
|
|
53.1 / -15.3
|
|
NE
|
|
|
CBR
|
|
CIBER, Inc. (1) (11)
|
|
1,201.5
|
|
11.9 / 15.4
|
|
0.7 / 2.2
|
|
27.1
|
|
4.9
|
|
6.5
|
|
2.6
|
|
39.3
|
|
56.2
|
|
28.2
|
|
1.3
|
|
8,500
|
|
141,161
|
|
80
|
|
6.7 / 6.1
|
|
7.1 / 6.3
|
|
|
CSC
|
|
CSC (1) (5) (11)
|
|
17,320.7
|
|
8.0 / -0.2
|
|
-21.0 / 8.2
|
|
20.3
|
|
6.9
|
|
14.5
|
|
3.7
|
|
741.6
|
|
25.5
|
|
39.7
|
|
4.5
|
|
91,000
|
|
186,316
|
|
92
|
|
16.7 / 8.0
|
|
16.0 / 7.9
|
|
|
DTPI
|
|
Diamond Mgmt. & Tech. Consultants
(1) (6) (11)
|
|
190.0
|
|
-11.4 / -95.8
|
|
-1.6 / NM
|
|
31.1
|
|
3.2
|
|
4.1
|
|
1.5
|
|
47.1
|
|
0.0
|
|
0.0
|
|
1.4
|
|
582
|
|
278,392
|
|
34
|
|
3.9 / 2.7
|
|
19.6 / -1.0
|
|
|
HCKT
|
|
The Hackett Group, Inc.
|
|
184.6
|
|
8.7 / 94.1
|
|
9.3 / 12.1
|
|
40.9
|
|
8.4
|
|
10.1
|
|
8.1
|
|
20.3
|
|
50.5
|
|
0.0
|
|
1.4
|
|
729
|
|
269,410
|
|
61
|
|
15.1 / 11.9
|
|
NE
|
|
|
HEW
|
|
Hewitt Associates Inc. (1) (4)
|
|
3,171.3
|
|
3.9 / 21.5
|
|
0.5 / 9.5
|
|
14.5
|
|
9.9
|
|
15.7
|
|
9.1
|
|
275.2
|
|
20.5
|
|
33.5
|
|
3.3
|
|
23,000
|
|
138,188
|
|
75
|
|
23.8 / 23.9
|
|
21.5 / 19.4
|
|
|
MMS
|
|
Maximus, Inc. (1) (10) (11)
|
|
745.1
|
|
0.9 / 46.3
|
|
-1.1 / 8.
|
2
|
27.1
|
|
11.6
|
|
13.2
|
|
7.3
|
|
121.0
|
|
14.9
|
|
0.0
|
|
2.1
|
|
6,000
|
|
126,046
|
|
80
|
|
16.3 / 20.5
|
|
13.8 / 18.4
|
|
|
NSTC
|
|
Ness Technologies, Inc.
|
|
641.1
|
|
22.5 / 280.8
|
|
11.5 / -6.1
|
|
29.4
|
|
6.2
|
|
8.7
|
|
4.7
|
|
64.7
|
|
38.7
|
|
16.9
|
|
2.0
|
|
7,800
|
|
87,480
|
|
143
|
|
7.4 / 6.4
|
|
NE
|
|
|
PER
|
|
Perot Systems Corp. (1) (8) (11)
|
|
2,828.0
|
|
6.8 / 23.8
|
|
4.8 / 7.6
|
|
16.8
|
|
6.5
|
|
10.6
|
|
4.0
|
|
246.0
|
|
36.5
|
|
12.2
|
|
1.7
|
|
24,000
|
|
118,500
|
|
62
|
|
9.0 / 10.5
|
|
9.2 / 9.6
|
|
|
PRFT
|
|
Perficient, Inc.
|
|
231.9
|
|
8.3 / -2.6
|
|
7.3 / 14.5
|
|
33.7
|
|
11.6
|
|
14.7
|
|
7.0
|
|
18.3
|
|
60.6
|
|
0.0
|
|
1.0
|
|
1,323
|
|
178,685
|
|
74
|
|
9.2 / 9.9
|
|
NE
|
|
|
UIS
|
|
Unisys Corp.
|
|
5,570.1
|
|
-2.8 /-43.5
|
|
-1.6 / -215.4
|
|
23.8
|
|
2.9
|
|
9.9
|
|
(1.0
|
)
|
471.4
|
|
5.4
|
|
80.5
|
|
3.4
|
|
31,000
|
|
172,903
|
|
68
|
|
-14.0 / 7.1
|
|
NE
|
|
|
|
|
Mean:
|
|
Total
|
|
|
|
|
|
28.9
|
%
|
7.9
|
%
|
11.6
|
%
|
5.1
|
%
|
|
|
30.4
|
%
|
21.8
|
%
|
2.3
|
%
|
|
|
|
|
76
|
|
|
|
|
|
|
|
|
Median:
|
|
$
|
67,101
|
|
|
|
|
|
27.7
|
|
7.7
|
|
11.9
|
|
5.2
|
|
|
|
31.0
|
|
14.5
|
|
1.8
|
|
|
|
|
|
74
|
|
|
|
|
|
|
|
|
Mean (excl. negatives):
|
|
|
|
|
|
|
|
28.9
|
%
|
7.9
|
%
|
11.6
|
%
|
5.1
|
%
|
|
|
|
|
|
|
|
|
|
|
|
|
|
|
|
|
|
|
|
|
|
Median (excl. negatives):
|
|
|
|
|
|
|
|
27.7
|
|
7.7
|
|
11.9
|
|
5.2
|
|
|
|
|
|
|
|
|
|
|
|
|
|
|
|
|
|
|
|
|
|
|
|
|
|
|
|
|
|
|
|
|
|
|
|
|
|
|
|
|
|
|
|
|
|
|
|
|
|
|
|
|
|
|
|
|
|
|
|
|
|
|
|
|
|
|
|
|
|
|
|
|
|
|
|
|
|
|
|
|
|
|
|
|
|
|
|
|
|
|
|
|
|
|
|
|
Notes:
* Not included in mean and
median calculations
(1) Stifel Nicolaus
Research estimates.
(2) Includes ACN, ACS,
CSC, HEW, PER, and UIS.
(3) Accenture (ACN)
ROIC is GROSS of cash and investments.
(4) Hewitt TTM EBIT and
EBITDA exclude significant goodwill and asset impairment charges
(5) CSC net income and
FCF exclude restructuring and impairment charges.
(6) DTPI FCF excludes
~$20M, based on management’s estimate of
cash needed to repurchase shares to offset dilutive equity comp.
(7) Affiliated Comp.
Services EBIT, EBITDA, and NI exclude one-time
charges.
(8) PER TTM EBIT and NI
exclude the $46M TRIAD termination benefit and $18M restructuring charge
(9) BE TTM EBIT and NI
exclude lease and facilities restructuring charges
(10) MMS financials are
on continuing operations basis.
(11) Reflects C3Q08 results.
Unless otherwise noted, all
results reflect C2Q08 data.
Sources:
Company data, Bloomberg Financial Markets, First Call estimates, FactSet Research
Systems and Stifel Nicolaus Research estimates.
|
George A. Price, Jr.
|
|
Shlomo
H. Rosenbaum
|
|
Richard
M. Eskelsen
|
|
gaprice@stifel.com
|
|
shrosenbaum@stifel.com
|
|
eskelsenr@stifel.com
|
|
(443) 224-1323
|
|
(443)
224-1322
|
|
(443)
224-1366
|
9
Important Disclosures and Certifications
I, George
Price, certify that the views expressed in this research report accurately
reflect my personal views about the subject securities or issuers; and I,
George Price, certify that no part of my compensation was, is, or will be
directly or indirectly related to the specific recommendation or views
contained in this research report.
I, Shlomo
Rosenbaum, certify that the views expressed in this research report accurately
reflect my personal views about the subject securities or issuers; and I,
Shlomo Rosenbaum, certify that no part of my compensation was, is, or will be
directly or indirectly related to the specific recommendation or views
contained in this research report.
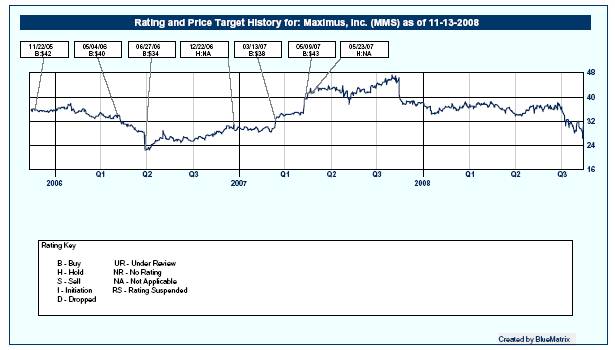
For a price chart with our
ratings and target price changes for MMS go to
http://sf.bluematrix.com/bluematrix/Disclosure?ticker=MMS
The rating and price target
history for Maximus, Inc. and its securities prior to December 1,
2005 on the above price chart reflects the research analyst’s views while
employed at the prior owner of part of the Stifel Nicolaus Capital Markets
business.
Maximus, Inc. is a
client of Stifel, Nicolaus & Company, Inc. or an affiliate or was
a client of Stifel Nicolaus or an affiliate within the past 12 months.
Maximus, Inc. is
provided with non-investment banking, securities related services by Stifel,
Nicolaus & Company, Inc. or an affiliate or was provided with
non-investment banking, securities related services by Stifel Nicolaus or an
affiliate within the past 12 months.
Stifel, Nicolaus &
Company, Inc. expects to receive or intends to seek compensation for
investment banking services from Maximus, Inc. in the next 3 months.
Stifel, Nicolaus &
Company, Inc. or an affiliate has received compensation for non-investment
banking, securities related services from Maximus, Inc. in the past 12
months.
Stifel, Nicolaus &
Company, Inc.’s research analysts receive compensation that is based upon
(among other factors) Stifel Nicolaus’ overall investment banking revenues.
Our investment rating system
is three tiered, defined as follows:
BUY -We expect this stock to
outperform the S&P 500 by more than 10% over the next 12 months. For
higher-yielding equities such as REITs and Utilities, we expect a total return
in excess of 12% over the next 12 months.
HOLD -We expect this stock
to perform within 10% (plus or minus) of the S&P 500 over the next 12
months. A Hold
10
rating is also used for
those higher-yielding securities where we are comfortable with the safety of
the dividend, but believe that upside in the share price is limited.
SELL -We expect this stock
to underperform the S&P 500 by more than 10% over the next 12 months and
believe the stock could decline in value.
Of the securities we rate,
38% are rated Buy, 57% are rated Hold, and 5% are rated Sell.
Within the last 12 months,
Stifel, Nicolaus & Company, Inc. or an affiliate has provided
investment banking services for 12%, 17% and 9% of the companies whose shares
are rated Buy, Hold and Sell, respectively.
Additional Disclosures
STIFEL NICOLAUS ACTED AS
FINANCIAL ADVISOR TO MAXIMUS, INC. IN CONNECTION WITH ITS SALE OF ITS
CORRECTIONS SERVICES BUSINESS TO PROVIDENCE SERVICE CORPORATION.
Please visit the Research
Page at www.stifel.com for the current research disclosures applicable to
the companies mentioned in this publication that are within Stifel Nicolaus’
coverage universe. For a discussion of risks to target price please see our
stand-alone company reports and notes for all Buy-rated stocks.
The information contained
herein has been prepared from sources believed to be reliable but is not
guaranteed by us and is not a complete summary or statement of all available
data, nor is it considered an offer to buy or sell any securities referred to
herein. Opinions expressed are subject to change without notice and do not take
into account the particular investment objectives, financial situation or needs
of individual investors. Employees of Stifel, Nicolaus & Company, Inc.
or its affiliates may, at times, release written or oral commentary, technical
analysis or trading strategies that differ from the opinions expressed within.
Stifel, Nicolaus &
Company, Inc. is a multi-disciplined financial services firm that
regularly seeks investment banking assignments and compensation from issuers
for services including, but not limited to, acting as an underwriter in an
offering or financial advisor in a merger or acquisition, or serving as a
placement agent in private transactions. Moreover, Stifel Nicolaus and its
affiliates and their respective shareholders, directors, officers and/or
employees, may from time to time have long or short positions in such
securities or in options or other derivative instruments based thereon.
These materials have been
approved by Stifel Nicolaus Limited, authorized and regulated by the Financial
Services Authority (UK), in connection with its distribution to professional
clients and eligible counterparties in the European Economic Area. (Stifel
Nicolaus Limited home office: London +44 20 7557 6030.) No investments or
services mentioned are available in the European Economic Area to retail
clients or to anyone in Canada other than a Designated Institution. This
investment research report is classified as objective for the purposes of the
FSA rules. Please contact a Stifel Nicolaus entity in your jurisdiction if you
require additional information.
Additional Information Is Available Upon Request
© 2008 Stifel, Nicolaus &
Company, Inc. One South Street Baltimore, MD 21202. All rights reserved.
11
Appendix 5
|

|
Commercial
IT Services
|
Maximus, Inc.
MMS — NYSE
Hold
|
|
|
|
December 15, 2008
|
|
|
|
From
|
|
To
|
|
|
Changes
|
|
(Previous)
|
|
(Current)
|
|
|
Rating
|
|
—
|
|
Hold
|
|
|
FY09E
EPS
|
|
$
|
3.11
|
|
$
|
3.04
|
|
|
(Net)
|
|
|
|
|
|
|
FY10E
EPS
|
|
$
|
3.35
|
|
$
|
3.18
|
|
|
(Net)
|
|
|
|
|
|
|
Stock Data
|
|
|
|
|
|
|
Price
(12/15/08):
|
|
|
|
$
|
33.25
|
|
|
52-Week
Range:
|
|
|
|
$
|
45
– $26
|
|
|
Market
Cap.($mm):
|
|
|
|
$
|
615.1
|
|
|
Shr.O/S-Diluted
(mm):
|
|
|
|
18.5
|
|
|
Enterprise
Val. ($mm):
|
|
|
|
$
|
509.1
|
|
|
Avg
Daily Vol (3 Mo):
|
|
|
|
264,452
|
|
|
LT
Debt/Total Cap.:
|
|
|
|
0.0
|
%
|
|
Net
Cash/Share:
|
|
|
|
$
|
6.52
|
|
|
Dividend
($):
|
|
|
|
$
|
0.40
|
|
|
Yield
(%):
|
|
|
|
1.2
|
%
|
|
Book
Value/Share:
|
|
|
|
$
|
14.87
|
|
|
S&P
Index:
|
|
|
|
879.02
|
|
Price is intraday 12-15-08.
|
EPS (Net)
|
|
2008A
|
|
2009E
|
|
2010E
|
|
|
1Q
|
|
$
|
0.59A
|
|
$
|
0.66
|
|
$
|
0.70
|
|
|
2Q
|
|
0.75A
|
|
0.75
|
|
0.79
|
|
|
3Q
|
|
0.81A
|
|
0.78
|
|
0.80
|
|
|
4Q
|
|
0.71A
|
|
0.86
|
|
0.88
|
|
|
FY Sep
|
|
$
|
2.86A
|
|
$
|
3.04
|
|
$
|
3.18
|
|
|
P/E
|
|
11.6x
|
|
10.9x
|
|
10.5x
|
|
F3Q07 per
share results do not include legal settlement charges. 2007 EPS is proforma.
FY08
quarterly EPS estimates are pro forma from continuing operations, and exclude
one-time, nonrecurring items; include $0.03 of pre-ASR interest income.
|
Revenue (Net)
|
|
$
|
807.9M
|
|
$
|
755.7M
|
|
$
|
788.1M
|
|
|
EV/Revenue
|
|
0.6x
|
|
0.7x
|
|
0.6x
|
|
FY08
revenue estimates are from continuing operations.
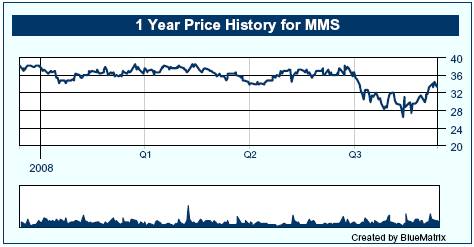
Pays To
Settle TX/Accenture Arbitration; S&L Fiscal Crisis Looms; Maint. Hold
|
George A.
Price
|
|
(443)
224-1323
|
|
gaprice@stifel.com
|
|
Shlomo
Rosenbaum
|
|
(443)
224-1322
|
|
shrosenbaum@stifel.com
|
|
Richard
Eskelsen
|
|
(443)
224-1366
|
|
eskelsenr@stifel.com
|
|
|
|
|
|
Company
Update
|
· Friday after the market
close, MMS announced it had settled the outstanding arbitration matter with
Accenture (ACN) and related outstanding contractual issues with the Texas
Health and Human Services Commission (HHSC) stemming from the TX Integrated
Eligibility contract.
· MMS taking a pretax charge
of $37.5M ($23.2M after-tax) in F4Q08, lowered previously reported F4Q08 and FY08
EPS from continuing operations, and lowered FY09 cash flow guidance. All in, consideration
provided by MMS essentially totals $50M, higher than we would have thought.
· Positively, this is one more
issue MMS is now able to put behind it, and the financial impact appears
manageable given what we view as MMS’ healthy balance sheet. Further, we
believe some investors are looking at MMS as an “Obama stock”, given its healthcare
focus and the expected stimulus plan that is expected to include significant
funding for states. MMS shares are up
6.1% versus S&P 500 down 9.1% since November 1, 2008.
· However, we remain cautious
on MMS shares for 2 primary reasons: (1) MMS continues to have to pay for
execution-related issues, and given its track record, we suspect there are more
to come, and (2) the state & local fiscal situation continues to
deteriorate, and there is risk even to more insulated health and human services
programs (MMS share price and earnings expectations tend to track with state
revenue growth, though on a lagging basis). While we believe MMS has done a
good job de-risking its business, we note 15% of revenue still comes from
consulting, including a handful of ERP projects with recent execution issues.
· MMS now trading at 11.0x our
new CY09 estimate of $3.08 (up 5.3% YOY) and at 5.9x EV/TTM EBIT. While the PE
is ahead of most commercial ITS stocks, the EV/TTM EBIT multiple is basically 1
turn below the commercial comp average of 6.8x. We note MMS’ FCF yield on our
new CY09 FCF estimate is well below the group average of ~11%. While we don’t view MMS’ valuation currently
as expensive, we remain cautious on the name given increasingly difficult
S&L fiscal situation. Maintain Hold.
All
relevant disclosures and certifications appear on pages 12 - 14 of this
report.
1
Investment
Conclusions
Friday after the market
close, MMS announced that it had settled the outstanding arbitration matter
with Accenture (ACN) and related outstanding contractual issues with the Texas
Health and Human Services Commission (HHSC) stemming from the TX Integrated
Eligibility contract terminated in March 2007. MMS will take a pretax
charge of $37.5M ($23.2M after-tax) in legal and settlement expense in F4Q08, lowered
previously reported F4Q08 and FY08 EPS from continuing operations, and lowered
FY09 cash flow guidance as a result of the payment. All in, consideration
provided by MMS essentially totals $50M, more than we would have thought MMS
would ultimately have to offer, given the company’s adamant stance on its
performance.
Positively, this is one more
issue that MMS is now able to put behind it, and the financial impact appears
very manageable given what we view as MMS’ healthy balance sheet. Further, we
believe that some investors are looking at MMS as an “Obama stock”, given its
healthcare focus and the expected stimulus plan that is expected to include
significant funding for states.
However, we remain cautious
on MMS shares for 2 primary reasons: (1) MMS continues to have to pay for
execution-related issues, and given its track record, we suspect there are more
to come (for example, there is still an outstanding issue with CT, we believe),
and (2) the state & local fiscal situation continues to
deteriorate, which in really tough times does impact more insulated health and
human services programs (MMS share price and earnings expectations tend to
track with state revenue growth, though on a lagging basis). While MMS has done
a good job de-risking its business, we note that 15% of revenue still comes
from consulting, including a handful of ERP projects that have had execution
issues recently. We also note that MMS expects a revenue headwind of $55M-$60M
in FY09 from business that will not recur from FY08 (~7.7% of FY08 revenue on a
continuing ops. basis), and approximately $70M worth of annual revenue is
currently up for rebid in TX (work re-awarded to MMS after the TX IE contract
termination).
MMS is now trading at 11.0x
our new CY09 estimate of $3.08 (up 5.3% YOY) and at 5.9x EV/TTM EBIT. While the
PE is ahead of most commercial ITS stocks, the EV/TTM EBIT multiple is
basically 1 turn below the Commercial IT Services average of 6.8x. We also note
that MMS’ FCF yield on our new CY09 FCF estimate is well below the group
average of ~11%. While we do not view MMS’ valuation currently as expensive, we
remain cautious on the name in the face of increasing difficulties in the
S&L fiscal situation. Maintain Hold.
MMS Pays To
Settle TX/ACN Contract Issues
After the close on Friday, MMS
announced that it had settled the outstanding arbitration matter with Accenture
(ACN, $28.59, Buy) and related outstanding contractual issues with the Texas
Health and Human Services Commission (HHSC) stemming from the TX Integrated
Eligibility contract terminated in March 2007. All in, consideration
provided by MMS essentially totals $50M, comprised of (1) $27.5M in
cash paid by MMS, (2) $12.5M in cash paid by MMS’ primary insurance
carrier, and (3) $10M of in-kind services to be provided by MMS to TX HHSC,
for which we understand there will be no associated profit or cash flow to MMS.
While we note that cash outflows from MMS are only the $27.5M (~$23M
after tax we believe), we view the other components as basically things that
MMS was deemed responsible for, even if they will not result in a cash outflow
from MMS. We also note that MMS is pursuing additional insurance coverage from
its excess insurance carriers, though potential timing and magnitude of any
additional coverage are not known at this time.
We also note that, according
to the TX HHSC release on the settlement, the TX Access Alliance (ACN as prime
contractor and MMS as subcontractor) will forgo $70.9M in payments for services
provided to TX, will pay $20M in cash, and will provide a $10M credit against
future work performed by MMS. Thus, while MMS (along with its primary insurance
carrier) is paying out $40M in cash (total), only $20M apparently is going to
TX. We assume the other $20M is going to ACN and nets against the A/R hit, which
we assume is born by ACN as the prime contractor. ACN indicates the terms of
the settlement are immaterial to its results.
We view the settlement as a
minor inconvenience to MMS financially, given its $120M+ in cash on the balance
sheet, and no debt. Still, some investors may find the terms of the settlement
somewhat disappointing — having expected MMS to be paid as opposed to be paying
— since MMS had been adamant in defending its work and position in the
arbitration. Positively, this is one more issue that MMS is now able to put
behind it, though given MMS’ track record
2
(not to mention the
deteriorating S&L fiscal situation — discussed in more detail below) we are
not so confident that there won’t be more issues to come. We believe MMS still
has an outstanding issue pending with the state of Connecticut.
FY08 EPS
Restated From Prior Results
MMS will take a pretax
charge of $37.5M ($23.2M after-tax) in legal and settlement expense in F4Q08, given
this is a subsequent event and the books are still technically open until the
10-K is filed. MMS would not break out the legal expense component of the
charge. As a result of the settlement, F4Q08 GAAP loss is now $1.35 per share
versus previously reported GAAP loss per share of $0.09, and earnings from
continuing operations is now a loss per share of $0.80 versus the previously
reported EPS from continuing operations of $0.45. MMS’ F4Q08 pro forma EPS from
continuing operations, excluding nonrecurring items (including the TX/ACN
settlement) remains $0.71, though we would view this number with increasing
skepticism given the numerous charges and expenses MMS has incurred over the
years due to performance and execution issues.
For full FY08 MMS now
reports GAAP earnings per diluted share of $0.35 versus previously reported
$1.55, and EPS from continuing operations of $1.48 versus previously reported
$2.67. Again, pro forma EPS from continuing operations is unchanged at $2.83, though
we view this number as $2.86 because we do not exclude the $0.03 per share in
pre-ASR interest income (from F1Q08).
FY09 Cash
Flow Guidance Reduced
As a result of the cash
settlement payment, which is expected in F1Q09 (Dec), MMS lowered its FY09 cash
flow guidance to $35M - $45M from continuing operations, versus prior guidance
of $60M - $70M. However, we again note that this excludes $11M in payments due
to recent divestitures, so reported cash flow will actually be lower (see our
revised estimates below).
S&L
Fiscal Situation Continues To Deteriorate
The Center on Budget and
Policy Priorities (www.cbpp.org) recently indicated that 37 states are now
facing mid-year budget shortfalls for current FY09 (June) totaling $31.2B. This
is after 29 states closed a total of $48B in budget shortfalls when they
enacted their FY09 budgets — i.e., things have gotten worse than expected in
terms of state revenues. Further, 28 states now estimate a cumulative budget
deficit in FY10 of over $60B. CBPP estimates this could go to a cumulative $100B
deficit when all is said and done, worse than the last downturn. California, not
surprisingly, tends to have the largest budget deficits of any single state. CA
and NY, we note, have the largest projected FY10 budget gaps according to CBPP,
at $19.5B and $12.5B, respectively ($32B of the current projected $60B). We
point out that 3 of MMS’ top-5 contracts, we believe, are in these 2 states (CA
Healthy Families and MediCal in CA, and MMS provides Medicaid enrollment broker
services in NY).
Since states generally
cannot deficit spend (unlike the Federal government), states must close these
budget gaps via one or more means — use of reserve funds, tax increases, and
spending cuts. States tend to use the first 2 first, holding off on the
spending cuts until they really need to, and thus impacts to vendors like MMS
tend to come later in the cycle. For example, MMS negatively preannounced in April 2003,
well into the last downturn, citing issues such as (1) unexpected delays
in contract signings (even where awards were made), (2) cuts in
discretionary spending, (3) states grappling with FY04 budget deficits, and
(4) uncertainty as to help from the federal government. However, it seems
clear that the current recession is setting up to be much worse and longer than
the last downturn (which lacked the same magnitude of issues in housing and
credit markets, for example), which may accelerate these issues.
MMS Share
Price And EPS Growth/Outlook Follow State Fiscal Situation And GDP
We highlight the 3 charts
below, which illustrate a few things, in our opinion: (1) state tax
revenue growth tends to lag the business cycle (GDP) by roughly a year,
(2) MMS share prices tends to track state tax revenue growth over time
(though we acknowledge several divergences, often due to company-specific
issues, such as the declines in 2006 due
3
to the initial losses on the
TX Integrated Eligibility contract), and (3) MMS forward EPS expectations
(using 2-year forward FirstCall consensus estimates) rose through the last
business cycle (and even into the early portion of the downturn) and then
cracked as state trends deteriorated materially.
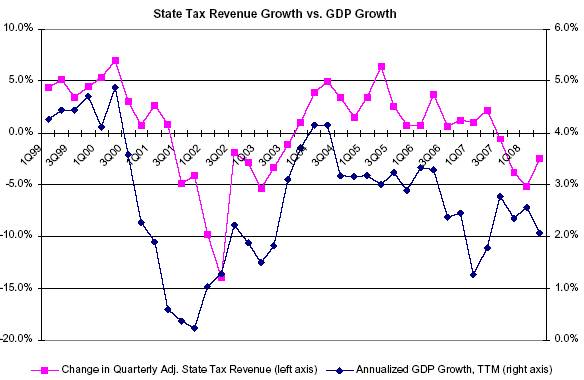
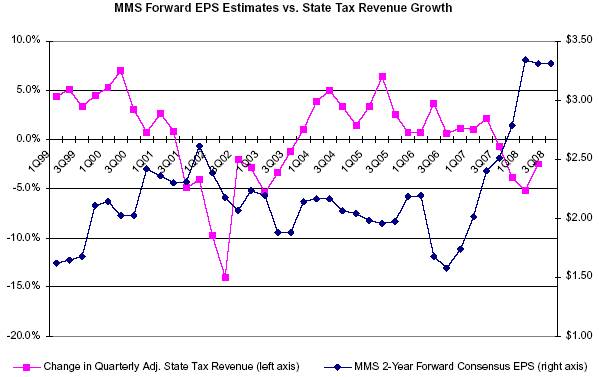
4
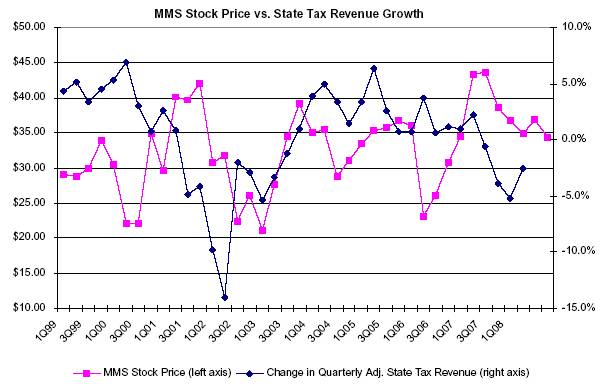
Source for
graphs: Rockefeller Institute of Government, Factset, and Stifel Nicolaus.
On the last point, one could
look at the chart and say that history might be repeating itself (i.e., MMS
forward EPS expectations have increased substantially even as the economy and
state fiscal conditions have begun to deteriorate). We must acknowledge that a
good portion of the improvement in MMS’ EPS outlook is due to factors like getting
past the TX issues, as well as positive steps by the company to improve
profitability and de-risk its operations (e.g., shifted focus away from larger,
riskier deals, divested troublesome operations, etc.). However, that being
said, we still believe that obvious and logical dependencies are likely to hold
true at some point — if states (and other municipalities) are facing tough
fiscal times, companies that provide services to them are at risk. We’ve seen
this before.
But Aren’t
Health And Human Services More Insulated From Macro Conditions?...
Generally, yes, but to a
point, in our opinion. To be sure, politicians and other government employees
are generally loath to cut services for the poor and disadvantaged (e.g., Medicaid,
SCHIP) in a downturn. Doing so is not very politically favorable. But that
being said, when things get bad, almost everything is potentially on the table
for cuts (again, we point to MMS preannouncing in the last downturn). We note
the following comments from CBPP (from “State Budget Troubles Worsen”, by
Elizabeth McNichol and Iris J. Lav, Center on Budget and Policy Priorities, December 10,
2008):
· “... at least
17 states have implemented or are considering cuts that will affect low-income children’s
or families’ eligibility for health insurance or reduce their access to health
care services.” (in current slowdown)
· “The experience of the last
recession is instructive as to what kinds of actions states may take. Between
2002 and 2004 states reduced services significantly. For example, in the last
recession, some 34 states cut eligibility for public health programs, causing
well over 1 million people to lose health coverage, and at least 23 states cut
eligibility for child care subsidies or otherwise limited access to child care.”
5
...And What
About President Elect Obama’s Stimulus Plan With Funding For The States?
This is an uncertainty. Clearly,
President-Elect Obama has indicated support for states in general and for
health programs administered by the states, in what is expected to be a very
large stimulus package that is expected to be enacted shortly after he takes
office in January 2009. Even money given to the states for other things
like infrastructure would likely help fiscal conditions overall, and thus
alleviate some pressure on programs for which MMS provides services. In
addition, President-Elect Obama and other Democrats have indicated that current
health programs may be supported as a first step to more systemic improvements
in health care coverage in the U.S. This could ultimately benefit companies
like MMS. Also, federal funding for the State Children’s Health Insurance Plan
(SCHIP) expires at the end of March 2009, and media reports indicate there
is bipartisan support for not only extending, but possibly expanding, this
program, which could also ultimately benefit companies like MMS.
It remains to be seen, however,
how much money we are talking about for a stimulus package, how much goes to
the states, and in what form and via what programs.
Estimates
General Assumptions:
· MMS has $55M-$60M of work
from FY08 that does not recur in FY09 (7.4%-8.1% of FY08 revenue on continuing
ops. basis), as projects wind down or MMS voluntarily does not rebid work on
unacceptable terms.
· MMS has ~3.3% currency
headwind in FY09, based on current FX average and spot rates.
· Before currency and nonrecurring
revenue impacts, we view Operations growth ~10% and Consulting growth as
~1%-2%.
· MMS wins its 2 TX recompetes
(~$70M of annual revenue, or ~9.4% of FY08 revenue on continuing ops. basis) on
terms fairly comparable to current terms.
· Pro forma OPM from
continuing operations falls from 11.7% to 11.1%, based on tighter state &
local fiscal conditions and likely performance issues on ERP and other legacy
consulting/integration contracts.
· Tax rate 37.5%.
· MMS continues to repurchase
shares, using the remaining $31M of authorization through FY09 at an average
price of $30 per share.
6
ESTIMATES
|
F1Q09
|
|
Current
|
|
Prior
|
|
Variance
|
|
YOY
Change
|
|
Comment
|
|
Revenue ($M, as reported)
|
|
$
|
179.2
|
|
$
|
180.7
|
|
$
|
(1.5
|
)
|
-11.3
|
%
|
Includes impact of divestitures. Up 1.2% YOY on a
continuing operations basis. Assumes some drop off in revenue, plus ~2.5%
impact from currency.
|
|
Gross
Margin
|
|
27.4
|
%
|
27.4
|
%
|
No change
|
|
+ 130 bps
|
|
Reflects divestiture of underperforming Systems
business.
|
|
Operating Margin (excl. charges)
|
|
10.3
|
%
|
10.4
|
%
|
- 10 bps
|
|
+ 100
bps
|
|
Reflects divestiture of underperforming Systems
business. Actually down 60 bps YOY on continuing ops. basis due to ERP cost
overruns.
|
|
Diluted EPS (pro forma, cont. ops.)
|
|
$
|
0.66
|
|
$
|
0.67
|
|
$
|
(0.01
|
)
|
11.9
|
%
|
Up basically due to share repurchases. Using net
income against F1Q08 share count, EPS would be down $0.02 YOY.
|
|
FCF
($M)
|
|
$
|
(15.9
|
)
|
$
|
11.3
|
|
$
|
(27.1
|
)
|
$
|
(32.6
|
)
|
Down largely due to anticipated cash payout of $27.5M
net of insurance in F1Q09.
|
|
|
|
|
|
|
|
|
|
|
|
|
|
FY09
|
|
Current
|
|
Prior
|
|
Variance
|
|
YOY
Change
|
|
Comment
|
|
Revenue ($M, as reported)
|
|
$
|
755.7
|
|
$
|
765.8
|
|
$
|
(10.1
|
)
|
-6.5
|
%
|
Includes impact of divestitures. Up 1.4% YOY on a
continuing operations basis. Assumes ~1% of revenue from FY08 does not
persist, plus ~3.3% currency headwind.
|
|
Gross
Margin
|
|
28.0
|
%
|
28.0
|
%
|
No change
|
|
+ 170 bps
|
|
Reflects divestiture of underperforming Systems
business.
|
|
Operating Margin (excl. charges)
|
|
11.1
|
%
|
11.1
|
%
|
No
change
|
|
- 60 bps
|
|
On continuing ops. basis, excluding goodwill
impairment, TX settlement, and other “nonrecurring” charges.
|
|
Diluted EPS (pro forma, cont. ops.)
|
|
$
|
3.04
|
|
$
|
3.11
|
|
$
|
(0.07
|
)
|
6.3
|
%
|
|
|
FCF
($M)
|
|
$
|
6.4
|
|
$
|
39.2
|
|
$
|
(32.8
|
)
|
$
|
(34.7
|
)
|
Down largely due to anticipated cash payout of $27.5M
net of insurance in F1Q09. Includes anticipated $11M of payments made as
result of divestitures.
|
|
|
|
|
|
|
|
|
|
|
|
|
|
FY10
|
|
Current
|
|
Prior
|
|
Variance
|
|
YOY
Change
|
|
Comment
|
|
Revenue ($M, as reported)
|
|
$
|
788.1
|
|
$
|
818.0
|
|
$
|
(30.0
|
)
|
4.3
|
%
|
Assumes ~7% growth in Operations excluding currency
and FY08 revenue that does not recur. Also now assume greater demand
headwinds for Consulting segment (down 5.7% YOY versus prior -2.6%).
|
|
Gross
Margin
|
|
27.7
|
%
|
27.7
|
%
|
No change
|
|
- 30 bps
|
|
State & local fiscal pressures.
|
|
Operating Margin (excl. charges)
|
|
10.8
|
%
|
10.8
|
%
|
No
change
|
|
- 30 bps
|
|
State & local fiscal pressures.
|
|
Diluted EPS (pro forma)
|
|
$
|
3.18
|
|
$
|
3.35
|
|
$
|
(0.17
|
)
|
4.6
|
%
|
Lower revenue.
|
|
FCF
($M)
|
|
$
|
44.2
|
|
$
|
50.8
|
|
$
|
(6.6
|
)
|
$
|
37.8
|
|
Higher capex assumption. FCF ~80% of net income.
|
|
|
|
|
|
|
|
|
|
|
|
|
|
Calendar
Year
|
|
Current
|
|
Prior
|
|
Variance
|
|
YOY
Change
|
|
Comment
|
|
CY08
Revenue ($M, as reported)
|
|
$
|
785.2
|
|
$
|
786.7
|
|
$
|
(1.5
|
)
|
0.7
|
%
|
|
|
CY08 Pro forma EPS
|
|
$
|
2.93
|
|
$
|
2.94
|
|
$
|
(0.01
|
)
|
NM
|
|
|
|
CY09
Revenue ($M, as reported)
|
|
$
|
763.3
|
|
$
|
778.0
|
|
$
|
(14.6
|
)
|
-2.8
|
%
|
|
|
CY09 Pro forma EPS
|
|
$
|
3.08
|
|
$
|
3.18
|
|
$
|
(0.10
|
)
|
5.3
|
%
|
|
Source: Company data and Stifel Nicolaus.
Valuation
MMS is now trading at 11.0x
our new CY09 estimate of $3.08 (up 5.3% YOY) and at 5.9x EV/TTM EBIT. While the
PE is ahead of most commercial ITS stocks, the EV/TTM EBIT multiple is
basically 1 turn below the Commercial IT Services average of 6.8x. We also note
that MMS’ FCF yield on our new CY09 FCF estimate is well below the group
average of ~11%. While we do not view MMS’ valuation currently as expensive, we
remain cautious on the name in the face of increasing difficulties in the
S&L fiscal situation.
We believe that some
currently view MMS as an “Obama stock” in that the company focuses on core HHS
services such as Medicaid and SCHIP that are more popular under a Democratic
administration and that the company would benefit from the new administration
directing fiscal aid to the states. We note that MMS shares have outperformed
the S&P 500 since the beginning of November 2008 (MMS up 6.1% versus
S&P 500 down 9.1% in that period). While we believe that the expected
stimulus plan and potential reauthorization of SCHIP will ultimately benefit
MMS (or at least relieve a lot of pressure effaced by MMS’ clients), the timing
and magnitude of this are uncertain, and we believe the S&L fiscal
situation is likely to get worse before it gets better. We remain concerned
that the realities of a poor
7
economy, economic issues
throughout the country (e.g., Detroit auto bailout, continuing issues in credit
markets and housing, and a poor consumer outlook), and the magnitude of
budgetary gaps for the states pose a risk to services even in more insulated
areas like Medicaid and SCHIP. In addition, MMS faces currency headwinds in
FY09, ~7.7% revenue headwind in FY09 from nonrecurring revenue, and recompetes
include 2 TX contracts that account for ~9% of total revenue. Maintain Hold.
In our view, MMS is also
very likely a sale candidate when credit markets come back and potential
suitors become less focused on hoarding cash, but that it seems is likely to
take some time as well.
Company Description
Founded in 1975, Maximus is
a leader in providing program management support (including both IT services
and business process outsourcing) and consulting services primarily to health
and human services agencies in state and local governments. Maximus utilizes
technology combined with its strong program management skills and understanding
of government agencies’ business processes to result in an operation that is
more efficient than governments could achieve on their own at similar costs. Maximus
is based in McLean, Virginia.
8
Maximus, Inc.
Income Statement
($ in thousands, except per share)
Fiscal year ends September 30
|
|
|
|
|
|
|
|
|
|
|
|
|
|
|
|
|
|
|
|
|
|
|
|
|
|
|
|
|
|
|
|
|
|
|
|
|
|
|
|
|
|
|
|
|
|
|
|
|
|
|
|
Income Statement
|
|
2007
|
|
1Q08
|
|
2Q08
|
|
3Q08
|
|
4Q08
|
|
2008
|
|
1Q09E
|
|
2Q09E
|
|
3Q09E
|
|
4Q09E
|
|
2009E
|
|
1Q10E
|
|
2Q10E
|
|
3Q10E
|
|
4Q10E
|
|
2010E
|
|
|
Revenue
(as reported)
|
|
$
|
738,646
|
|
$
|
201,950
|
|
$
|
210,584
|
|
$
|
206,324
|
|
$
|
189,069
|
|
$
|
807,927
|
|
$
|
179,199
|
|
$
|
192,436
|
|
$
|
190,950
|
|
$
|
193,157
|
|
$
|
755,742
|
|
$
|
186,796
|
|
$
|
200,727
|
|
$
|
199,004
|
|
$
|
201,537
|
|
$
|
788,064
|
|
|
Year-over-year % Change (as reported)
|
|
5.4
|
%
|
25.3
|
%
|
17.6
|
%
|
5.0
|
%
|
-6.3
|
%
|
9.4
|
%
|
-11.3
|
%
|
-8.6
|
%
|
-7.5
|
%
|
2.2
|
%
|
-6.5
|
%
|
4.2
|
%
|
4.3
|
%
|
4.2
|
%
|
4.3
|
%
|
4.3
|
%
|
|
Year-over-year % Change (continuing ops.)
|
|
|
|
34.4
|
%
|
25.7
|
%
|
11.4
|
%
|
8.8
|
%
|
19.0
|
%
|
1.2
|
%
|
1.5
|
%
|
0.8
|
%
|
2.2
|
%
|
1.4
|
%
|
|
|
|
|
|
|
|
|
|
|
|
Sequential % Change
|
|
5.4
|
%
|
0.0
|
%
|
4.3
|
%
|
-2.0
|
%
|
-8.4
|
%
|
9.4
|
%
|
-5.2
|
%
|
7.4
|
%
|
-0.8
|
%
|
1.2
|
%
|
-6.5
|
%
|
-3.3
|
%
|
7.5
|
%
|
-0.9
|
%
|
1.3
|
%
|
4.3
|
%
|
|
Salaries, wages and other
|
|
561,563
|
|
149,183
|
|
156,694
|
|
151,086
|
|
138,260
|
|
595,223
|
|
130,099
|
|
139,324
|
|
136,338
|
|
138,300
|
|
544,061
|
|
136,175
|
|
145,929
|
|
142,686
|
|
144,905
|
|
569,694
|
|
|
Gross Profit
|
|
177,083
|
|
52,767
|
|
53,890
|
|
55,238
|
|
50,809
|
|
212,704
|
|
49,101
|
|
53,112
|
|
54,612
|
|
54,857
|
|
211,681
|
|
50,622
|
|
54,798
|
|
56,318
|
|
56,632
|
|
218,370
|
|
|
Gross
Margin
|
|
24.0
|
%
|
26.1
|
%
|
25.6
|
%
|
26.8
|
%
|
26.9
|
%
|
26.3
|
%
|
27.4
|
%
|
27.6
|
%
|
28.6
|
%
|
28.4
|
%
|
28.0
|
%
|
27.1
|
%
|
27.3
|
%
|
28.3
|
%
|
28.1
|
%
|
27.7
|
%
|
|
Selling Gen & Admin
|
|
131,752
|
|
33,033
|
|
35,019
|
|
35,213
|
|
29,126
|
|
132,391
|
|
29,760
|
|
31,616
|
|
32,589
|
|
30,722
|
|
124,687
|
|
31,021
|
|
32,978
|
|
33,964
|
|
32,054
|
|
130,018
|
|
|
Stock Option Expense
|
|
3,829
|
|
1,020
|
|
2,154
|
|
1,595
|
|
1,774
|
|
6,543
|
|
800
|
|
800
|
|
800
|
|
800
|
|
3,200
|
|
800
|
|
800
|
|
800
|
|
800
|
|
3,200
|
|
|
Consolidating Adjustment & Other
|
|
—
|
|
—
|
|
—
|
|
—
|
|
—
|
|
—
|
|
—
|
|
—
|
|
—
|
|
—
|
|
—
|
|
—
|
|
—
|
|
—
|
|
—
|
|
—
|
|
|
Charges/Nonrecurring Items
|
|
44,638
|
|
2,200
|
|
931
|
|
3,737
|
|
44,327
|
|
51,195
|
|
—
|
|
—
|
|
—
|
|
—
|
|
—
|
|
—
|
|
—
|
|
—
|
|
—
|
|
—
|
|
|
Total Operating Expense
|
|
180,219
|
|
36,253
|
|
38,104
|
|
40,545
|
|
75,227
|
|
190,129
|
|
30,560
|
|
32,416
|
|
33,389
|
|
31,522
|
|
127,887
|
|
31,821
|
|
33,778
|
|
34,764
|
|
32,854
|
|
133,218
|
|
|
% of Revenue
|
|
24.4
|
%
|
18.0
|
%
|
18.1
|
%
|
19.7
|
%
|
39.8
|
%
|
23.5
|
%
|
17.1
|
%
|
16.8
|
%
|
17.5
|
%
|
16.3
|
%
|
16.9
|
%
|
17.0
|
%
|
16.8
|
%
|
17.5
|
%
|
16.3
|
%
|
16.9
|
%
|
|
Operating Income (GAAP)
|
|
(3,136
|
)
|
16,514
|
|
15,786
|
|
14,693
|
|
(24,418
|
)
|
22,575
|
|
18,541
|
|
20,696
|
|
21,223
|
|
23,335
|
|
83,795
|
|
18,801
|
|
21,020
|
|
21,554
|
|
23,778
|
|
85,153
|
|
|
% Change
|
|
11.0
|
%
|
-195.0
|
%
|
580.4
|
%
|
-248.0
|
%
|
-211.8
|
%
|
-819.9
|
%
|
12.3
|
%
|
31.1
|
%
|
44.4
|
%
|
-195.6
|
%
|
271.2
|
%
|
-16.7
|
%
|
13.4
|
%
|
4.1
|
%
|
12.0
|
%
|
1.6
|
%
|
|
Oper. Margin (GAAP)
|
|
-0.4
|
%
|
8.2
|
%
|
7.5
|
%
|
7.1
|
%
|
-12.9
|
%
|
2.8
|
%
|
10.3
|
%
|
10.8
|
%
|
11.1
|
%
|
12.1
|
%
|
11.1
|
%
|
10.1
|
%
|
10.5
|
%
|
10.8
|
%
|
11.8
|
%
|
10.8
|
%
|
|
Oper. Margin (Continuing Ops.)
|
|
|
|
10.9
|
%
|
11.7
|
%
|
14.3
|
%
|
-12.9
|
%
|
5.9
|
%
|
|
|
|
|
|
|
|
|
|
|
|
|
|
|
|
|
|
|
|
|
|
Operating
Margin (excl. charges)
|
|
5.6
|
%
|
9.3
|
%
|
7.9
|
%
|
8.9
|
%
|
10.5
|
%
|
9.1
|
%
|
10.3
|
%
|
10.8
|
%
|
11.1
|
%
|
12.1
|
%
|
11.1
|
%
|
10.1
|
%
|
10.5
|
%
|
10.8
|
%
|
11.8
|
%
|
10.8
|
%
|
|
Investment Income
|
|
5,804
|
|
1,501
|
|
107
|
|
490
|
|
325
|
|
2,423
|
|
545
|
|
484
|
|
474
|
|
466
|
|
1,969
|
|
776
|
|
878
|
|
922
|
|
959
|
|
3,535
|
|
|
Minority Interest
|
|
451
|
|
—
|
|
—
|
|
—
|
|
—
|
|
—
|
|
—
|
|
—
|
|
—
|
|
—
|
|
—
|
|
—
|
|
—
|
|
—
|
|
—
|
|
—
|
|
|
Income Before Income Taxes
|
|
3,119
|
|
18,015
|
|
15,893
|
|
15,183
|
|
(24,093
|
)
|
24,998
|
|
19,086
|
|
21,180
|
|
21,696
|
|
23,801
|
|
85,764
|
|
19,576
|
|
21,898
|
|
22,476
|
|
24,737
|
|
88,688
|
|
|
Pretax Margin
|
|
0.4
|
%
|
8.9
|
%
|
7.5
|
%
|
7.4
|
%
|
-12.7
|
%
|
3.1
|
%
|
10.7
|
%
|
11.0
|
%
|
11.4
|
%
|
12.3
|
%
|
11.3
|
%
|
10.5
|
%
|
10.9
|
%
|
11.3
|
%
|
12.3
|
%
|
11.3
|
%
|
|
% Change
|
|
-22.7
|
%
|
-211.1
|
%
|
303.9
|
%
|
-268.1
|
%
|
-198.6
|
%
|
701.5
|
%
|
5.9
|
%
|
33.3
|
%
|
42.9
|
%
|
-198.8
|
%
|
243.1
|
%
|
-21.7
|
%
|
14.7
|
%
|
6.1
|
%
|
14.0
|
%
|
3.4
|
%
|
|
Provision for Income Taxes
|
|
11,374
|
|
7,410
|
|
6,266
|
|
5,379
|
|
(9,321
|
)
|
9,734
|
|
7,157
|
|
7,943
|
|
8,136
|
|
8,925
|
|
32,161
|
|
7,341
|
|
8,212
|
|
8,429
|
|
9,276
|
|
33,258
|
|
|
Tax Rate
|
|
364.7
|
%
|
41.1
|
%
|
39.4
|
%
|
35.4
|
%
|
38.7
|
%
|
38.9
|
%
|
37.5
|
%
|
37.5
|
%
|
37.5
|
%
|
37.5
|
%
|
37.5
|
%
|
37.5
|
%
|
37.5
|
%
|
37.5
|
%
|
37.5
|
%
|
37.5
|
%
|
|
Income from Continuing Ops.
|
|
(8,255
|
)
|
12,268
|
|
13,489
|
|
17,296
|
|
(14,772
|
)
|
28,281
|
|
11,929
|
|
13,238
|
|
13,560
|
|
14,876
|
|
53,602
|
|
12,235
|
|
13,687
|
|
14,048
|
|
15,460
|
|
55,430
|
|
|
Margin
|
|
-1.1
|
%
|
6.1
|
%
|
6.4
|
%
|
8.4
|
%
|
-7.8
|
%
|
3.5
|
%
|
6.7
|
%
|
6.9
|
%
|
7.1
|
%
|
7.7
|
%
|
7.1
|
%
|
6.6
|
%
|
6.8
|
%
|
7.1
|
%
|
7.7
|
%
|
7.0
|
%
|
|
Income from Discontinued Ops.
|
|
—
|
|
(1,663
|
)
|
(3,862
|
)
|
(5,891
|
)
|
(10,188
|
)
|
(21,604
|
)
|
—
|
|
—
|
|
—
|
|
—
|
|
—
|
|
|
|
|
|
|
|
|
|
|
|
|
Net Income
|
|
(8,255
|
)
|
10,605
|
|
9,627
|
|
11,405
|
|
(24,960
|
)
|
6,677
|
|
11,929
|
|
13,238
|
|
13,560
|
|
14,876
|
|
53,602
|
|
|
|
|
|
|
|
|
|
|
|
|
Net Margin
|
|
-1.1
|
%
|
5.3
|
%
|
4.6
|
%
|
5.5
|
%
|
-13.2
|
%
|
0.8
|
%
|
6.7
|
%
|
6.9
|
%
|
7.1
|
%
|
7.7
|
%
|
7.1
|
%
|
|
|
|
|
|
|
|
|
|
|
|
Earnings
Per Share (GAAP)
|
|
$
|
(0.40
|
)
|
$
|
0.51
|
|
$
|
0.51
|
|
$
|
0.61
|
|
$
|
(1.35
|
)
|
$
|
0.35
|
|
$
|
0.66
|
|
$
|
0.75
|
|
$
|
0.78
|
|
$
|
0.86
|
|
$
|
3.04
|
|
$
|
0.70
|
|
$
|
0.79
|
|
$
|
0.80
|
|
$
|
0.88
|
|
$
|
3.18
|
|
|
% Change
|
|
NM
|
|
NM
|
|
NM
|
|
NM
|
|
NM
|
|
NM
|
|
29.4
|
%
|
47.1
|
%
|
27.9
|
%
|
NM
|
|
NM
|
|
103.0
|
%
|
18.6
|
%
|
7.8
|
%
|
13.8
|
%
|
4.4
|
%
|
|
Earnings Per Share (Continuing Ops.)
|
|
|
|
$
|
0.59
|
|
$
|
0.72
|
|
$
|
0.92
|
|
$
|
(0.80
|
)
|
$
|
1.47
|
|
$
|
0.66
|
|
$
|
0.75
|
|
$
|
0.78
|
|
$
|
0.86
|
|
$
|
3.04
|
|
$
|
0.70
|
|
$
|
0.79
|
|
$
|
0.80
|
|
$
|
0.88
|
|
$
|
3.18
|
|
|
% Change
|
|
|
|
|
|
|
|
|
|
|
|
|
|
11.9
|
%
|
4.2
|
%
|
-15.2
|
%
|
NM
|
|
106.8
|
%
|
6.1
|
%
|
5.3
|
%
|
2.6
|
%
|
2.3
|
%
|
4.6
|
%
|
|
Earnings
Per Share (Continuing Ops., pro forma)
|
|
|
|
$
|
0.59
|
|
$
|
0.75
|
|
$
|
0.81
|
|
$
|
0.71
|
|
$
|
2.86
|
|
$
|
0.66
|
|
$
|
0.75
|
|
$
|
0.78
|
|
$
|
0.86
|
|
$
|
3.04
|
|
$
|
0.70
|
|
$
|
0.79
|
|
$
|
0.80
|
|
$
|
0.88
|
|
$
|
3.18
|
|
|
% Change
|
|
|
|
|
|
|
|
|
|
|
|
|
|
11.9
|
%
|
0.0
|
%
|
-3.7
|
%
|
21.1
|
%
|
6.3
|
%
|
6.1
|
%
|
5.3
|
%
|
2.6
|
%
|
2.3
|
%
|
4.6
|
%
|
|
Shares Outstanding (000s)
|
|
22,029
|
|
20,854
|
|
18,763
|
|
18,819
|
|
18,540
|
|
19,244
|
|
18,008
|
|
17,749
|
|
17,490
|
|
17,318
|
|
17,641
|
|
17,368
|
|
17,418
|
|
17,468
|
|
17,518
|
|
17,443
|
|
|
|
|
|
|
|
|
|
|
|
|
|
|
|
|
|
|
|
|
|
|
|
|
|
|
|
|
|
|
|
|
|
|
|
|
|
Calendar
Year
|
|
|
|
|
|
|
|
|
|
|
|
|
|
|
|
|
|
|
|
|
|
|
|
|
|
|
|
CY 08
|
|
CY 09
|
|
CY 010
|
|
|
EPS
(Continuing Ops., pro forma)
|
|
|
|
|
|
|
|
|
|
|
|
|
|
|
|
|
|
|
|
|
|
|
|
|
|
|
|
$
|
2.93
|
|
$
|
3.08
|
|
$
|
3.26
|
|
|
% Change YOY
|
|
|
|
|
|
|
|
|
|
|
|
|
|
|
|
|
|
|
|
|
|
|
|
|
|
|
|
|
|
5.3
|
%
|
5.8
|
%
|
|
|
|
|
|
|
|
|
|
|
|
|
|
|
|
|
|
|
|
|
|
|
|
|
|
|
|
|
|
|
|
|
|
|
|
|
Ratios
|
|
2007
|
|
1Q08
|
|
2Q08
|
|
3Q08
|
|
4Q08
|
|
2008
|
|
1Q09E
|
|
2Q09E
|
|
3Q09E
|
|
4Q09E
|
|
2009E
|
|
1Q10E
|
|
2Q10E
|
|
3Q10E
|
|
4Q10E
|
|
2010E
|
|
|
A/R in Days Sales
|
|
85
|
|
75
|
|
75
|
|
77
|
|
76
|
|
71
|
|
76
|
|
75
|
|
78
|
|
81
|
|
83
|
|
75
|
|
74
|
|
77
|
|
80
|
|
82
|
|
|
A/P and Accrued Days Op. Exp.
|
|
28
|
|
26
|
|
25
|
|
25
|
|
26
|
|
24
|
|
25
|
|
25
|
|
25
|
|
26
|
|
26
|
|
24
|
|
24
|
|
24
|
|
25
|
|
25
|
|
|
Current Ratio
|
|
3.03
|
|
2.1
|
|
2.3
|
|
2.4
|
|
1.9
|
|
1.92
|
|
2.3
|
|
2.3
|
|
2.3
|
|
2.3
|
|
2.33
|
|
2.5
|
|
2.5
|
|
2.6
|
|
2.7
|
|
2.67
|
|
|
Return on Assets, avg
|
|
-1.5
|
%
|
8.7
|
%
|
9.1
|
%
|
9.1
|
%
|
-13.3
|
%
|
52.2
|
%
|
11.1
|
%
|
12.7
|
%
|
12.8
|
%
|
13.8
|
%
|
48.2
|
%
|
11.2
|
%
|
12.2
|
%
|
12.1
|
%
|
12.9
|
%
|
48.0
|
%
|
|
Return on Equity, avg.
|
|
-2.0
|
%
|
12.4
|
%
|
13.8
|
%
|
13.5
|
%
|
-20.6
|
%
|
19.4
|
%
|
17.1
|
%
|
18.5
|
%
|
18.7
|
%
|
20.0
|
%
|
18.6
|
%
|
15.9
|
%
|
17.2
|
%
|
16.9
|
%
|
17.9
|
%
|
16.9
|
%
|
|
NOPAT/Capital*
|
|
1.9
|
%
|
10.8
|
%
|
13.0
|
%
|
12.4
|
%
|
-18.3
|
%
|
16.6
|
%
|
14.2
|
%
|
16.6
|
%
|
16.7
|
%
|
18.0
|
%
|
15.6
|
%
|
14.1
|
%
|
15.2
|
%
|
15.0
|
%
|
15.9
|
%
|
15.0
|
%
|
|
Book Value, end
|
|
$
|
18.36
|
|
$
|
13.07
|
|
$
|
15.18
|
|
$
|
15.78
|
|
$
|
14.87
|
|
$
|
14.33
|
|
$
|
15.74
|
|
$
|
16.22
|
|
$
|
16.74
|
|
$
|
17.41
|
|
$
|
17.09
|
|
$
|
18.01
|
|
$
|
18.69
|
|
$
|
19.39
|
|
$
|
20.16
|
|
$
|
20.25
|
|
Some calculations may vary due to rounding.
Source: Maximus, Inc. data
and Stifel Nicolaus estimates
|
|
12/15/2008
|
|
|
|
|
|
|
George A. Price, Jr.
|
Shlomo H. Rosenbaum
|
Richard M. Eskelsen
|
|
(443) 224-1323
|
(443) 224-1322
|
(443) 224-1366
|
|
gaprice@stifel.com
|
shrosenbaum@stifel.com
|
eskelsenr@stifel.com
|
9
Maximus, Inc.
Balance Sheet and Cash Flow
($
in thousands)
FY ends September 30
|
|
|
|
|
|
|
|
|
|
|
|
|
|
|
|
|
|
|
|
|
|
|
|
|
|
|
|
|
|
|
|
|
|
|
|
|
|
|
|
|
|
|
|
|
|
|
|
|
|
|
|
Balance Sheet
|
|
FY07
|
|
1Q08
|
|
2Q08
|
|
3Q08
|
|
4Q08
|
|
FY08
|
|
1Q09E
|
|
2Q09E
|
|
3Q09E
|
|
4Q09E
|
|
FY09E
|
|
1Q10E
|
|
2Q10E
|
|
3Q10E
|
|
4Q10E
|
|
FY10E
|
|
|
Cash and short-term
investments
|
|
|
|
$
|
62,654
|
|
$
|
63,747
|
|
$
|
78,271
|
|
$
|
120,957
|
|
|
|
$
|
97,094
|
|
$
|
96,523
|
|
93,045
|
|
$
|
93,382
|
|
|
|
$
|
113,524
|
|
$
|
120,711
|
|
$
|
125,107
|
|
$
|
130,624
|
|
|
|
|
Accounts receivable, net
|
|
|
|
119,267
|
|
122,692
|
|
126,793
|
|
128,819
|
|
|
|
111,502
|
|
117,600
|
|
120,935
|
|
126,625
|
|
|
|
114,153
|
|
120,436
|
|
123,825
|
|
129,880
|
|
|
|
|
Unbilled receivables
|
|
|
|
49,771
|
|
52,314
|
|
49,721
|
|
30,695
|
|
|
|
39,822
|
|
42,764
|
|
44,555
|
|
47,216
|
|
|
|
41,510
|
|
44,606
|
|
46,434
|
|
49,265
|
|
|
|
|
Prepaid and other
current assets
|
|
|
|
7,688
|
|
15,719
|
|
11,649
|
|
10,215
|
|
|
|
10,215
|
|
10,215
|
|
10,215
|
|
10,215
|
|
|
|
10,215
|
|
10,215
|
|
10,215
|
|
10,215
|
|
|
|
|
Deferred taxes
|
|
|
|
11,267
|
|
9,490
|
|
10,255
|
|
25,750
|
|
|
|
13,250
|
|
13,250
|
|
13,250
|
|
13,250
|
|
|
|
13,250
|
|
13,250
|
|
13,250
|
|
13,250
|
|
|
|
|
Total
current assets
|
|
|
|
250,647
|
|
263,962
|
|
276,689
|
|
316,436
|
|
|
|
271,882
|
|
280,351
|
|
282,000
|
|
290,688
|
|
|
|
292,652
|
|
309,218
|
|
318,831
|
|
333,234
|
|
|
|
|
Property, plant and
equipment, net
|
|
|
|
35,580
|
|
34,333
|
|
33,799
|
|
33,994
|
|
|
|
38,841
|
|
41,052
|
|
43,226
|
|
45,455
|
|
|
|
47,524
|
|
49,943
|
|
52,318
|
|
54,756
|
|
|
|
|
Net Software Development
Costs
|
|
|
|
29,306
|
|
29,183
|
|
29,714
|
|
14,125
|
|
|
|
14,125
|
|
14,125
|
|
14,125
|
|
14,125
|
|
|
|
14,125
|
|
14,125
|
|
14,125
|
|
14,125
|
|
|
|
|
Deferred contract costs
|
|
|
|
7,712
|
|
6,273
|
|
5,435
|
|
5,324
|
|
|
|
5,324
|
|
5,324
|
|
5,324
|
|
5,324
|
|
|
|
5,324
|
|
5,324
|
|
5,324
|
|
5,324
|
|
|
|
|
Deferred taxes
|
|
|
|
—
|
|
—
|
|
—
|
|
10,933
|
|
|
|
10,933
|
|
10,933
|
|
10,933
|
|
10,933
|
|
|
|
10,933
|
|
10,933
|
|
10,933
|
|
10,933
|
|
|
|
|
Other assets
|
|
|
|
92,833
|
|
92,518
|
|
91,326
|
|
69,483
|
|
|
|
69,483
|
|
69,483
|
|
69,483
|
|
69,483
|
|
|
|
69,483
|
|
69,483
|
|
69,483
|
|
69,483
|
|
|
|
|
Total
assets
|
|
|
|
416,078
|
|
426,269
|
|
436,963
|
|
450,295
|
|
|
|
410,588
|
|
421,268
|
|
425,090
|
|
436,008
|
|
|
|
440,042
|
|
459,026
|
|
471,014
|
|
487,855
|
|
|
|
|
Current
liabilities:
|
|
|
|
|
|
|
|
|
|
|
|
|
|
|
|
|
|
|
|
|
|
|
|
|
|
|
|
|
|
|
|
|
|
|
Accounts payable
|
|
|
|
52,441
|
|
53,391
|
|
51,802
|
|
48,950
|
|
|
|
44,405
|
|
47,483
|
|
46,924
|
|
48,829
|
|
|
|
44,586
|
|
47,709
|
|
47,106
|
|
49,156
|
|
|
|
|
Accrued compensation and
benefits
|
|
|
|
25,771
|
|
28,390
|
|
29,417
|
|
26,684
|
|
|
|
24,867
|
|
26,591
|
|
26,278
|
|
26,292
|
|
|
|
26,008
|
|
27,830
|
|
27,479
|
|
27,527
|
|
|
|
|
Billings in excess of
costs and estimated earnings
|
|
|
|
37,461
|
|
33,151
|
|
33,836
|
|
19,676
|
|
|
|
18,649
|
|
20,026
|
|
19,872
|
|
20,101
|
|
|
|
17,364
|
|
18,659
|
|
18,499
|
|
18,734
|
|
|
|
|
Notes payable &
other (cap. lease obligations)
|
|
|
|
1,643
|
|
1,238
|
|
830
|
|
417
|
|
|
|
417
|
|
417
|
|
417
|
|
417
|
|
|
|
417
|
|
417
|
|
417
|
|
417
|
|
|
|
|
Income taxes payable
|
|
|
|
—
|
|
—
|
|
—
|
|
4,011
|
|
|
|
4,011
|
|
4,011
|
|
4,011
|
|
4,011
|
|
|
|
4,011
|
|
4,011
|
|
4,011
|
|
4,011
|
|
|
|
|
Deferred taxes
|
|
|
|
2,675
|
|
998
|
|
1,237
|
|
64,919
|
|
|
|
24,919
|
|
24,919
|
|
24,919
|
|
24,919
|
|
|
|
24,919
|
|
24,919
|
|
24,919
|
|
24,919
|
|
|
|
|
S corporation
distribution payable
|
|
|
|
—
|
|
—
|
|
—
|
|
—
|
|
|
|
—
|
|
—
|
|
—
|
|
—
|
|
|
|
—
|
|
—
|
|
—
|
|
—
|
|
|
|
|
Total
current liabilities
|
|
|
|
119,991
|
|
117,168
|
|
117,122
|
|
164,657
|
|
|
|
117,268
|
|
123,448
|
|
122,421
|
|
124,569
|
|
|
|
117,305
|
|
123,544
|
|
122,431
|
|
124,764
|
|
|
|
|
Long-term debt
|
|
|
|
—
|
|
—
|
|
—
|
|
—
|
|
|
|
—
|
|
—
|
|
—
|
|
—
|
|
|
|
—
|
|
—
|
|
—
|
|
—
|
|
|
|
|
Deferred taxes
|
|
|
|
11,202
|
|
12,752
|
|
11,810
|
|
1,617
|
|
|
|
1,617
|
|
1,617
|
|
1,617
|
|
1,617
|
|
|
|
1,617
|
|
1,617
|
|
1,617
|
|
1,617
|
|
|
|
|
Other liabilities
|
|
|
|
12,319
|
|
11,470
|
|
10,996
|
|
8,315
|
|
|
|
8,315
|
|
8,315
|
|
8,315
|
|
8,315
|
|
|
|
8,315
|
|
8,315
|
|
8,315
|
|
8,315
|
|
|
|
|
Total
liabilities
|
|
|
|
143,512
|
|
141,390
|
|
139,928
|
|
174,589
|
|
|
|
127,200
|
|
133,380
|
|
132,353
|
|
134,501
|
|
|
|
127,237
|
|
133,476
|
|
132,363
|
|
134,696
|
|
|
|
|
Redeemable common stock
|
|
|
|
—
|
|
—
|
|
—
|
|
—
|
|
|
|
—
|
|
—
|
|
—
|
|
—
|
|
|
|
—
|
|
—
|
|
—
|
|
—
|
|
|
|
|
Common stock
|
|
|
|
—
|
|
—
|
|
—
|
|
—
|
|
|
|
—
|
|
—
|
|
—
|
|
—
|
|
|
|
—
|
|
—
|
|
—
|
|
—
|
|
|
|
|
Additional paid-in
capital
|
|
|
|
31,976
|
|
36,514
|
|
39,130
|
|
39,220
|
|
|
|
35,975
|
|
28,212
|
|
20,450
|
|
15,275
|
|
|
|
15,275
|
|
15,275
|
|
15,275
|
|
15,275
|
|
|
|
|
Retained earnings
|
|
|
|
240,590
|
|
248,365
|
|
257,905
|
|
236,486
|
|
|
|
247,414
|
|
259,677
|
|
272,288
|
|
286,232
|
|
|
|
297,530
|
|
310,275
|
|
323,376
|
|
337,885
|
|
|
|
|
Total
stockholders’ equity
|
|
|
|
272,566
|
|
284,879
|
|
297,035
|
|
275,706
|
|
|
|
283,389
|
|
287,889
|
|
292,738
|
|
301,506
|
|
|
|
312,805
|
|
325,550
|
|
338,651
|
|
353,159
|
|
|
|
|
Total
liab & stockholders’ equity
|
|
|
|
416,078
|
|
426,269
|
|
436,963
|
|
450,295
|
|
|
|
410,588
|
|
421,268
|
|
425,090
|
|
436,008
|
|
|
|
440,042
|
|
459,026
|
|
471,014
|
|
487,855
|
|
|
|
|
|
|
|
|
|
|
|
|
|
|
68.7
|
%
|
|
|
|
|
|
|
|
|
|
|
|
|
|
|
|
|
|
|
|
|
|
|
|
|
|
|
|
|
|
|
|
|
|
|
|
|
|
|
|
|
|
|
|
|
|
|
|
|
|
|
|
|
|
|
|
|
|
|
Cash Flow Statement
|
|
FY07
|
|
1Q08
|
|
2Q08
|
|
3Q08
|
|
4Q08
|
|
FY08
|
|
1Q09E
|
|
2Q09E
|
|
3Q09E
|
|
4Q09E
|
|
FY09E
|
|
1Q10E
|
|
2Q10E
|
|
3Q10E
|
|
4Q10E
|
|
FY10E
|
|
|
Cash flows from
operating activities
|
|
|
|
|
|
|
|
|
|
|
|
|
|
|
|
|
|
|
|
|
|
|
|
|
|
|
|
|
|
|
|
|
|
|
Net income
|
|
$
|
(8,255
|
)
|
$
|
10,605
|
|
$
|
9,627
|
|
$
|
11,405
|
|
$
|
(24,960
|
)
|
$
|
6,677
|
|
$
|
11,929
|
|
$
|
13,238
|
|
$
|
13,560
|
|
$
|
14,876
|
|
$
|
53,602
|
|
$
|
12,235
|
|
$
|
13,687
|
|
$
|
14,048
|
|
$
|
15,460
|
|
$
|
55,430
|
|
|
Deferred taxes
|
|
|
|
4,195
|
|
3,327
|
|
(1,707
|
)
|
(26,015
|
)
|
|
|
(27,500
|
)
|
—
|
|
—
|
|
—
|
|
|
|
—
|
|
—
|
|
—
|
|
—
|
|
|
|
|
Depreciation and
amortization
|
|
|
|
5,039
|
|
4,799
|
|
4,271
|
|
(1,581
|
)
|
|
|
2,600
|
|
2,600
|
|
2,600
|
|
2,600
|
|
|
|
2,600
|
|
2,600
|
|
2,600
|
|
2,600
|
|
|
|
|
Other
|
|
|
|
3,600
|
|
2,154
|
|
(4,588
|
)
|
33,370
|
|
|
|
800
|
|
800
|
|
800
|
|
800
|
|
|
|
800
|
|
800
|
|
800
|
|
800
|
|
|
|
|
Funds
from operations
|
|
|
|
23,439
|
|
19,907
|
|
9,381
|
|
(19,186
|
)
|
|
|
(12,171
|
)
|
16,638
|
|
16,960
|
|
18,276
|
|
|
|
15,635
|
|
17,087
|
|
17,448
|
|
18,860
|
|
|
|
|
(Increase) decrease in
A/R
|
|
|
|
13,695
|
|
(3,425
|
)
|
(4,101
|
)
|
(2,026
|
)
|
|
|
17,317
|
|
(6,098
|
)
|
(3,335
|
)
|
(5,690
|
)
|
|
|
12,472
|
|
(6,283
|
)
|
(3,388
|
)
|
(6,055
|
)
|
|
|
|
(Increase) decrease in
excess costs and earnings
|
|
|
|
(7,571
|
)
|
(2,543
|
)
|
2,593
|
|
19,026
|
|
|
|
(9,127
|
)
|
(2,942
|
)
|
(1,791
|
)
|
(2,661
|
)
|
|
|
5,706
|
|
(3,096
|
)
|
(1,828
|
)
|
(2,830
|
)
|
|
|
|
(Increase) decrease in
prepaid other c/a
|
|
|
|
1,471
|
|
(8,031
|
)
|
4,070
|
|
1,434
|
|
|
|
—
|
|
—
|
|
—
|
|
—
|
|
|
|
—
|
|
—
|
|
—
|
|
—
|
|
|
|
|
(Increase) decrease in
other assets
|
|
|
|
—
|
|
—
|
|
—
|
|
—
|
|
|
|
—
|
|
—
|
|
—
|
|
—
|
|
|
|
—
|
|
—
|
|
—
|
|
—
|
|
|
|
|
Increase (decrease) in
compensation
|
|
|
|
(3,678
|
)
|
2,619
|
|
1,027
|
|
(2,733
|
)
|
|
|
(1,817
|
)
|
1,724
|
|
(313
|
)
|
15
|
|
|
|
(284
|
)
|
1,822
|
|
(351
|
)
|
48
|
|
|
|
|
Increase (decrease) in
A/P
|
|
|
|
(1,984
|
)
|
950
|
|
(1,589
|
)
|
(2,852
|
)
|
|
|
(4,545
|
)
|
3,078
|
|
(559
|
)
|
1,904
|
|
|
|
(4,243
|
)
|
3,123
|
|
(602
|
)
|
2,049
|
|
|
|
|
Increase (decrease) in
income tax payable
|
|
|
|
—
|
|
—
|
|
—
|
|
4,011
|
|
|
|
—
|
|
—
|
|
—
|
|
—
|
|
|
|
—
|
|
—
|
|
—
|
|
—
|
|
|
|
|
Increase (decrease) in
excess billings
|
|
|
|
(680
|
)
|
(2,871
|
)
|
1,523
|
|
(14,049
|
)
|
|
|
(1,027
|
)
|
1,378
|
|
(155
|
)
|
230
|
|
|
|
(2,737
|
)
|
1,295
|
|
(160
|
)
|
236
|
|
|
|
|
Increase (decrease) in
other liabilities
|
|
|
|
2,176
|
|
(849
|
)
|
(474
|
)
|
(2,681
|
)
|
|
|
—
|
|
—
|
|
—
|
|
—
|
|
|
|
—
|
|
—
|
|
—
|
|
—
|
|
|
|
|
Other changes to working
capital (plug)
|
|
|
|
(6,079
|
)
|
(1,253
|
)
|
369
|
|
37,537
|
|
|
|
—
|
|
—
|
|
—
|
|
—
|
|
|
|
—
|
|
—
|
|
—
|
|
—
|
|
|
|
|
Working
capital changes
|
|
|
|
(2,650
|
)
|
(15,403
|
)
|
3,418
|
|
37,667
|
|
|
|
801
|
|
(2,860
|
)
|
(6,153
|
)
|
(6,203
|
)
|
|
|
10,913
|
|
(3,139
|
)
|
(6,330
|
)
|
(6,553
|
)
|
|
|
|
Net
cash provided by operating activities
|
|
51,190
|
|
20,789
|
|
4,504
|
|
12,799
|
|
18,481
|
|
56,573
|
|
(11,370
|
)
|
13,777
|
|
10,807
|
|
12,073
|
|
25,287
|
|
26,548
|
|
13,948
|
|
11,118
|
|
12,308
|
|
63,921
|
|
|
Capital expenditures,
net
|
|
(17,893
|
)
|
(4,083
|
)
|
(3,055
|
)
|
(6,730
|
)
|
(1,581
|
)
|
(15,449
|
)
|
(4,480
|
)
|
(4,811
|
)
|
(4,774
|
)
|
(4,829
|
)
|
(18,894
|
)
|
(4,670
|
)
|
(5,018
|
)
|
(4,975
|
)
|
(5,038
|
)
|
(19,702
|
)
|
|
% of revenue
|
|
2.4
|
%
|
2.0
|
%
|
1.5
|
%
|
3.3
|
%
|
0.8
|
%
|
1.9
|
%
|
2.5
|
%
|
2.5
|
%
|
2.5
|
%
|
2.5
|
%
|
2.5
|
%
|
2.5
|
%
|
2.5
|
%
|
2.5
|
%
|
2.5
|
%
|
2.5
|
%
|
|
Acquisitions
|
|
|
|
—
|
|
—
|
|
10,572
|
|
29,885
|
|
|
|
—
|
|
—
|
|
—
|
|
—
|
|
|
|
—
|
|
—
|
|
—
|
|
—
|
|
|
|
|
Other investing
activities (plug)
|
|
|
|
—
|
|
—
|
|
59
|
|
(2,815
|
)
|
|
|
(2,967
|
)
|
—
|
|
—
|
|
—
|
|
|
|
—
|
|
—
|
|
—
|
|
—
|
|
|
|
|
Net
cash used by investing activities
|
|
|
|
(4,083
|
)
|
(3,053
|
)
|
3,901
|
|
25,489
|
|
|
|
(7,447
|
)
|
(4,811
|
)
|
(4,774
|
)
|
(4,829
|
)
|
|
|
(4,670
|
)
|
(5,018
|
)
|
(4,975
|
)
|
(5,038
|
)
|
|
|
|
Free
Cash Flow (excluding acquisitions)
|
|
33,297
|
|
16,706
|
|
1,449
|
|
6,069
|
|
16,900
|
|
41,124
|
|
(15,850
|
)
|
8,967
|
|
6,033
|
|
7,244
|
|
6,394
|
|
21,879
|
|
8,929
|
|
6,143
|
|
7,269
|
|
44,220
|
|
|
% of net income
|
|
-403.4
|
%
|
|
|
|
|
|
|
|
|
145.4
|
%
|
|
|
|
|
|
|
|
|
11.9
|
%
|
|
|
|
|
|
|
|
|
79.8
|
%
|
|
Increase (decrease) in
debt
|
|
|
|
(401
|
)
|
(404
|
)
|
(408
|
)
|
(414
|
)
|
|
|
—
|
|
—
|
|
—
|
|
—
|
|
|
|
—
|
|
—
|
|
—
|
|
—
|
|
|
|
|
Increase (decrease) in
equity
|
|
|
|
(148,733
|
)
|
2,195
|
|
97
|
|
990
|
|
|
|
(3,246
|
)
|
(7,763
|
)
|
(7,763
|
)
|
(5,175
|
)
|
|
|
—
|
|
—
|
|
—
|
|
—
|
|
|
|
|
Other financing
activities (incl. dividend)
|
|
|
|
(1,925
|
)
|
(2,149
|
)
|
(1,865
|
)
|
(1,860
|
)
|
|
|
(1,801
|
)
|
(1,775
|
)
|
(1,749
|
)
|
(1,732
|
)
|
|
|
(1,737
|
)
|
(1,742
|
)
|
(1,747
|
)
|
(1,752
|
)
|
|
|
|
Net
cash provided from financing activities
|
|
|
|
(151,059
|
)
|
(358
|
)
|
(2,176
|
)
|
(1,284
|
)
|
|
|
(5,046
|
)
|
(9,537
|
)
|
(9,512
|
)
|
(6,907
|
)
|
|
|
(1,737
|
)
|
(1,742
|
)
|
(1,747
|
)
|
(1,752
|
)
|
|
|
|
Net increase (decrease)
in cash and cash equivalents
|
|
38,635
|
|
(134,353
|
)
|
1,093
|
|
14,524
|
|
42,686
|
|
(76,050
|
)
|
(23,863
|
)
|
(571
|
)
|
(3,478
|
)
|
337
|
|
(27,575
|
)
|
20,142
|
|
7,188
|
|
4,396
|
|
5,517
|
|
37,243
|
|
|
|
|
|
|
|
|
|
|
|
|
|
|
|
|
|
|
|
|
|
|
|
|
|
|
|
|
|
|
|
|
|
|
|
|
|
|
|
|
|
|
|
|
|
|
|
|
|
|
|
|
Source: Maximus, Inc. and Stifel Nicolaus estimates
10
|
Commercial IT Services Companies
|
|
Stifel, Nicolaus & Company, Inc.
|
Valuation Data:
($ in
millions, except per share data)
|
|
|
|
|
|
|
|
|
|
|
|
|
|
|
|
|
|
|
|
|
|
|
|
|
|
|
|
|
|
|
|
|
|
|
|
|
|
|
|
|
|
|
|
|
|
|
|
|
|
|
|
|
Equity
|
|
Price/Earnings Ratio
|
|
PE/Growth (PEG)
|
|
Enterprise
|
|
Enterprise Value/
|
|
Cash Flow
|
|
|
|
|
|
|
Price
|
|
Annual
|
|
Annual
|
|
Market
|
|
CY
|
|
CY
|
|
CY
|
|
CY
|
|
Market
|
|
Trailing Twelve Months
|
|
Enterprise Value/
|
|
CY09 FCF
|
|
|
Ticker
|
|
Company
|
|
12/15/2008
|
|
High
|
|
Low
|
|
Value
|
|
2008
|
|
2009
|
|
2008
|
|
2009
|
|
Value
|
|
Revenue
|
|
EBIT
|
|
EBITDA
|
|
TTM FCF
|
|
CY08 FCF
|
|
CY09 FCF
|
|
Yield
|
|
|
ACN
|
|
Accenture, Ltd. (1) (3)
|
|
$
|
28.48
|
|
$
|
43.04
|
|
$
|
24.76
|
|
$
|
23,067
|
|
10.3x
|
|
10.0x
|
|
0.3
|
|
2.7
|
|
$
|
19,452
|
|
0.77x
|
|
6.4x
|
|
5.5x
|
|
7.8x
|
|
7.6x
|
|
7.8x
|
|
11.6
|
%
|
|
ACS
|
|
Affiliated Comp. Services, Inc. (1) (7)
|
|
39.16
|
|
57.40
|
|
34.84
|
|
3,841
|
|
10.7
|
|
9.6
|
|
1.3
|
|
0.9
|
|
5,777
|
|
0.92
|
|
8.2
|
|
5.3
|
|
10.1
|
|
12.2
|
|
13.2
|
|
11.3
|
|
|
CBR
|
|
CIBER, Inc. (1)
|
|
4.02
|
|
8.97
|
|
2.95
|
|
242
|
|
7.4
|
|
7.3
|
|
0.5
|
|
3.3
|
|
385
|
|
0.32
|
|
6.5
|
|
4.9
|
|
8.0
|
|
6.8
|
|
11.3
|
|
13.9
|
|
|
CSC
|
|
CSC (1) (5)
|
|
31.31
|
|
50.52
|
|
23.93
|
|
4,794
|
|
7.9
|
|
7.3
|
|
Neg
|
|
0.9
|
|
7,825
|
|
0.45
|
|
6.5
|
|
3.1
|
|
7.9
|
|
11.5
|
|
12.2
|
|
13.2
|
|
|
DTPI
|
|
Diamond Mgmt. & Tech. Consultants
(1) (6)
|
|
4.02
|
|
7.45
|
|
1.84
|
|
106
|
|
NM
|
|
NM
|
|
NM
|
|
NM
|
|
59
|
|
0.31
|
|
9.7
|
|
7.5
|
|
Neg
|
|
Neg
|
|
Neg
|
|
Neg
|
|
|
HCKT
|
|
The Hackett Group, Inc.
|
|
2.67
|
|
6.65
|
|
2.07
|
|
111
|
|
8.3
|
|
7.4
|
|
0.1
|
|
0.1
|
|
85
|
|
0.45
|
|
5.1
|
|
4.3
|
|
3.8
|
|
NE
|
|
NE
|
|
NE
|
|
|
HEW
|
|
Hewitt Associates Inc. (1) (4)
|
|
26.57
|
|
43.00
|
|
22.78
|
|
2,608
|
|
13.2
|
|
10.4
|
|
0.6
|
|
0.4
|
|
2,868
|
|
0.89
|
|
9.3
|
|
5.7
|
|
13.6
|
|
15.3
|
|
11.2
|
|
9.8
|
|
|
MMS
|
|
Maximus, Inc. (1) (9)
|
|
33.96
|
|
45.07
|
|
25.94
|
|
630
|
|
11.6
|
|
11.0
|
|
0.3
|
|
2.1
|
|
509
|
|
0.68
|
|
5.9
|
|
5.2
|
|
14.0
|
|
59.4
|
|
11.5
|
|
7.4
|
|
|
NSTC
|
|
Ness Technologies, Inc. (1)
|
|
4.25
|
|
13.00
|
|
3.54
|
|
169
|
|
4.4
|
|
4.9
|
|
0.0
|
|
Neg
|
|
177
|
|
0.27
|
|
5.0
|
|
3.3
|
|
8.6
|
|
NE
|
|
NE
|
|
NE
|
|
|
PER
|
|
Perot Systems Corp. (1) (8)
|
|
12.43
|
|
18.82
|
|
10.71
|
|
1,524
|
|
12.8
|
|
11.9
|
|
0.5
|
|
1.6
|
|
1,459
|
|
0.52
|
|
8.0
|
|
4.9
|
|
8.4
|
|
10.3
|
|
12.0
|
|
8.0
|
|
|
PRFT
|
|
Perficient, Inc.
|
|
4.86
|
|
17.08
|
|
2.31
|
|
148
|
|
6.7
|
|
6.8
|
|
Neg
|
|
Neg
|
|
132
|
|
0.56
|
|
5.6
|
|
4.3
|
|
5.6
|
|
NE
|
|
NE
|
|
NE
|
|
|
UIS
|
|
Unisys Corp. (10)
|
|
0.59
|
|
5.11
|
|
0.38
|
|
213
|
|
Neg
|
|
4.5
|
|
Neg
|
|
Neg
|
|
781
|
|
0.14
|
|
4.9
|
|
1.2
|
*
|
4.7
|
|
NE
|
|
NE
|
|
NE
|
|
|
|
|
Mean:
|
|
|
|
|
|
|
|
Total
|
|
9.3x
|
|
8.3x
|
|
0.4x
|
|
1.5x
|
|
Total
|
|
0.52x
|
|
6.8x
|
|
4.6x
|
|
8.4x
|
|
17.6x
|
|
11.3x
|
|
10.7
|
%
|
|
|
|
Median:
|
|
|
|
|
|
|
|
$
|
37,454
|
|
9.3
|
|
7.4
|
|
0.4
|
|
1.2
|
|
$
|
39,509
|
|
0.48
|
|
6.5
|
|
4.9
|
|
8.0
|
|
11.5
|
|
11.5
|
|
11.3
|
|
|
|
|
Mean: (Larger Caps) (2)
|
|
|
|
|
|
|
|
|
|
11.0x
|
|
9.8x
|
|
0.7x
|
|
1.3x
|
|
|
|
0.71x
|
|
7.7x
|
|
4.9x
|
|
9.6x
|
|
11.4x
|
|
11.3x
|
|
10.8
|
%
|
|
|
|
Median: (Larger Caps) (2)
|
|
|
|
|
|
|
|
|
|
10.7
|
|
10.0
|
|
0.6
|
|
0.9
|
|
|
|
0.77
|
|
8.0
|
|
5.3
|
|
8.4
|
|
11.5
|
|
12.0
|
|
11.3
|
|
|
|
|
|
|
|
|
|
|
|
|
|
|
|
|
|
|
|
|
|
|
|
|
|
|
|
|
|
|
|
|
|
|
|
|
|
|
|
|
|
|
|
|
|
|
|
|
|
|
|
|
|
|
|
|
|
|
|
|
|
|
|
|
|
|
|
|
|
|
|
|
|
|
|
|
|
|
|
|
|
|
Financial Data:
($ in
millions)
|
|
|
|
|
|
|
|
|
|
|
|
|
|
|
|
|
|
|
|
|
|
|
|
|
|
|
|
|
|
|
|
|
|
|
|
|
|
|
|
|
|
|
|
|
|
|
|
|
|
|
|
|
|
|
|
|
|
Balance Sheet Data
|
|
|
|
|
|
|
|
|
|
|
|
|
|
|
|
|
|
|
|
|
|
|
Trailing Twelve Months
|
|
|
|
Goodwill
|
|
Total
|
|
TTM Capex/
|
|
|
|
|
|
|
|
Returns
|
|
|
|
|
|
|
TTM
|
|
Revenue/EPS Growth
|
|
Gross
|
|
|
|
|
|
Net
|
|
Cash
|
|
as % of
|
|
Debt/
|
|
TTM
|
|
Total
|
|
LQA Rev. per
|
|
|
|
TTM
|
|
CY09
|
|
|
Ticker
|
|
Company
|
|
Revenue
|
|
CY08
|
|
CY09
|
|
Margin
|
|
EBIT
|
|
EBITDA
|
|
Income
|
|
Balance
|
|
Total Assets
|
|
Total Capital
|
|
Revenue
|
|
Employees
|
|
Employee
|
|
DSO
|
|
ROE/ROIC
|
|
ROE/ROIC
|
|
|
ACN
|
|
Accenture, Ltd.
(1) (3)
|
|
$
|
25,313.8
|
|
15.1 / 31.5
|
%
|
-1.8 / 3.6
|
%
|
28.4
|
%
|
12.0
|
%
|
13.9
|
%
|
8.3
|
%
|
$
|
3,623.0
|
|
6.7
|
%
|
0.3
|
%
|
1.3
|
%
|
186,805
|
|
140,490
|
|
62
|
|
74.7 / 72.5
|
%
|
101.9 / 78.4
|
%
|
|
ACS
|
|
Affiliated Comp.
Services, Inc. (1) (7)
|
|
6,271.9
|
|
7.2 / 8.4
|
|
6.9 / 10.9
|
|
53.5
|
|
11.2
|
|
17.4
|
|
5.7
|
|
434.8
|
|
49.5
|
|
50.0
|
|
4.9
|
|
63,000
|
|
101,870
|
|
80
|
|
15.6 / 10.4
|
|
15.0 / 11.3
|
|
|
CBR
|
|
CIBER, Inc. (1)
|
|
1,201.5
|
|
11.9 / 15.4
|
|
0.7 / 2.2
|
|
27.1
|
|
4.9
|
|
6.5
|
|
2.6
|
|
39.3
|
|
56.2
|
|
28.2
|
|
1.3
|
|
8,500
|
|
141,161
|
|
80
|
|
6.7 / 6.1
|
|
6.8 / 6.3
|
|
|
CSC
|
|
CSC (1) (5)
|
|
17,320.7
|
|
8.0 / -0.2
|
|
-21.0 / 8.2
|
|
20.3
|
|
6.9
|
|
14.5
|
|
3.7
|
|
741.6
|
|
25.5
|
|
39.7
|
|
4.5
|
|
91,000
|
|
186,316
|
|
92
|
|
11.5 / 8.0
|
|
10.7 / 8.1
|
|
|
DTPI
|
|
Diamond Mgmt. &
Tech. Consultants (1) (6)
|
|
190.0
|
|
-11.4 / -95.8
|
|
-1.6 / NM
|
|
31.1
|
|
3.2
|
|
4.1
|
|
1.5
|
|
47.1
|
|
0.0
|
|
0.0
|
|
1.4
|
|
582
|
|
278,392
|
|
34
|
|
3.9 / 2.7
|
|
4.0 / 7.8
|
|
|
HCKT
|
|
The Hackett
Group, Inc.
|
|
188.2
|
|
7.6 / 88.2
|
|
5.0 / 12.5
|
|
41.4
|
|
8.8
|
|
10.4
|
|
9.3
|
|
26.1
|
|
49.3
|
|
0.0
|
|
1.0
|
|
747
|
|
269,922
|
|
59
|
|
17.9 / 13.4
|
|
NE
|
|
|
HEW
|
|
Hewitt Associates Inc.
(1) (4)
|
|
3,227.6
|
|
5.3 / 22.0
|
|
1.7 / 26.1
|
|
38.8
|
|
9.6
|
|
15.5
|
|
6.4
|
|
541.5
|
|
19.1
|
|
55.2
|
|
3.6
|
|
23,000
|
|
143,396
|
|
72
|
|
25.7 / 20.1
|
|
30.5 / 26.0
|
|
|
MMS
|
|
Maximus, Inc.
(1) (9)
|
|
745.1
|
|
0.7 / 45.7
|
|
-2.8 / 5.3
|
|
27.1
|
|
11.6
|
|
13.2
|
|
7.3
|
|
121.0
|
|
14.9
|
|
0.0
|
|
2.1
|
|
6,000
|
|
126,046
|
|
80
|
|
16.5 / 19.8
|
|
18.1 / 23.9
|
|
|
NSTC
|
|
Ness
Technologies, Inc. (1)
|
|
666.5
|
|
19.6 / 273.1
|
|
7.5 / -10.3
|
|
28.9
|
|
5.3
|
|
7.9
|
|
2.7
|
|
81.7
|
|
38.2
|
|
17.8
|
|
2.1
|
|
8,300
|
|
66,837
|
|
175
|
|
4.4 / 5.8
|
|
NE
|
|
|
PER
|
|
Perot Systems Corp.
(1) (8)
|
|
2,828.0
|
|
6.8 / 23.8
|
|
4.8 / 7.6
|
|
16.8
|
|
6.5
|
|
10.6
|
|
4.0
|
|
246.0
|
|
36.5
|
|
12.2
|
|
1.7
|
|
24,000
|
|
118,500
|
|
62
|
|
9.0 / 10.5
|
|
9.1 / 10.4
|
|
|
PRFT
|
|
Perficient, Inc.
|
|
237.1
|
|
5.9/ -6.4
|
|
-0.4 / -2.7
|
|
33.0
|
|
10.0
|
|
13.1
|
|
5.8
|
|
15.6
|
|
61.2
|
|
0.0
|
|
0.8
|
|
1,327
|
|
175,753
|
|
76
|
|
7.7 / 8.6
|
|
NE
|
|
|
UIS
|
|
Unisys Corp. (10)
|
|
5,489.4
|
|
-5.9 / -60.9
|
|
-4.5 / -244.4
|
|
23.9
|
|
2.9
|
|
11.8
|
|
(1.1
|
)
|
493.8
|
|
5.5
|
|
73.6
|
|
3.6
|
|
31,000
|
|
169,342
|
|
63
|
|
-15.1 / 11.0
|
|
NE
|
|
|
|
|
Mean:
|
|
Total
|
|
|
|
|
|
30.9
|
%
|
7.7
|
%
|
11.6
|
%
|
4.7
|
%
|
|
|
30.2
|
%
|
23.1
|
%
|
2.4
|
%
|
|
|
|
|
78
|
|
|
|
|
|
|
|
|
Median:
|
|
$
|
63,680
|
|
|
|
|
|
28.7
|
|
7.9
|
|
12.4
|
|
4.9
|
|
|
|
31.0
|
|
15.0
|
|
1.9
|
|
|
|
|
|
80
|
|
|
|
|
|
|
|
|
Mean (excl. negatives):
|
|
|
|
|
|
|
|
30.9
|
%
|
7.7
|
%
|
11.6
|
%
|
5.2
|
%
|
|
|
|
|
|
|
|
|
|
|
|
|
|
|
|
|
|
|
|
|
|
Median (excl. negatives):
|
|
|
|
|
|
|
|
28.7
|
|
7.9
|
|
12.4
|
|
5.7
|
|
|
|
|
|
|
|
|
|
|
|
|
|
|
|
|
|
|
|
|
|
|
|
|
|
|
|
|
|
|
|
|
|
|
|
|
|
|
|
|
|
|
|
|
|
|
|
|
|
|
|
|
|
|
|
|
|
|
Notes:
* Not included in mean and
median calculations
(1) Stifel Nicolaus
Research estimates.
(2) Includes ACN, ACS,
CSC, HEW, PER, and UIS.
(3) Accenture (ACN)
ROIC is GROSS of cash and investments.
(4) Hewitt TTM EBIT
and EBITDA exclude significant goodwill and asset impairment charges
(5) CSC net income
and FCF exclude restructuring and impairment charges.
(6) DTPI FCF
excludes ~$20M, based on management’s estimate of cash needed to repurchase
shares to offset dilutive equity comp.
(7) Affiliated Comp.
Services EBIT, EBITDA, and NI exclude one-time charges.
(8) PER TTM EBIT
and NI exclude the $46M TRIAD termination benefit and $18M restructuring charge
(9) MMS financials
are on continuing operations basis.
(10) Reflects C2Q08 data.
Unless otherwise noted, all
results reflect C3Q08 data.
Sources: Company
data, Bloomberg Financial Markets, First Call estimates, FactSet Research
Systems and Stifel Nicolaus Research estimates.
|
|
George A. Price, Jr.
|
Shlomo
H. Rosenbaum
|
|
Richard
M. Eskelsen
|
|
|
gaprice@stifel. com
|
shrosenbaum@stifel.
com
|
|
eskelsenr@stifel.
com
|
|
|
(443) 224-1323
|
(443)
224-1322
|
|
(443)
224-1366
|
11
Important Disclosures and Certifications
I,
George Price, certify that the views expressed in this research report
accurately reflect my personal views about the subject securities or issuers;
and I, George Price, certify that no part of my compensation was, is, or will
be directly or indirectly related to the specific recommendation or views
contained in this research report.
I,
Shlomo Rosenbaum, certify that the views expressed in this research report
accurately reflect my personal views about the subject securities or issuers;
and I, Shlomo Rosenbaum, certify that no part of my compensation was, is, or
will be directly or indirectly related to the specific recommendation or views
contained in this research report.
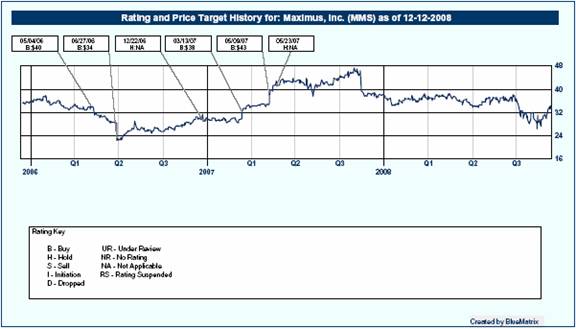
For
a price chart with our ratings and target price changes for MMS go to
http://sf.bluematrix.com/bluematrix/Disclosure?ticker=MMS
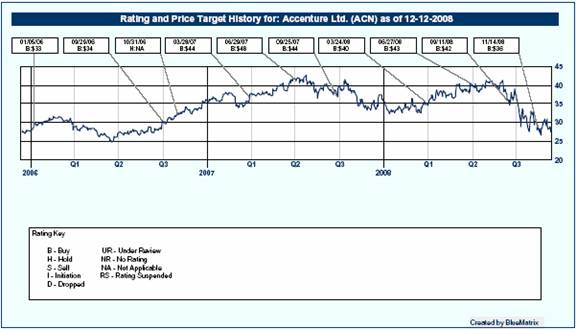
For
a price chart with our ratings and target price changes for ACN go to
http://sf.bluematrix.com/bluematrix/Disclosure?ticker=ACN
12
Maximus, Inc.
is a client of Stifel, Nicolaus & Company, Inc. or an affiliate
or was a client of Stifel Nicolaus or an affiliate within the past 12 months.
Maximus, Inc.
is provided with non-investment banking, securities related services by Stifel,
Nicolaus & Company, Inc. or an affiliate or was provided with
non-investment banking, securities related services by Stifel Nicolaus or an
affiliate within the past 12 months.
Stifel,
Nicolaus & Company, Inc. expects to receive or intends to seek
compensation for investment banking services from Maximus, Inc. in the next 3
months.
Stifel,
Nicolaus & Company, Inc. or an affiliate has received
compensation for non-investment banking, securities related services from
Maximus, Inc. in the past 12 months.
Stifel,
Nicolaus & Company, Inc.’s research analysts receive compensation
that is based upon (among other factors) Stifel Nicolaus’ overall investment
banking revenues.
Our
investment rating system is three tiered, defined as follows:
BUY
- -We expect this stock to outperform the S&P 500 by more than 10% over the
next 12 months. For higher-yielding equities such as REITs and Utilities, we
expect a total return in excess of 12% over the next 12 months.
HOLD
- -We expect this stock to perform within 10% (plus or minus) of the S&P 500
over the next 12 months. A Hold rating is also used for those higher-yielding
securities where we are comfortable with the safety of the dividend, but
believe that upside in the share price is limited.
SELL
- -We expect this stock to underperform the S&P 500 by more than 10% over the
next 12 months and believe the stock could decline in value.
Of
the securities we rate, 38% are rated Buy, 57% are rated Hold, and 5% are rated
Sell.
Within
the last 12 months, Stifel, Nicolaus & Company, Inc. or an
affiliate has provided investment banking services for 12%, 17% and 9% of the
companies whose shares are rated Buy, Hold and Sell, respectively.
Additional Disclosures
STIFEL
NICOLAUS ACTED AS FINANCIAL ADVISOR TO MAXIMUS, INC. IN CONNECTION WITH
ITS SALE OF ITS CORRECTIONS SERVICES BUSINESS TO PROVIDENCE SERVICE
CORPORATION.
STIFEL,
NICOLAUS & COMPANY, INC. PROVIDED FINANCIAL ADVISORY SERVICES TO
GESTALT, LLC IN CONNECTION WITH ITS PENDING ACQUISITION BY ACCENTURE LTD.
Please
visit the Research Page at www.stifel.com for the current research
disclosures applicable to the companies mentioned in this publication that are
within Stifel Nicolaus’ coverage universe. For a discussion of risks to target
price please see our stand-alone company reports and notes for all Buy-rated
stocks.
The
information contained herein has been prepared from sources believed to be
reliable but is not guaranteed by us and is not a complete summary or statement
of all available data, nor is it considered an offer to buy or sell any
securities referred to herein. Opinions expressed are subject to change without
notice and do not take into account the particular investment objectives,
financial situation or needs of individual investors. Employees of Stifel,
Nicolaus & Company, Inc. or its affiliates may, at times, release
written or oral commentary, technical analysis or trading strategies that
differ from the opinions expressed within.
Stifel,
Nicolaus & Company, Inc. is a multi-disciplined financial
services firm that regularly seeks investment banking assignments and
compensation from issuers for services including, but not limited to, acting as
an underwriter in an offering or financial advisor in a merger or acquisition,
or serving as a placement agent in private transactions. Moreover, Stifel
Nicolaus and its affiliates and their respective shareholders, directors,
officers and/or employees, may from time to time have long or short positions
in such securities or in options or other derivative instruments based thereon.
These
materials have been approved by Stifel Nicolaus Limited, authorized and
regulated by the Financial Services Authority (UK), in connection with its
distribution to professional clients and eligible counterparties in the
European Economic Area. (Stifel Nicolaus Limited home office: London +44 20
7557 6030.) No investments or services
13
mentioned
are available in the European Economic Area to retail clients or to anyone in
Canada other than a Designated Institution. This investment research report is
classified as objective for the purposes of the FSA rules. Please contact a
Stifel Nicolaus entity in your jurisdiction if you require additional
information.
Additional Information Is Available Upon Request
©
2008 Stifel, Nicolaus & Company, Inc. One South Street Baltimore,
MD 21202. All rights reserved.
14