MAXIMUS

11419 Sunset Hills Road

Reston VA 20190


June 18, 2010


United States Securities and Exchange Commission

Division of Corporate Finance — Mail Stop 3010

Washington DC 20549


Dear Ms. Monick,


In response to your letter of June 3, 2010, our responses are below.


In addition, we acknowledge that:


·

The Company is responsible for the adequacy and accuracy of the disclosure in the filing;

·

Staff comments or changes to disclosure in response to staff comments do not foreclose the Securities and Exchange Commission from taking any action with respect to the filing;

·

The Company may not assert staff comments as a defense in any proceeding initiated by the Securities and Exchange Commission or any person under the federal securities laws of the United States.


Note 13, Shareholders’ Equity


We note you corrected an error related to stock-based compensation expense.  Please tell us how you have complied with ASC 250.


We note your response to prior comment three and request that you provide us with a more robust analysis of materiality related to the $2.2 million stock-based compensation charge recorded during the first quarter of fiscal 2008.  In your response, please provide us with a thorough materiality analysis which is performed at the segment level and which addresses the impact to both income from continuing operations and net income.  Additionally, help us to understand what you, your investors and analysts were focusing on during the earnings calls during 2007 and 2008.  Please tell us if the focus was on earnings including or excluding these “unusual and infrequently occurring items.”  Your response should include excerpts from your earnings calls.  Finally, provide us with samples of analysts’ reports for 2007, 2008 and 2009 and be sure to provide samples from quarters that were most relevant to the $2.2 million adjustment.


1


Analysis of materiality


In providing a more robust analysis of the materiality of the charge, we will provide certain information from our previous submission for ease of review.


In correcting the stock based compensation in 2008, management considered the effect of the Stock-Based Compensation Adjustments (“SBC Adjustments”) on the financial results for 2006, 2007 and 2008, as well as the effects of the SBC Adjustments on the trend of earnings and other factors.  In performing this evaluation, management also considered the effects of the SBC Adjustments on the results as stated for the business as a whole.    The SBC Adjustments were recorded in the first quarter of fiscal year 2008.  The Company’s Systems segment was discontinued in the fourth quarter of fiscal 2008.  Since the correction occurred prior to the discontinued operations of the Systems segment, management based its judgment on materiality upon the financial information that existed prior to the financials being recast for discontinued operations.  Appendix 1 shows the SBC Adjustments by segment both before and after the discontinued operations recast the financial results.  In the appendices to this letter, we provide financial and segment analysis relative to the SBC Adjustments as if the Systems segment was not discontinued.  We have also provided the SBC Adjustments relative to continuing operations, which reflects the SBC Adjustments and segment information after the financials were recast for the discontinued operations.


In performing the evaluation, management concluded that the SBC Adjustments were not material to any of the periods affected.  This is true with or without the decision in fiscal year 2008 to discontinue the systems segment.


That evaluation included consideration of the guidance related to materiality included in ASC 250-10-S99 (SAB Topic 1.M).  In conjunction with that guidance, we considered both the quantitative and qualitative factors in concluding that the amounts were not material.


Quantitatively, we considered the following when reviewing the SBC Adjustments relative to consolidated results:


·                  We compared the SBC Adjustments to the revenue and income to determine materiality.  During the years affected by the SBC Adjustments, management and industry analysts adjusted income for certain unusual and infrequently occurring items.  Appendix 6 provides the components of these unusual and infrequent adjustments and operating income trends without these items.  The primary driver for the adjustments was the economic impact of an unfavorable contract with Accenture to provide services to the Texas HHSC.  This subcontract generated large losses and a write-off of deferred contract costs.  The Accenture subcontract was terminated during the second quarter of fiscal 2007 and became a legal matter.  The work performed under this subcontract was replaced with a new contract that the Company entered into directly with the State of Texas, which returned the operations to profitability in the third quarter of fiscal 2007.    The Accenture subcontract was a major driver of the legal and settlement expense.  The subcontract and its related litigation represented a significant contingency to the Company and was a major focus of industry analysis aside from the


2


Company’s core business operations.  In addition, during these years, the Company reached a large settlement with the Department of Justice and realized a gain on the sale of an owned office building.  These items were separately identified in their relevant periods, with their effects on operating income and EPS communicated to the public.  When management and industry analysts evaluated the Company’s performance and assessed its future prospects, it was done by adjusting income for these unusual and infrequently occurring items and then separately identifying and evaluating the Texas subcontract contingency.  Accordingly, in our analysis, we have adjusted income from continuing operations in each period to reflect these items.


·                  Prior to the problems under the Texas subcontract, the Company had never recorded a loss as a public company and had recorded net income in excess of $35 million in each of the five fiscal years prior to 2006.  Similarly, the Company returned to its previous high levels of profitability in fiscal 2009 and YTD fiscal 2010.  The SBC Adjustments as a percentage of historical results would also not be material.  Management’s adjustments for unusual and infrequent events, when adjusted out from net income, would show the Company recording levels of income consistent with those both prior to fiscal 2006 and subsequent to fiscal 2008.   For this reason, management considers this adjusted income to be a more appropriate basis for measuring materiality, based upon the focus of the analysts and investor community on the adjusted results.


·                  We compared the SBC Adjustments to the revenue and income of the business as recorded in 2006 and 2007 prior to the discontinued operations and to the 2008 financial results as they would have been stated if we did not recast our financials for discontinued operations. As noted above, at the time of the correction, these were the basis for management’s assessment of materiality.  This analysis of SBC Adjustments compared to financial results prior to recasting for the discontinued operations is provided in Appendix 2.  In no year do the SBC Adjustments exceed 0.3% of revenue, or 3.5% of adjusted income. Based upon this analysis, we do not consider the SBC Adjustments to be material.


·                  Management compared the SBC Adjustments to revenue, income from continuing operations and net income based upon the financial results of the business following discontinued operations at the end of 2008.  Those financial results were disclosed in our Annual Report on Form 10-K for the year ended September 30, 2008, filed with the SEC on December 15, 2008.  The analysis is summarized on Appendix 3.  In no year do the SBC Adjustments exceed 0.3% of revenue, or 3% of adjusted income from continuing operations.  In addition, the tax-effected SBC Adjustments never exceed 5% of net income. Based upon this analysis, we do not consider the SBC Adjustments to be material.


Quantitatively, we considered the following when reviewing the SBC Adjustments relative to segment results:


3


·                  The segment analysis at Appendix 4 is prepared as if we did not recast our financials for discontinued operations, consistent with the analysis provided at Appendix 2.  The segment analysis provided at Appendix 5 is prepared consistent with fiscal 2008 year-end financials that treat the systems segment as discontinued.  Appendix 5 is prepared on a basis consistent with Appendix 3.  When evaluating segment information, management concluded that the SBC Adjustments were not material to any of the periods affected.  This is true with or without the decision in fiscal year 2008 to discontinue the Systems segment.


·                  For all segments, relative to all years, the effects of the SBC Adjustments are less than 1% of revenue.  This calculation is shown at Appendixes 4 and 5.  Based upon this segment analysis, we do not consider the SBC Adjustments to be material.


·                  The Operations Segment is the dominant segment by either revenue or operating income measures.  The SBC Adjustments for this segment range between 1.0% and 2.1% of operating income adjusted for the Texas subcontract.  Based upon this segment analysis, we do not consider the SBC Adjustments to be material to the operating income for the Operations segment.


·                  In all years, the Systems segment recorded a loss and in certain periods operated at near-breakeven.  Accordingly, it would be inappropriate to use operating profit as a measure of materiality.  In no year do the SBC Adjustments change the loss to profit.  Based upon this segment analysis, we do not consider the SBC Adjustments to be material to the operating income for the Systems segment.  The Systems segment was discontinued in the fiscal year in which the correction was made.  Accordingly, it is included in discontinued operations and had no impact to continuing operations.


·      The impact the SBC Adjustments had on the Consulting segment in fiscal year 2007 was less than 5% of operating income and was immaterial.  For fiscal year 2006, prior to the recast detailed on Appendix 4, the effect of the SBC Adjustments would have been less than 5% of operating income.  Similarly, fiscal year 2008, prior to the recast, had an operating loss and is an inappropriate measure for materiality and the adjustment would not change the perception held by shareholders or the investment community that the segment results were marginal. Since the correction occurred prior to the discontinued operations of the Systems segment, management based its judgment on materiality upon financial information prior to the financials being recast.  The effect of the SBC Adjustments on Consulting segment profit margin after discontinuing the Systems segment would be to reduce fiscal 2006 margin by 0.3% to 3.9% and increase the fiscal 2008 margin by 0.6% to 1.8%.  Management believes that a reader of the financial statements will still view the SBC Adjustments as immaterial to the Consulting segment.  Based upon this segment analysis, we do not consider the SBC Adjustments to be material to the operating income for the Consulting segment.


As part of the qualitative analysis, we considered the following:


4


·                  The SBC Adjustments do not significantly change, or mask changes, in earnings or other trends at the consolidated or segment level.


·                  Analysts historically review results adjusted for certain items discussed above and the SBC Adjustments would not impact their assessments.


·                  The SBC Adjustments would not move the Company between income or loss in any periods affected.


·                  The SBC Adjustments do not affect any compliance matters, including compliance with debt covenants.


·                  The SBC Adjustments do not affect management compensation and represent a non-cash item.


·                  The SBC Adjustments do not represent any unlawful or fraudulent transactions.


Upon our conclusion that the amounts were not material, we considered the guidance of ASC 250-10-S99-3 related to immaterial adjustments.  The example in SAB Topic 5.F. states that, if an accounting change does not have a material impact in the financial statements, the cumulative effect of the change should be included in the income statement for the period in which the change is made.  In accordance with that guidance, the full amount of the change is reflected in the period in which it was made.


Finally, we note that the SBC Adjustments and their correction were fully and appropriately disclosed in the footnotes to our financial statements allowing the user of the statements complete transparency into our operating results.  In our Annual Reports on Form 10-K, the SBC Adjustments are disclosed in Note 13 (page 55 of the 2009 10-K and page 51 of the 2008 10-K) as well as within the MD&A (page 21 in 2009, page 20 in 2008).  In our Quarterly Reports on Form 10-Q for 2008, the SBC Adjustments are disclosed in the MD&A on page 15 of Q1 and Q2 and page 18 of Q3.


The focus of 2007 and 2008 earnings calls


During earnings calls and other communications to shareholders and analysts during 2007 and 2008, significant focus was placed upon the unusual and infrequently occurring items.  This information is of significant value to these parties in assessing the past performance of management and assessing the likely future prospects of the Company.  The breakdown of these charges (after-tax) was as follows:


5


2006


Q1


Q2


Q3


Q4


Total


Texas Contract


1,392


20,754


7,742


29,887


Legal and Settlement Expense


303


439


5,492


(550

)

5,683


2007


Q1


Q2


Q3


Q4


Total


Texas Contract


16,940


3,933


(5,627

)

15,246


Legal and Settlement Expense


1,815


3,691


19,965


1,414


26,885


2008


Q1


Q2


Q3


Q4


Total


Legal and Settlement Expense


563


423


22,221


23,207


Gain on Sale of Building


(2,382

)


(2,382

)

Goodwill impairment charge


4,598


4,598


2009


Q1


Q2


Q3


Q4


Total


Legal and Settlement Expense


(4,271

)


(4,271

)


·                  In all quarters in 2007 and in the latter quarters of 2006 and 2008, the Company included an analysis of “Supplemental Pro Forma Information” which adjusted the financial results of the Company from GAAP to an adjusted result excluding the effects of the Texas Project, Legal and Settlement Expense, the gain on sale of a Company building, and a goodwill write-off.  This was typically referred to as “adjusted” EPS or adjusted income before income taxes.


·                  During 2007, the Company frequently referred to “Base Operations” in press releases and earnings calls.  Base Operations was defined as the Company’s financial results, excluding losses on the Texas Project and legal expenses.  This term is also used by certain analysts in assessing the results of the business.


·                  A summary of this supplemental information by fiscal year is provided at Appendix 6.


Specific quarterly matters are noted below:


Second Quarter 2006 (March 31, 2006)


·                  The company’s earnings press release, issued on May 3, 2006  and filed as Exhibit 99.1 on Form 8-K on May 5, 2006, mentions losses in Texas and British Columbia.  In addition, the transcript of the subsequent conference call was filed as Exhibit 99.2 in the same Form 8-K.  The Texas subcontract is mentioned in both the press release and the call (“In the current quarter our Texas project lost $2.3 million and we expect losses to continue for the rest of the year” David Walker’s comments, p4 of transcript).


6


·                  The focus of the analysts Q&A and the subsequent analyst coverage made significant mention of the Texas subcontract.  During the call, a number of questions were asked by analysts with a clear view to the potential future impact of the Texas subcontract:


“If you look at the more conservative earnings, could you give us some sort of magnitude of what potentially could be Texas-related?”  Cynthia Houlton, RBC, p9 of transcript


“Can you comment on what gets capitalized versus what gets expensed and can you tell us how much you lost on the Texas business in this March quarter?”  Thatcher Thompson, CIBC, p10


“Could you maybe discuss a little more about when you talked about Texas?” Tom Meagher, Friedman Billings, p12


“You lost $2.3 million in the second quarter.  Now in your current guidance, do you expect those losses to stay at that same rate or double or can you quantify that for us?”  Bill Loomis, Stifel Nicolaus, p13


“I wanted to ask another question on Texas in terms of upcoming milestones that we should be focused on. … What are the next milestones that we should be keeping tabs on?”  Jason Kupferberg, UBS, p15


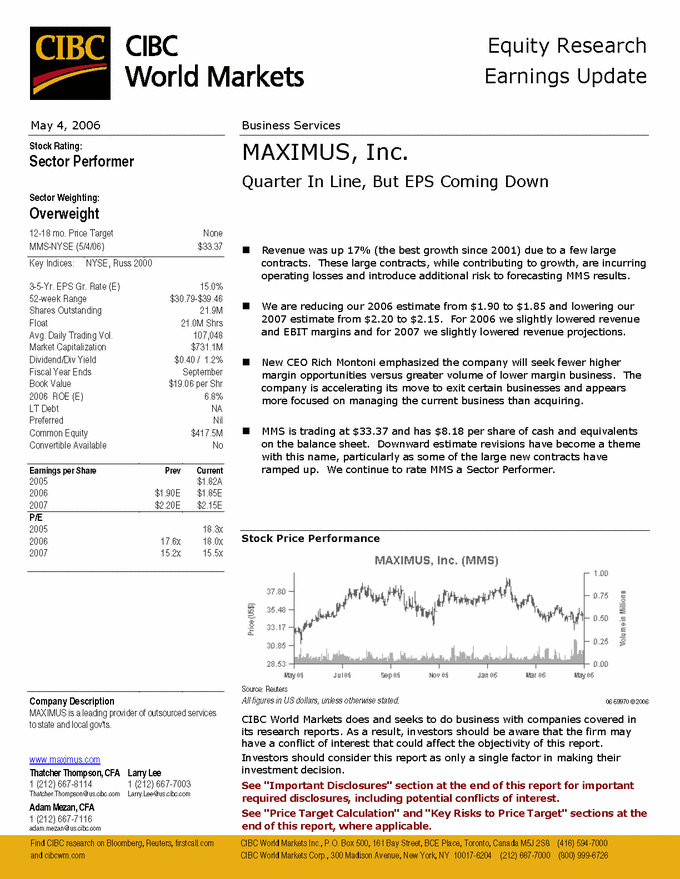
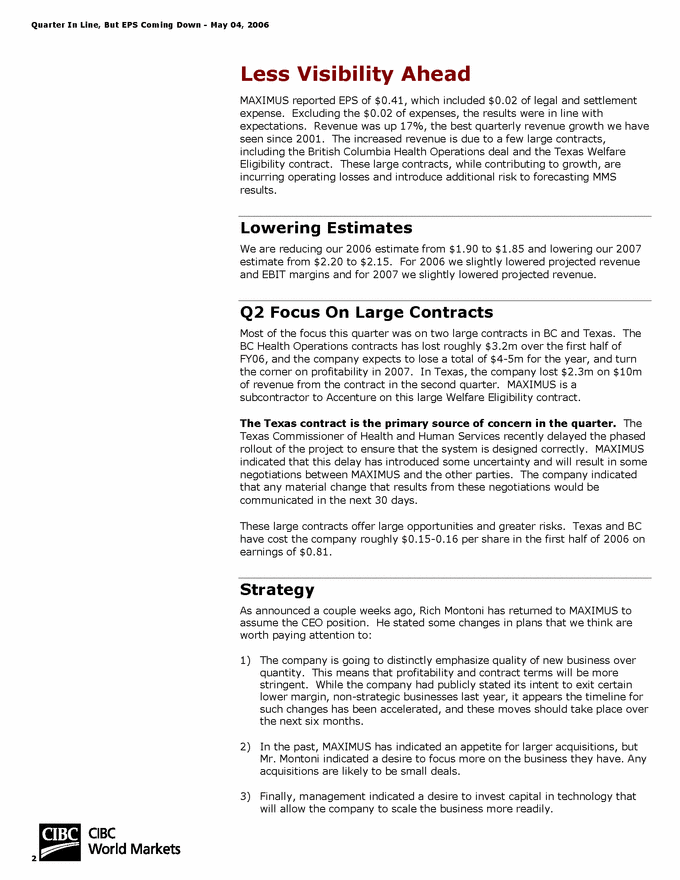
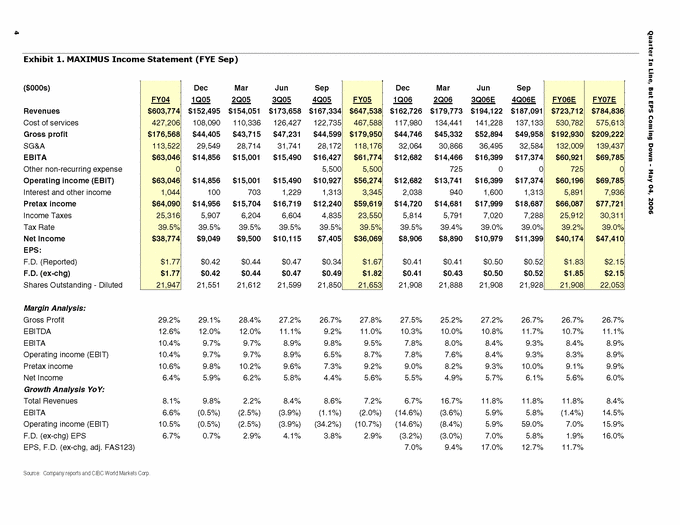
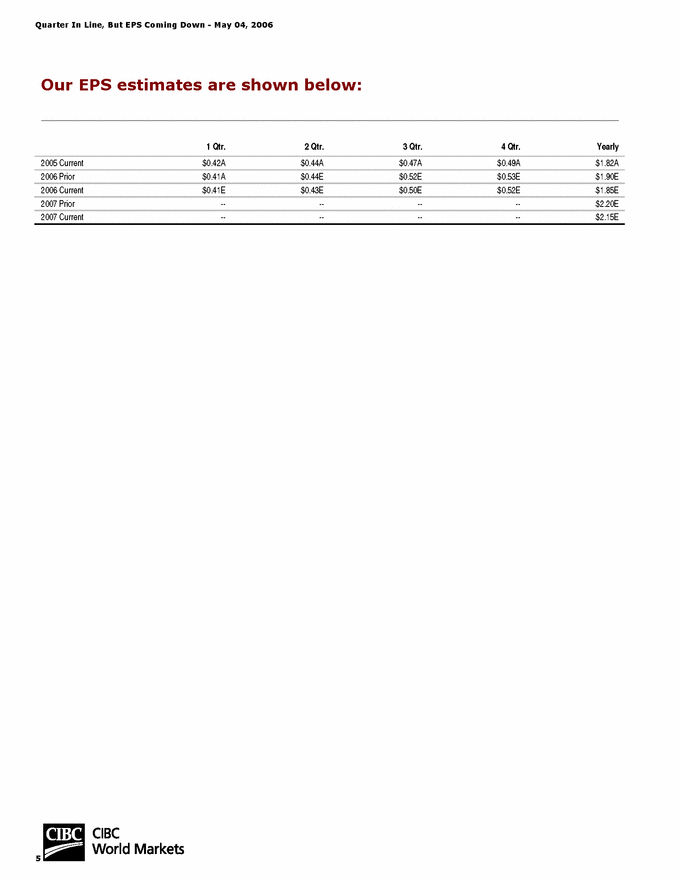
·                  At May 2006, the Company was aware of coverage from nine analysts — BB&T, CIBC, CJS Securities, FBR, Jefferies, KeyBanc, RBC, Stifel Nicolaus, and UBS.  These reports show a great deal of focus on large contracts, including Texas.  As an example, we have included an analyst report from CIBC from this period at Appendix 7.  We draw your attention to comments on the second page where the analyst notes


“Q2 Focus On Large Contracts


“In Texas, the Company lost $2.3m on $10m of revenue from the contract in the second quarter.  MAXIMUS is a subcontractor to Accenture on this large Welfare Eligibility contract.  The Texas contract is the primary cause of concern in this quarter.”


Other analysts also focus on the Texas subcontract, with CJS noting that “We remain at market perform as we want to see how the Texas contract unfolds.” And Jefferies stating “Investors may have to be patient while MAXIMUS works through the problems in the large Texas and BC contracts.”


It is clear from the analyst reports that the Texas subcontract was a matter of interest for that quarter and was expected to be of interest in future quarters.


·                  In the Company’s own quarterly report on Form 10-Q, the Texas subcontract was included as a factor in the Company’s results on page 14 of Management’s Discussion and Analysis.  The Texas subcontract was also included in the Company’s risk factors in Exhibit 99.1 to the Form 10-Q.


7


Third Quarter 2006 (June 30, 2006)


·                  On June 21, 2006, the Company signed an amended subcontract with Accenture, the prime contractor in the Texas contract.  As noted in a Form 8-K filed on June 27, this resulted in significant additional charges and anticipated losses for the remainder of the 2006 fiscal year, with some further losses anticipated in 2007.


·                  On June 27, 2006, the Company issued a press release and held a conference call open to the public which covered the financial impact of the amended subcontract, the history and background of the project and the work breakdown and realignment of scope.  The subsequent remarks by Richard Montoni, the Chief Executive Officer, anticipated a pre-tax loss of $35M-$38M for the third quarter, including $18M of deferred contract cost expense.  The call was attended by ten analysts, all representing different firms.  The attendance and questions asked on this call clearly indicate the level of focus on the Texas subcontract placed by the Company and its analysts.  The call transcript is included as an exhibit on the Form 8-K filed on June 27.


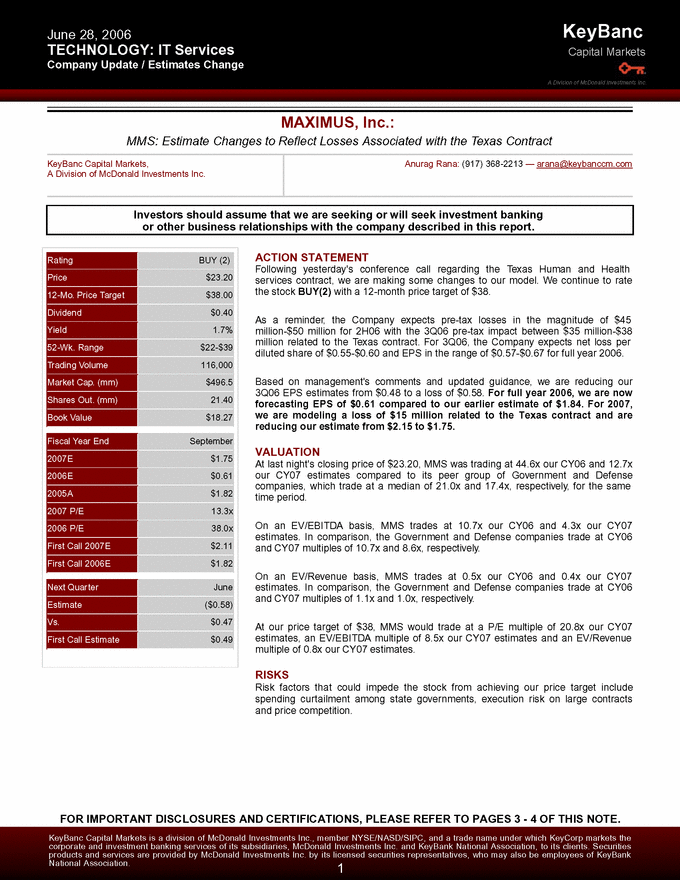
·                  A number of analysts covered this call.  By way of an example, we attach a copy of KeyBanc’s post-call comments as Appendix 8.  In it, they clearly demonstrate their focus on the Texas subcontract, noting “Based on management’s comments and updated guidance, we are reducing our 3Q06 estimates from $0.48 to a loss of $0.58.  For full year 2006, we are now forecasting EPS of $0.61 compared to our earlier estimate of $1.84.  For 2007, we are modeling a loss of $15 million related to the Texas contract and are reducing our [EPS estimates] from $2.15 to $1.75.”


·                  The company issued an earnings press release on August 2, 2006 (filed as Exhibit 99.1 on Form 8-K on August 7, 2006) and confirmed a loss of $34.3M pre-tax on the Texas subcontract and reiterated guidance on future expected losses.  In addition, litigation charges of $9.1M were also noted.  The three-month results were adjusted on the final page to show the pre-tax expense and EPS effects of the Texas project operating loss, the write-off of Texas deferred subcontract costs, and the litigation expense.


·                  In a subsequent call with analysts on August 3, 2006, the Company led with the legal settlement and Texas project results.


“Last night we reported financial results, which excluding the legal settlement of $9.1 million were in line with our revised expectations for the quarter and we remain on track for our updated full year guidance.  As outlined in our June 27th conference call we were expecting total third quarter losses on the Texas project to be in the range of 35 to $38 million [pre-tax].  The total third quarter booked loss on Texas was $34.3 million, of which $17.1 million related to the write-off of deferred contract costs, and the remaining $17.2 million was the project’s operating loss in the quarter.”


8


In questions that followed, there was an emphasis on results excluding Texas, as seen in these example questions from analysts:


“So you think this business, once you get back the Texas issues, and in terms of implementing your focus on the types of deals that you want to go after, you think you can basically grow at around 10% with a 10% all in, FAS 123 operating margin, or that’s the target?” George Price, Stifel Nicolaus


“I’m assuming if you kind of exclude Texas from the equation, at least for now, and all your repositioning efforts start to bear fruit.  Is that the right way to think about it?” Jason Kupferberg, UBS


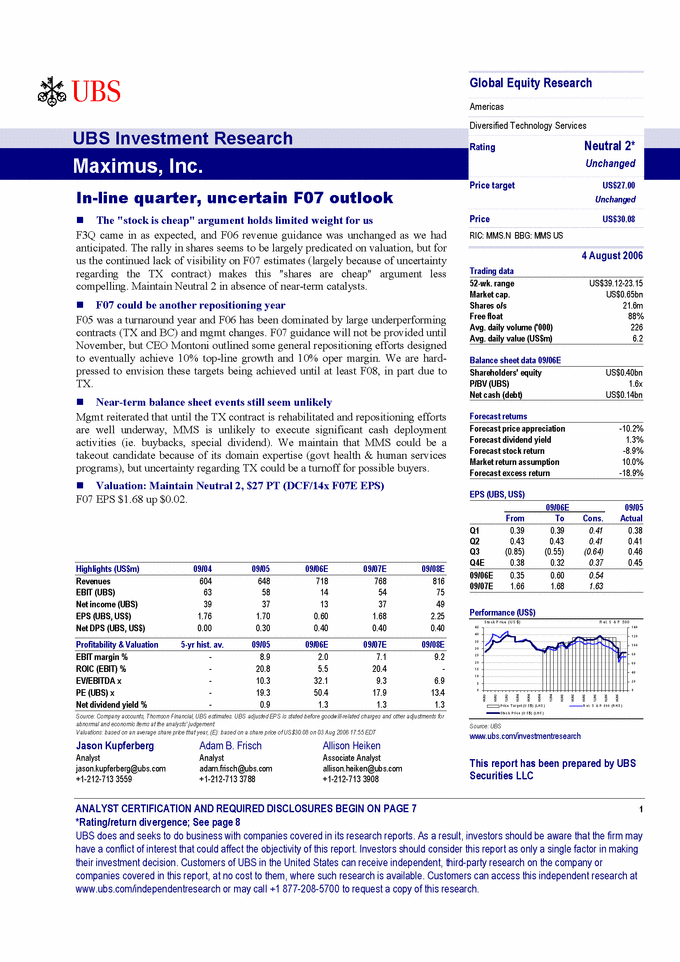
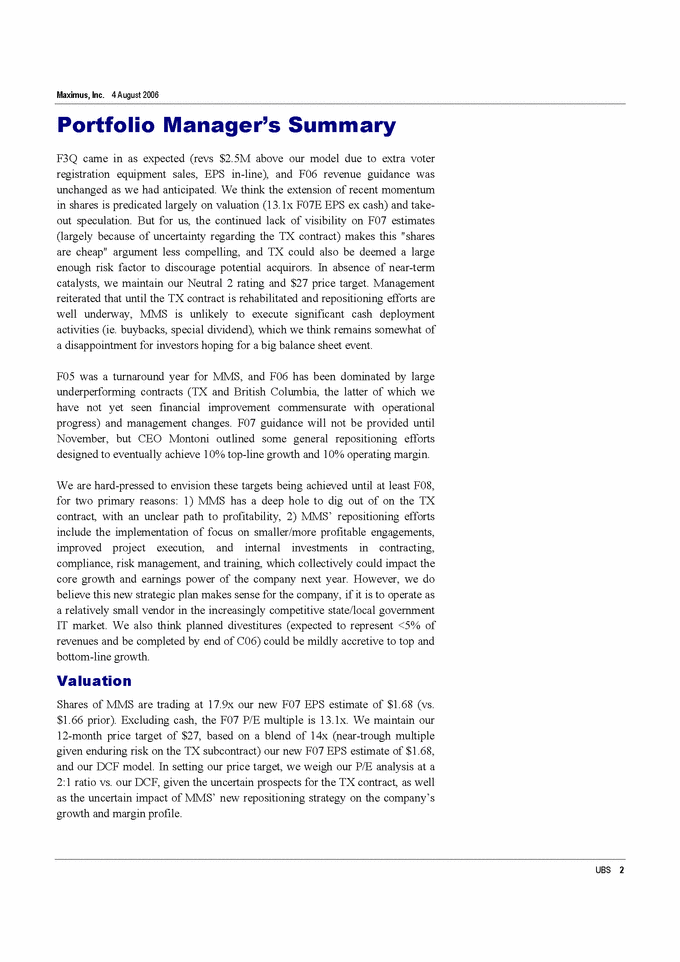
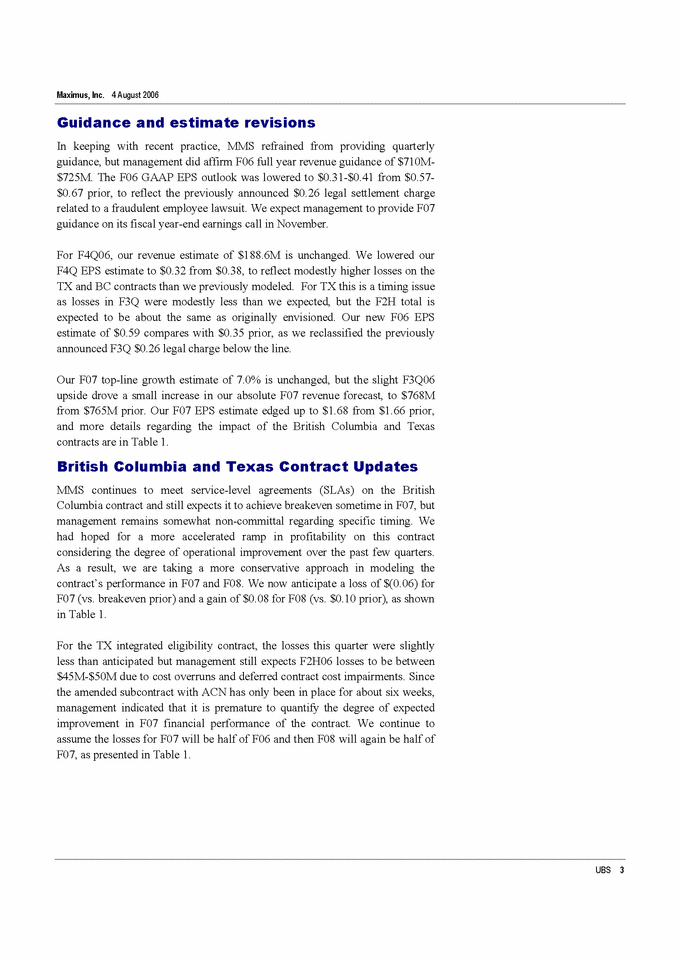
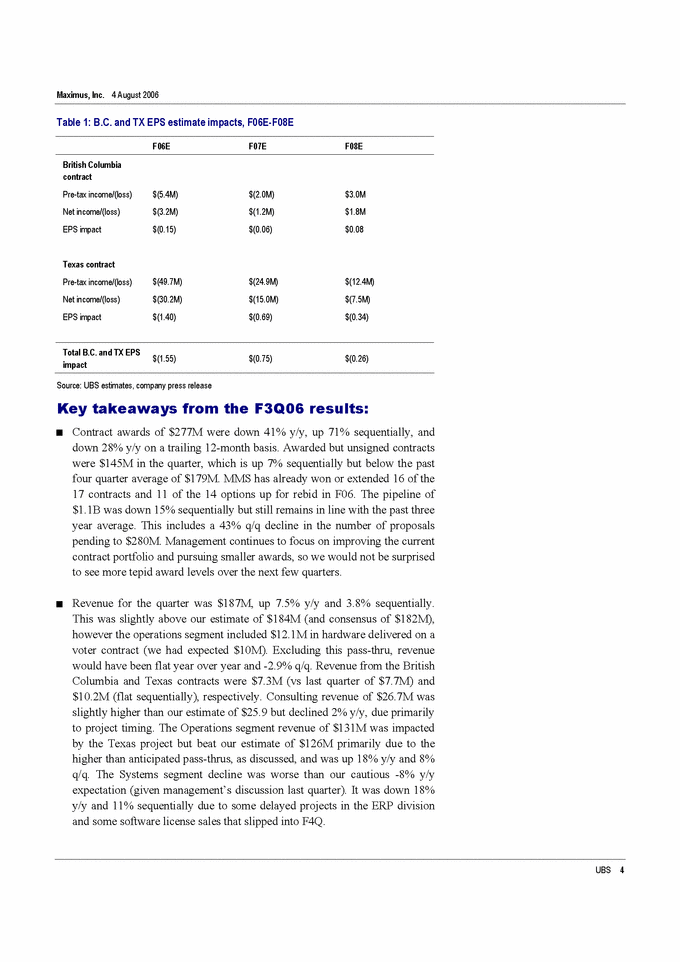
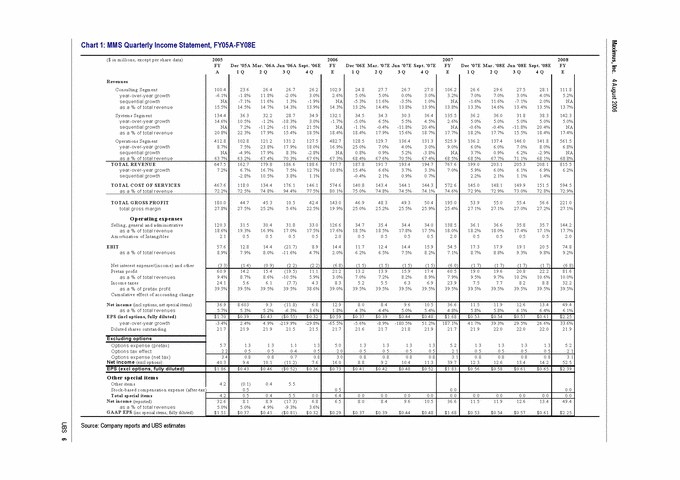
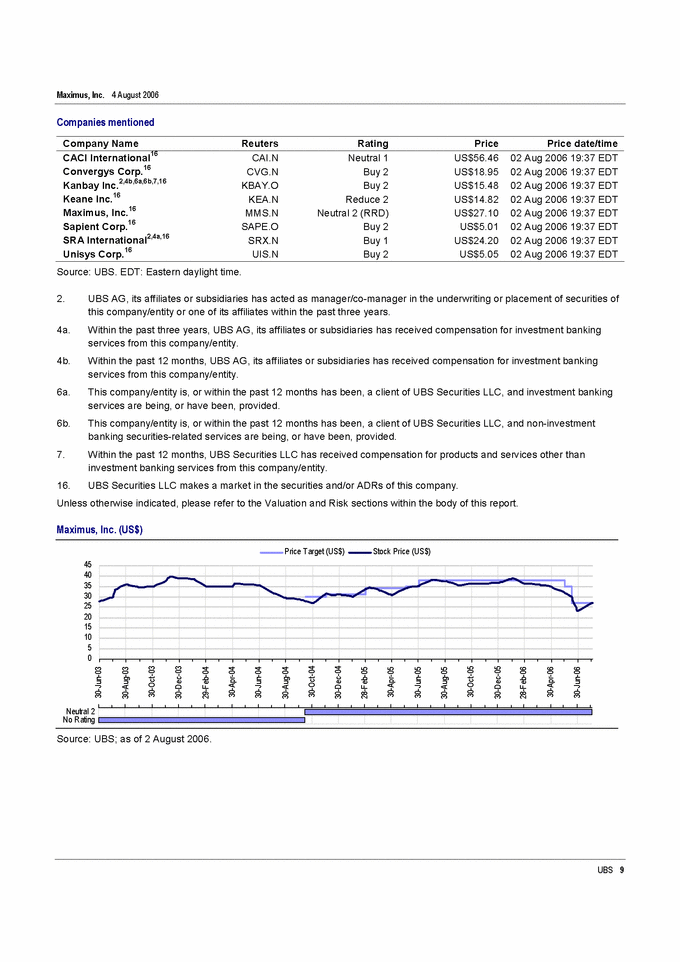
·                  At August 2006, the Company was aware of coverage from eight analysts — CJS Securities, FBR, GARP, KeyBanc, RBC, Stifel Nicolaus, SunTrust and UBS.  All reports focused on the Texas project, including prospective issues, with some interest in the legal charge.  We attach, as Appendix 9, an example from UBS which includes, on page 4, the estimated impacts to EPS of the Texas project and the BC project, showing the focus of this analyst on individual contracts.  In addition, on page 5, the analysis of operating margin is performed after excluding the $9.1M legal charge, reflecting the analyst’s desire (in our opinion) to evaluate the business excluding unusual and infrequently occurring events.


·                  The Company’s quarterly report on Form 10-Q included a description of the Texas project costs (Note 11) and covered details of the legal charges (Note 5).


Fourth Quarter 2006 (September 30, 2006)


·                  The company’s earnings press release, issued on November 15, 2006 and filed as Exhibit 99.1 on Form 8-K on November 20, 2006 included details of the Texas project loss of $12.7M.  The document also defined Base Operations — operations excluding legal settlements and Texas losses, and included a quarterly analysis of EPS as reported compared to EPS on Base Operations.


·                  In a subsequent call with analysts, the business led with the deferral of certain revenues into future periods.  Following this, the focus was on the Base Operations.  As noted by the Chief Financial Officer, “In an effort to provide clear visibility into our business, we believe it was important to provide details on a quarterly basis on our overall financial results for Base Operations, which we define to be our financial results excluding legal settlement expenses and the losses on the Texas project.  We believe this is particularly important when addressing our expectations for 2007.”  There followed a breakdown of the EPS effects for the quarter and year for legal and settlement expenses and the Texas project, before detail of Base Operations was covered.


9


The questions that followed clearly showed a desire from analysts to break out and understand the Texas subcontract, particularly its effects in 2007.  For example, in addressing a question on the full year 2007 results, Jason Kupferberg of UBS asked “You have put some bounds around Texas, which is helpful — can you help us in terms of putting some bounds around where you see free cash flow and DSO coming in for the full fiscal year?”  Jamie Sullivan of RBC asked “Just a quick question on Texas, on the revenue side.  I know you said you’re assuming the existing operations with a range of losses.  Should we assume that the revenue should run where it is at current level?”


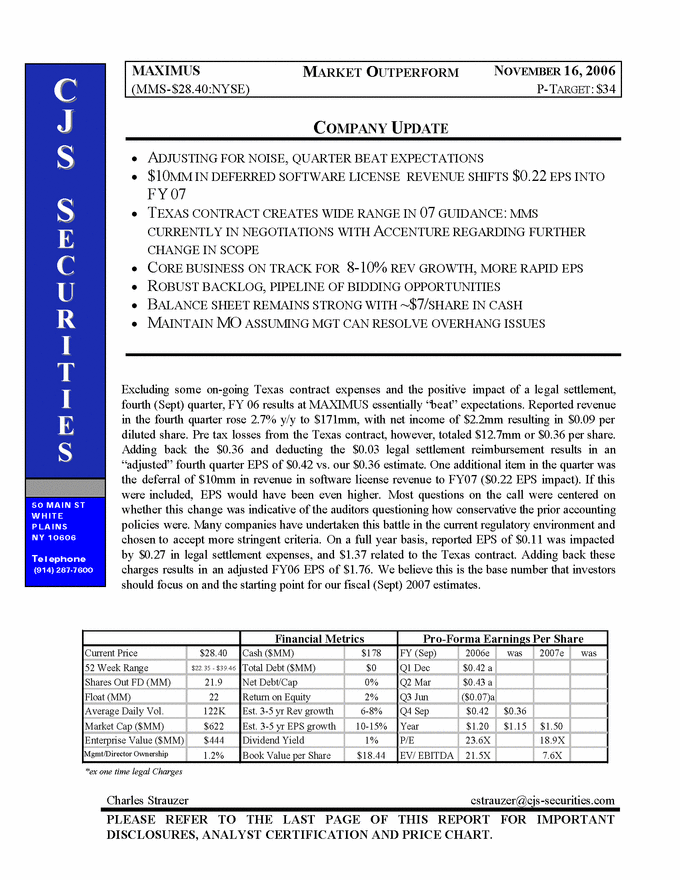
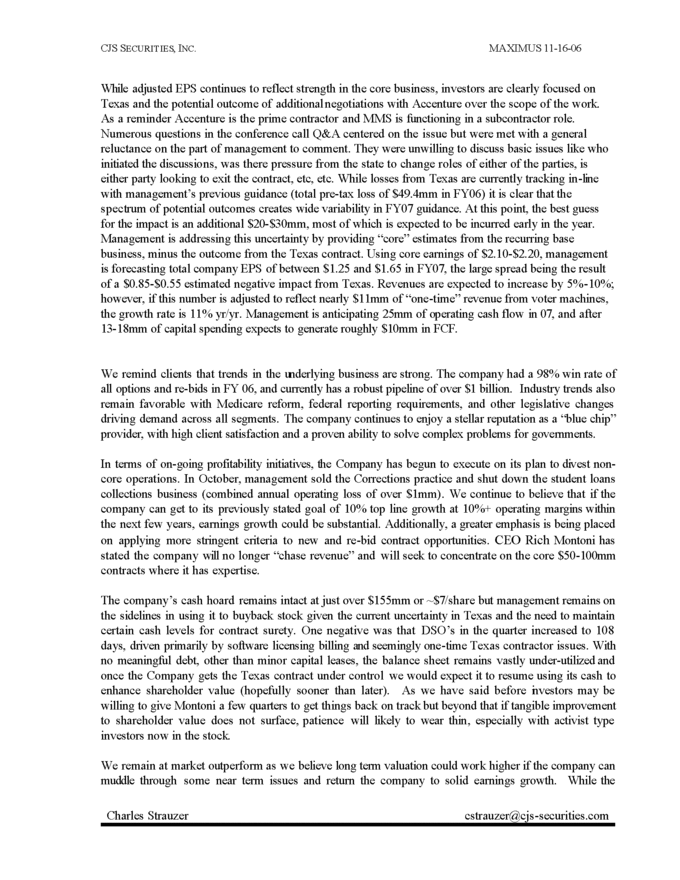
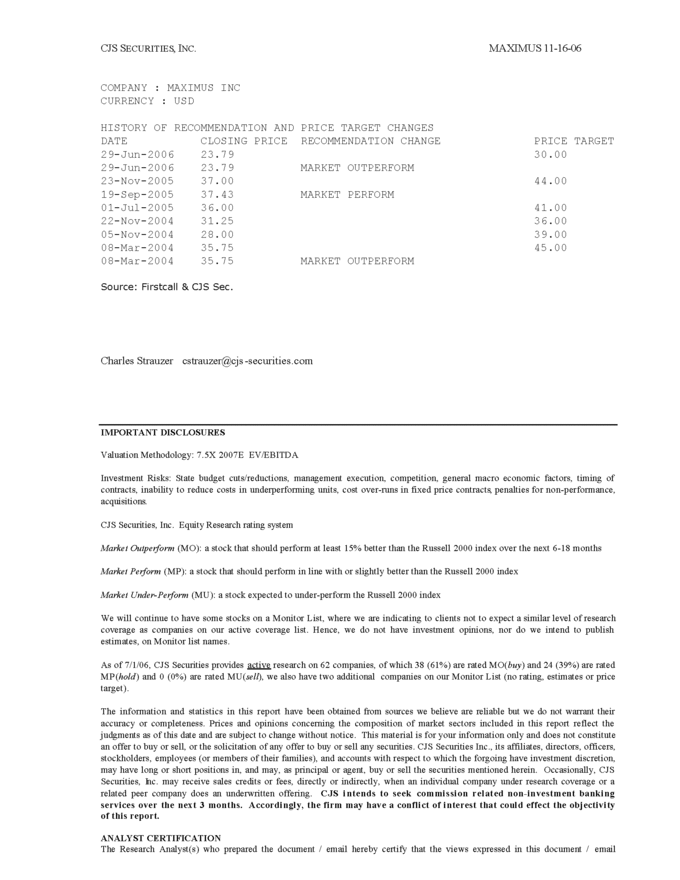
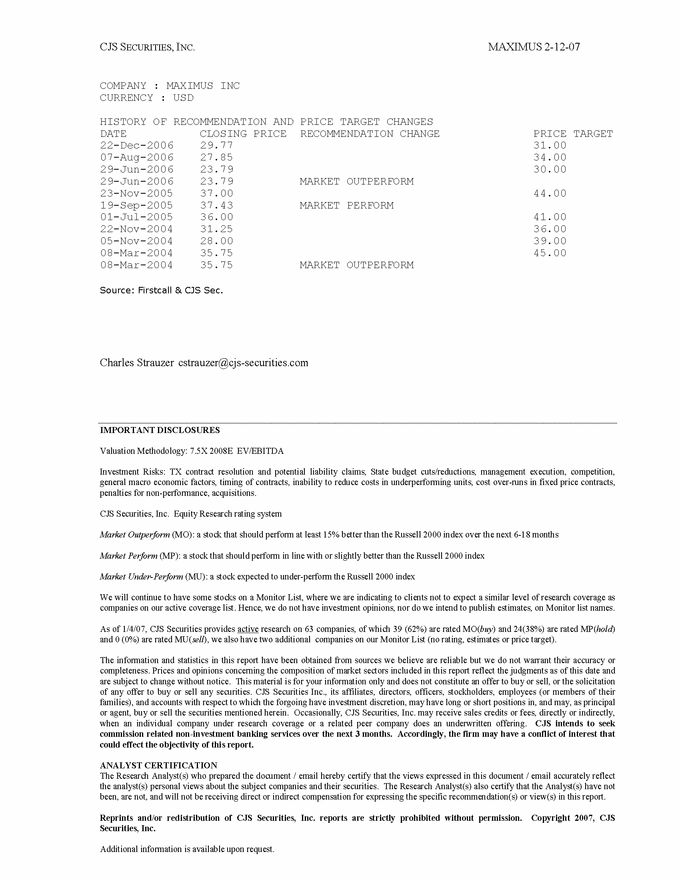
·      At November 2006, the Company was aware of coverage from seven analysts — BB&T, CJS Securities, FBR, GARP, Jefferies, Stifel Nicolaus, and UBS.  By way of an example, we include, at Appendix 10, the CJS Securities report.  This shows an acknowledgement that, in analyzing current results and assessing future results, the Texas contract must be broken out separately


“Pre-tax losses from the Texas contract totaled $12.7mm or $0.36 per share.  Adding back the $0.36 and deducting the $0.03 legal settlement reimbursement results in an “adjusted” fourth quarter EPS of $0.42 vs. our $0.36 estimate.” p1


“On a full year basis, reported EPS of $0.11 was impacted by $0.27 in legal settlement expenses, and $1.37 related to the Texas contract.  Adding back these charges results in an adjusted FY06 EPS of $1.76.  We believe this is the base number that investors should focus on and the starting point for our fiscal (Sept) 2007 estimates.” p1


First Quarter 2007 (December 31, 2006)


·                  The company’s earnings press release, issued on February 8, 2007 and filed as Exhibit 99.1 on Form 8-K on February 12, 2007, led with the Texas subcontract as a significant driver in the results for the period (“Texas Project Impacts Results”).  The effect of the Texas Project, as well as the legal charge which relates to the Texas project, was covered in the opening paragraphs of the document.  Much of the remainder of the earnings release discussed “Base Operations”, defined as operations excluding the Texas project and legal expenses.


·                  On February 8, 2007, the Company held a conference call open to the public to discuss its first quarter results.  A transcript of this call was subsequently filed as Exhibit 99.2 on Form 8-K on February 12, 2007.  The opening remarks from both the Chief Financial Officer and Chief Executive Officer commenced with a detailed discussion of the financial and operational impacts of the Texas subcontract and made use of the “Base Operations” term defined in the earnings release.  In particular, the Chief Financial Officer comments began:


“The Company reported first quarter revenue totaling $161.1 million and a net loss of $10.4 million, or $0.48 per diluted share.  As outlined in this morning’s press release, financial results


10


were impacted principally by the Texas project which accounted for approximately $27 million [pre-tax] in losses, or $0.80 per diluted share.” p4


In a later paragraph, he added:


“For the last couple of quarters, we’ve been talking about performance of the Company’s base operations.  We define base operations to be our financial results, excluding losses on the Texas project and legal expenses.  Base operations, which exclude Texas and legal expenses, delivered $0.32 per diluted share.  The result of base operations is lower than most analysts’ expectations because of a contract dispute on a Child Support implementation in Ontario.” p4


Follow up questions from five of the analysts cover either the Texas subcontract or Base Operations.


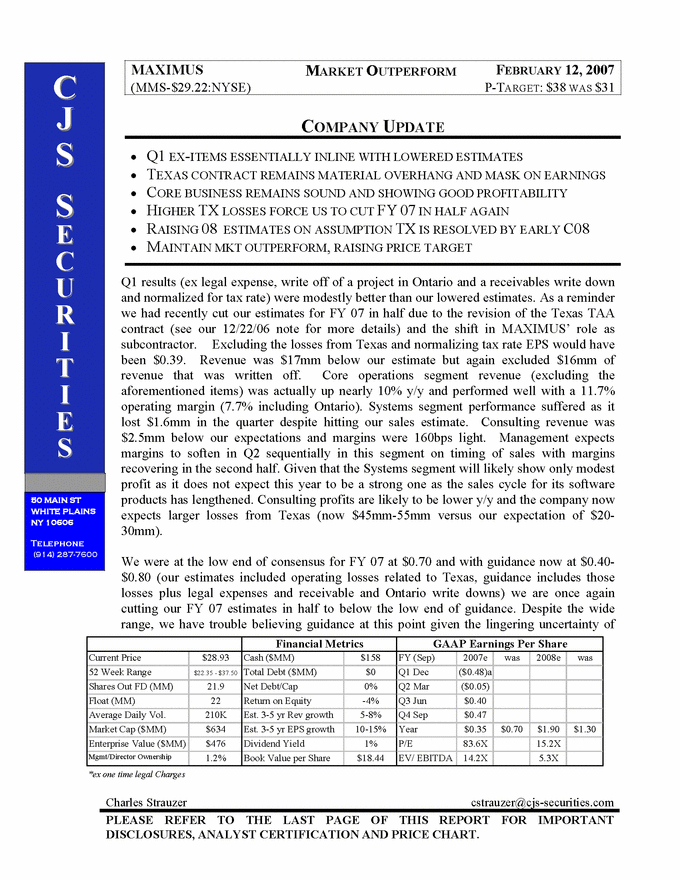
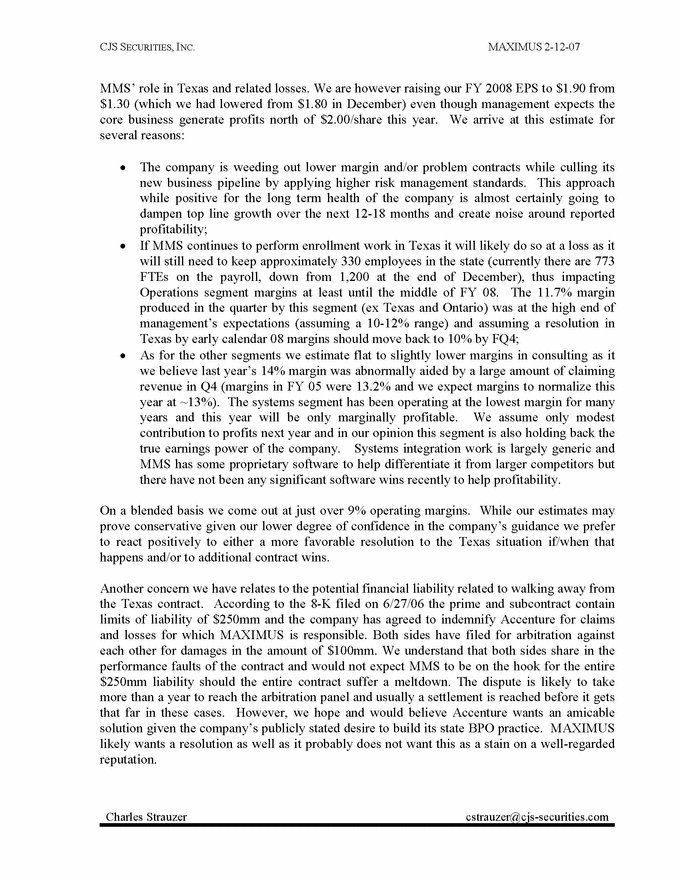
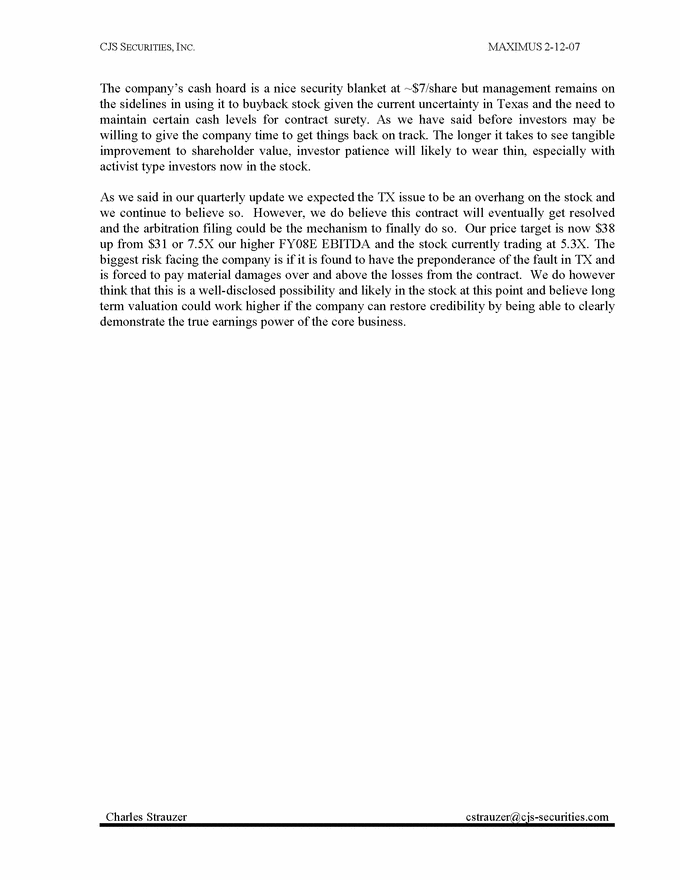
·                  At February 2007, the Company was aware of coverage from seven analysts — CJS Securities, FBR, Jefferies, KeyBanc, Stanford, Stifel Nicolaus, and UBS.  All subsequent analyst reports focused on the Texas Project and a number adjusted the results of the business to exclude the losses recorded in the quarter for these matters.  As an example, we have included an analyst report from CJS Securities from this period as Appendix 11.  We draw your attention to comments on the first page where CJS adjusted results (“Excluding the losses from Texas and normalizing tax rate EPS would have been $0.39.  Revenue was $17mm below our estimate but again included $16mm of revenue that was written off”) and where CJS adjusted its forecast (“We are at the low end of consensus for FY 07 at $0.70 and with guidance now at $0.40-$0.80 (our estimates included operating losses related to Texas, guidance includes those losses plus legal expenses and receivable and Ontario write downs”).  A clear indication of CJS’s focus on the Texas subcontract came in the final paragraph of p3 where they stated, “We expected the TX issue to be an overhang on the stock and we continue to believe so… The biggest risk facing the company is if it is found to have the preponderance of the fault in TX and is forced to pay material damages over and above the losses from the contract.”


·                  In the Company’s own quarterly report on Form 10-Q, the breakdown of costs (on a pre-tax basis) was included on page 14 of Management’s Discussion and Analysis.


Second Quarter 2007 (March 31, 2007)


·                  The Company’s earnings press release, issued on May 9, 2007 and filed as Exhibit 99.1 on Form 8-K on May 10, 2007, focused on Base Operations and the opening paragraphs discussed two distinct charges related to the Texas subcontract, a $6.1M pre-tax charge for legal expenses and a $6.5M loss on the project operations.


·                  On May 9, 2007, the Company held a conference call open to the public to discuss its second quarter results.  A transcript of this call was subsequently filed as Exhibit 99.2 on Form 8-K on May 10, 2007.  The opening remarks from the Chief Financial Officer focused on three areas,


11


namely losses on the Texas subcontract, legal charges and Base Operations.  In subsequent comments he identified respective charges as $0.18 per diluted share and $0.16 per diluted share, with Base Operations recording $0.45 per diluted share.  The opening comments of the Chief Executive Officer all focused on the Texas subcontract.


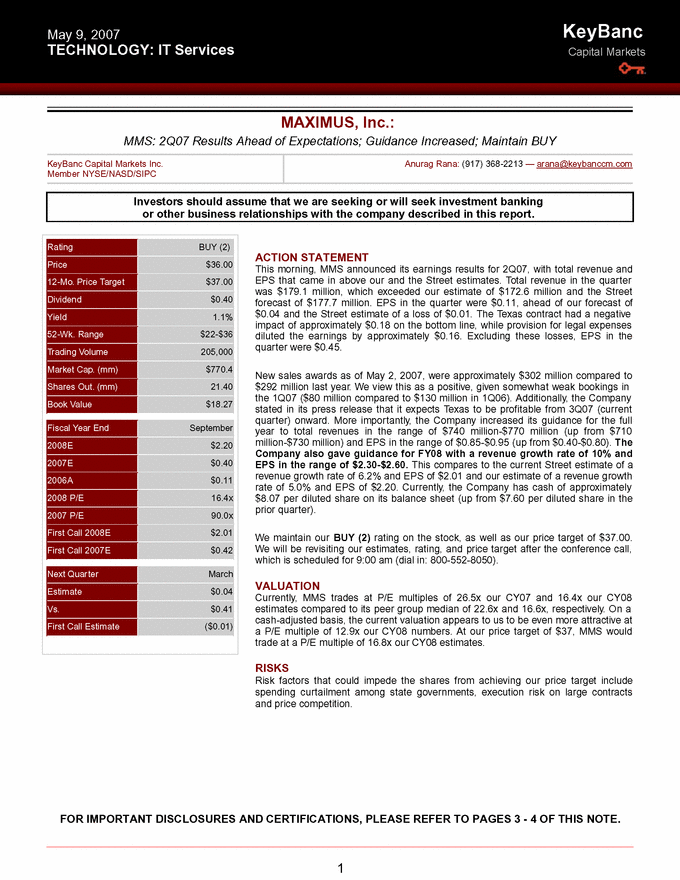
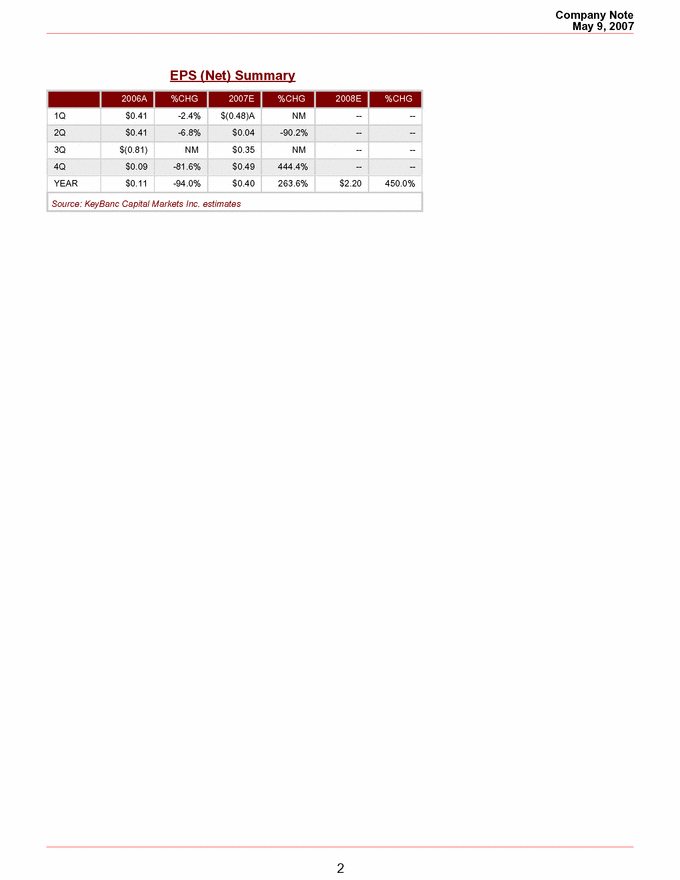
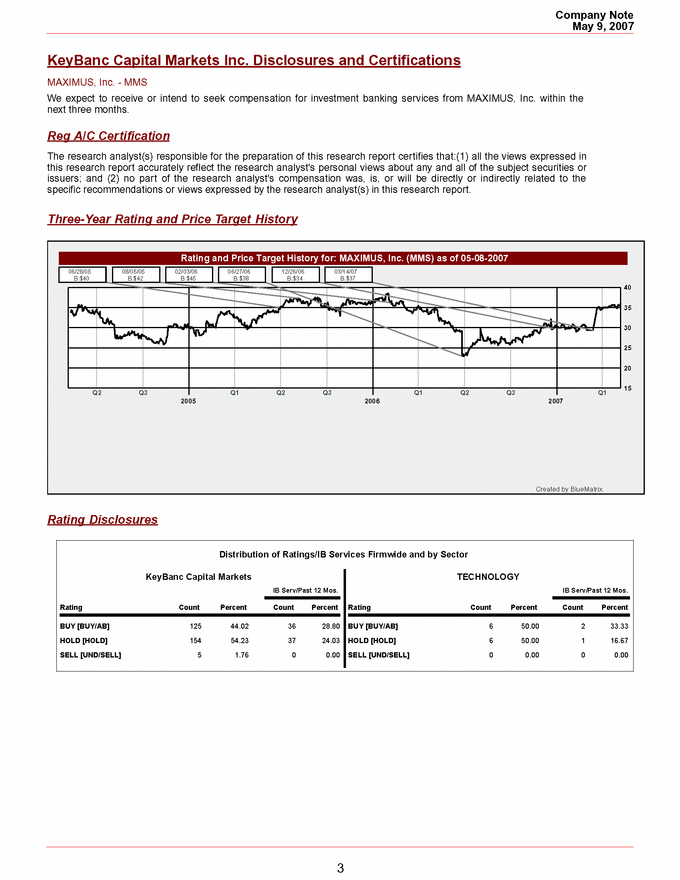
·                  At February 2007, the Company was aware of coverage from nine analysts — CJS Securities, FBR, GARP, Jefferies, KeyBanc, Royal Bank of Canada, Stanford, Stifel Nicolaus, and UBS.  All analysts focused on Texas as the most significant event of the quarter and a number, including CJS, Jefferies, KeyBanc and Stanford used the Company’s adjusted EPS number (EPS excluding the effect of the Texas subcontract and legal expenses) as the basis for their discussion.  As an example, we have included the call note from KeyBanc as Appendix 12.  This document broke out the unusual items identified by the Company consistently with the earnings release (“The Texas contract had a negative impact of approximately $0.18 on the bottom line, while provision for legal expenses diluted the earnings by approximately $0.16.  Excluding these losses, EPS in the quarter were $0.45.”  The report also noted that the Texas subcontract is expected to be profitable in the third quarter, confirming the focus placed upon this subcontract by analysts.


·                  In the Company’s own quarterly report on Form 10-Q, the effect of the Texas subcontract in reducing overall income and segment income for the quarter was included on page 12.  The legal and settlement expense note on page 11 details the legal expenses for the period.


Third Quarter 2007 (June 30, 2007)


·                  The Company filed its earnings press release, issued on August 7, 2006,  as Exhibit 99.1 on Form 8-K on August 9, 2007.  However, a significant, unusual item for the quarter was a legal charge for $33M pre-tax which had been disclosed in a press release on July 23, 2007 (and filed as Exhibit 99.1 on Form 8-K on July 25, 2007).  The nature of the matter, which was included in other Form 8-K filings, reflected the significance of the matter to the Company’s financial results.  The press release identified an EPS effect of $1.30.


·                  On July 24, 2007, the Company held a conference call open to the public to discuss matters relating to the legal charge.  A transcript of this call was subsequently filed as Exhibit 99.1 on Form 8-K on July 24, 2007.  The call focused on the nature of the legal charge as well as the terms and conditions of the agreement, as well as the Company’s review of strategic alternatives being explored.  Much of the call was focused on the nature of the agreement and the review of strategic alternatives.


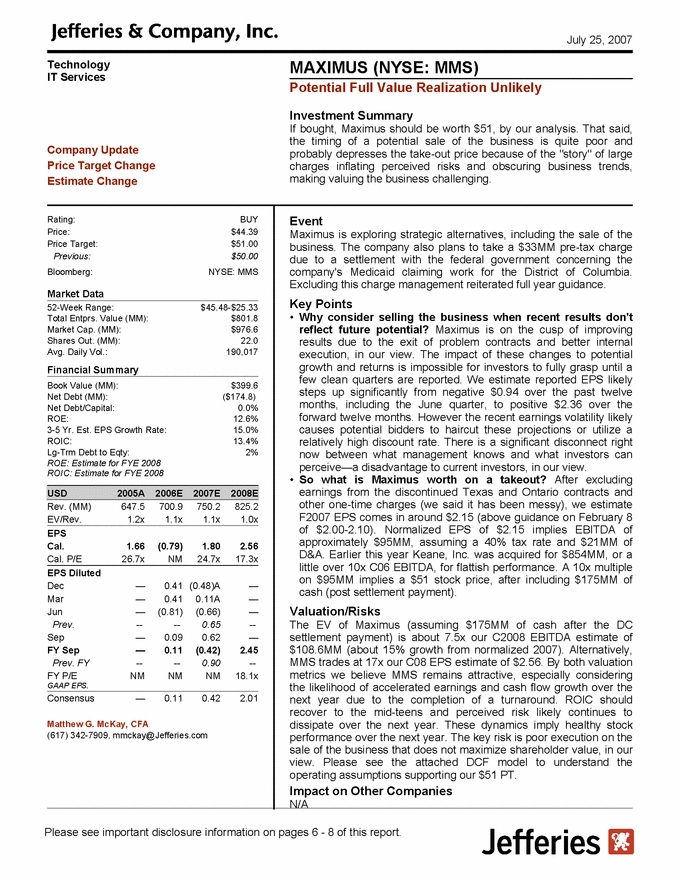
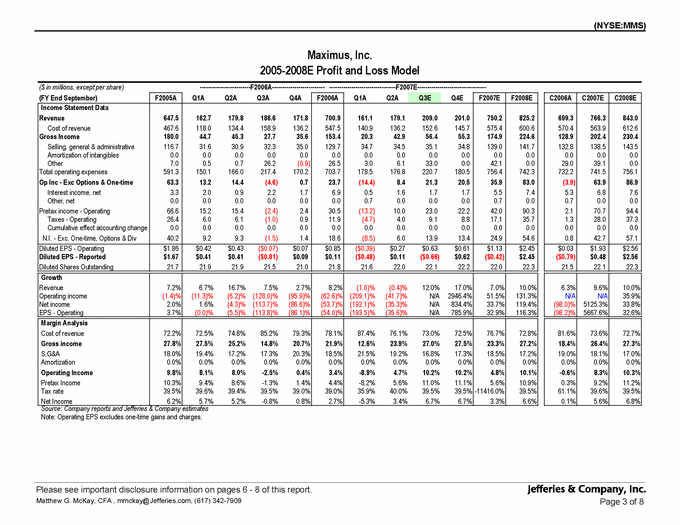
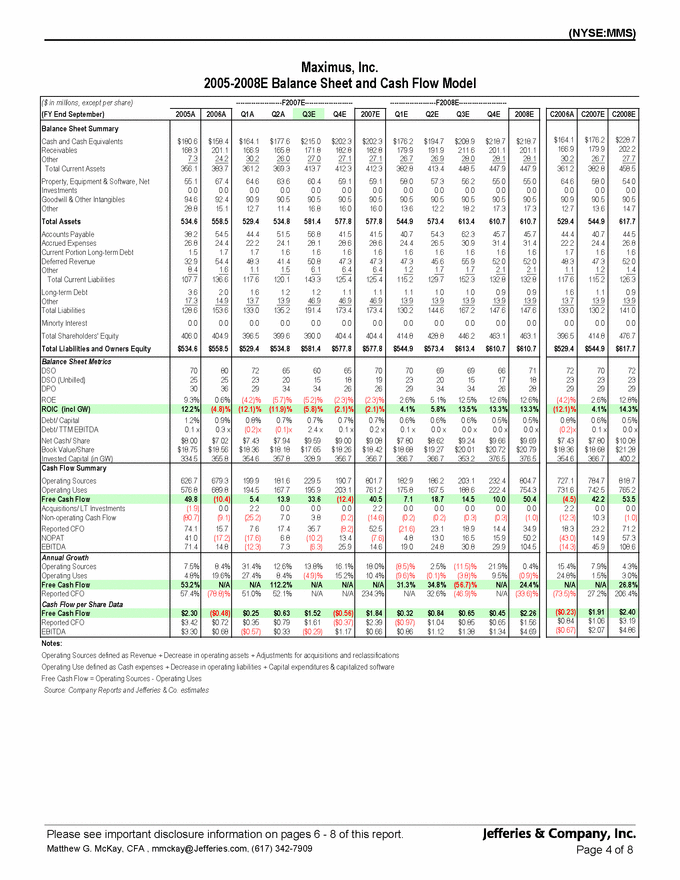
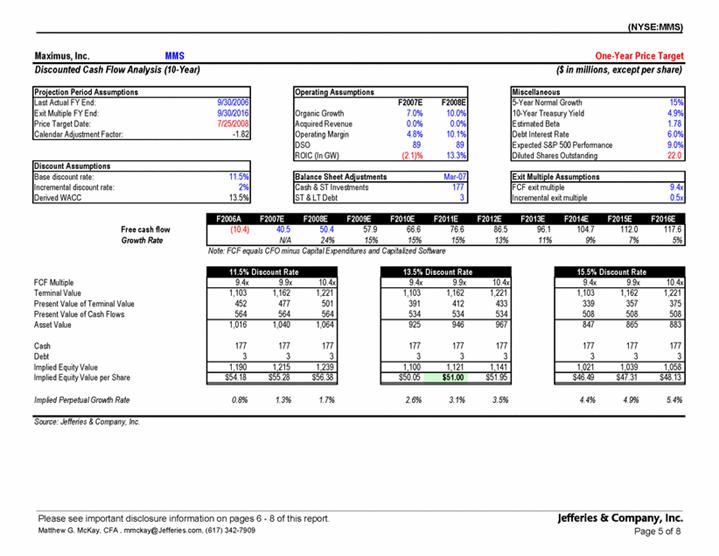
·                  We are aware of six analyst notes following that call - Jefferies, KeyBanc, Royal Bank of Canada, Stanford, Stifel Nicolaus, and UBS.  Most focused on the implications of the strategic review and the valuation of the business but it is clear from the context that many of them saw the legal charge as a one-off event which would be excluded from analyzing the value of the business.  For example, in Appendix 13 we include a report from Jefferies & Company where guidance for


12


EPS was given based upon pro forma numbers “after excluding earnings from the discontinued Texas and Ontario contracts and other one-time charges.”


·                  Analysts also covered the earnings call for the quarter on August 7, 2007.  For the most part, there were few questions or comments on the charge, probably as the information had already been in the public domain for two weeks.  However, all five analyst reports following this call (Jefferies, KeyBanc, Royal bank of Canada, Stifel Nicolaus and UBS) provided the pro forma EPS for the period, adjusted for $1.30 of charges relating to the legal charge for the period.


There were no significant unusual and infrequent items during the fourth quarter of 2007.


First Quarter 2008


·                  No significant unusual and infrequently occurring items were noted in this quarter.  However, management did discuss the $2.2M stock-based compensation charge while discussing SG&A expenses during the earnings call.  This is on page 3 of the transcript of the call, which is filed as Exhibit 99.2 on Form 8-K on February 7, 2008.


“Moving on to SG&A expense in the quarter.  The current SG&A as a percent of revenue is 18%.  A full basis point in the current quarter or $2.2 million is related to the correction of noncash stock-compensation from previous years related to the forfeiture calculation.”


There was a single follow-up question from Charles Strauzer of CJS Securities to clarify the EPS impact and full year charge.  There was no evidence from the remainder of the call, which was principally focused on the Company’s operating results, or from communications received subsequently, of any significant concern raised by analysts concerning the materiality of the SBC Adjustments.  Of the four analyst reports of which we are aware of during this quarter, only two mentioned the $2.2M charge (CJS and Jefferies, with no mention from GARP or UBS) and the mention only served to normalize the results for the charge.  There does not appear any suggestion that analysts found the results of the financial statements misleading as a consequence of the out-of-period charge.


There were no unusual or infrequently occurring items during the second quarter of 2008.  During the third quarter, the Company recorded a gain on sale of a building, which was reduced as a part of the pro forma calculation of net income in the Company’s press release.


Fourth Quarter 2008


·                  The Company initially issued an earnings press release on November 14, 2007 and filed it as Exhibit 99.1 on Form 8-K on November 21, 2008.  However, on December 12, 2008, just prior to the filing of the Company’s Form 10-K, the Company reached a settlement with Accenture which resulted in a legal charge of $37.5M pre-tax, $23.2M net of taxes.  The Company filed a press release on Form 8-K on the same day, reflecting the significance of the transaction, both in


13


monetary terms and in reducing a significant degree of uncertainty over the Company’s financial prospects.


·                  We were aware of four analyst notes following this release - CJS, KeyBanc, Stifel Nicolaus, and UBS.  These notes reflected the level of focus that both management and the analysts held for this matter.  Most give a brief summary of the agreement and the level of uncertainty that had been removed from the Company’s prospects.


·                  The matter was detailed in the Legal and Settlement note within the financial statements included in Form 10-K, filed on December 15, 2008.


Fiscal Year 2009


·                  During fiscal year 2009, the Company did not identify significant unusual and infrequently occurring adjustments to the financial results with the exception of an insurance recovery during the third quarter.  This was acknowledged by various analysts during the period:


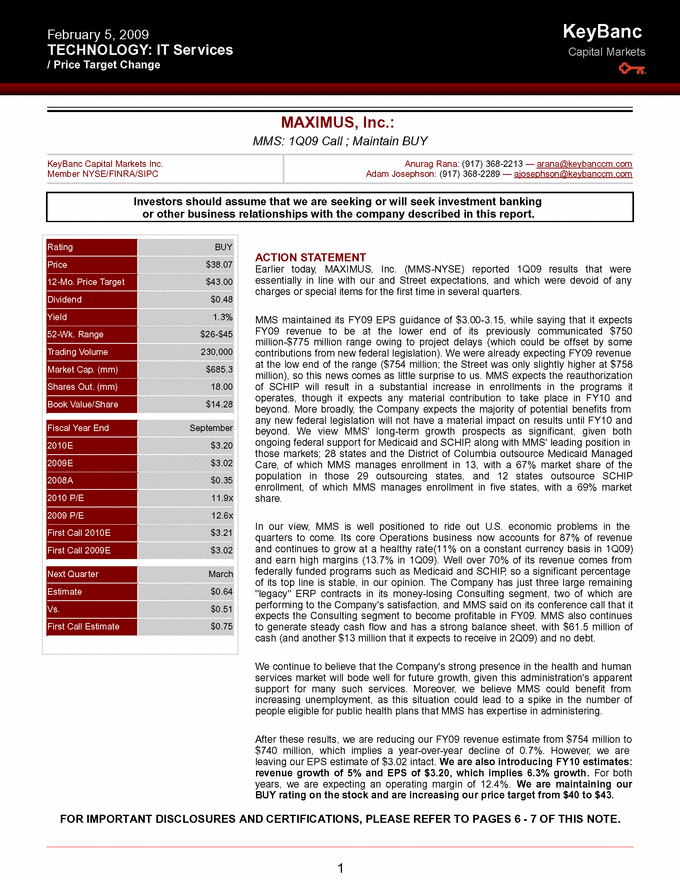
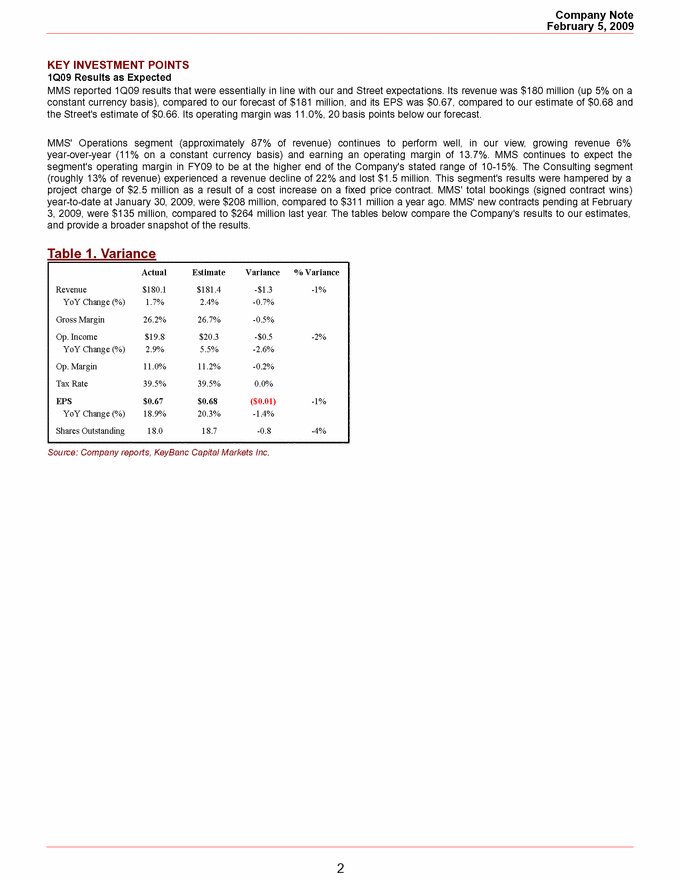
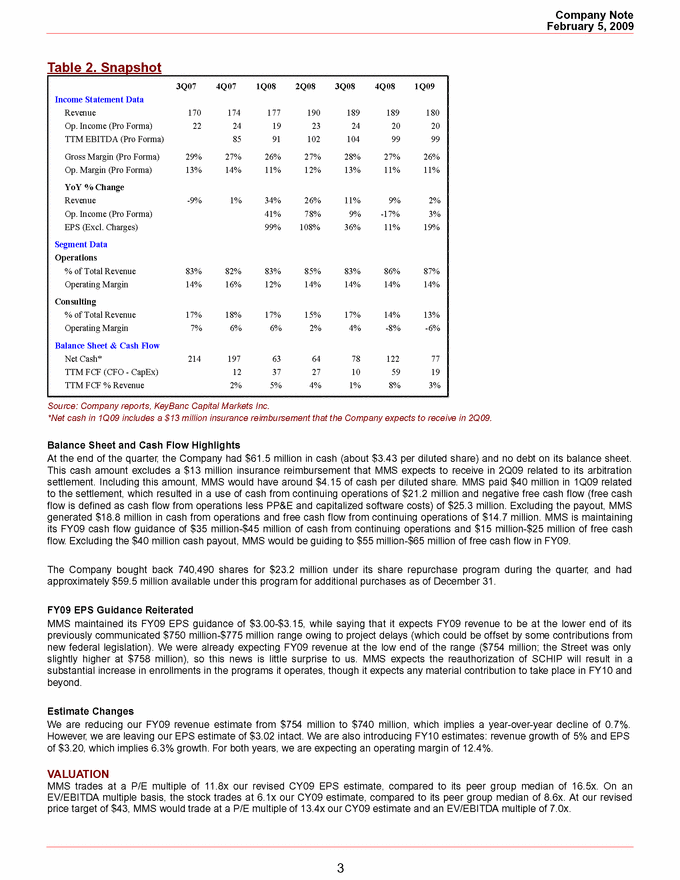
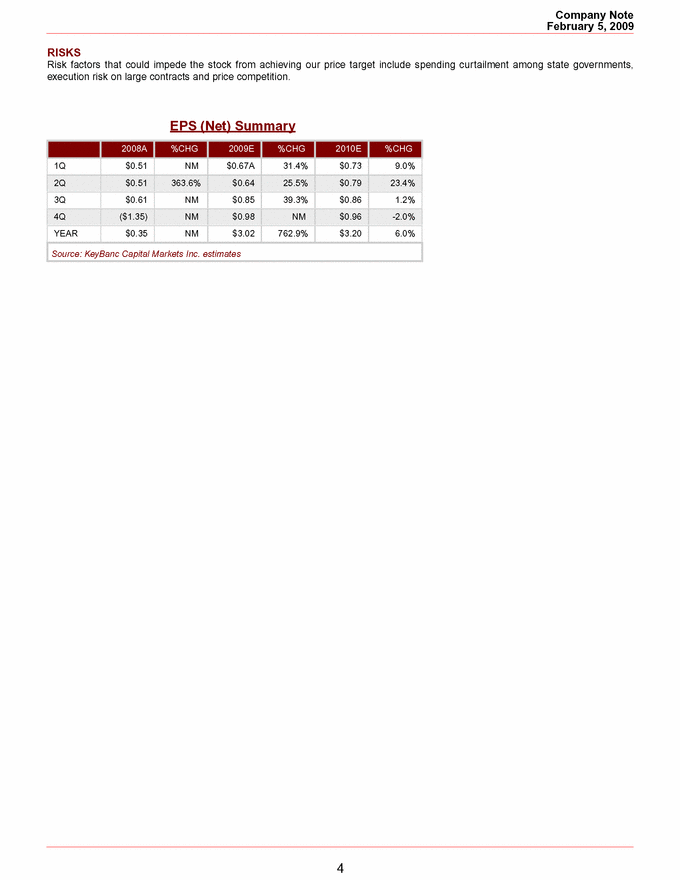
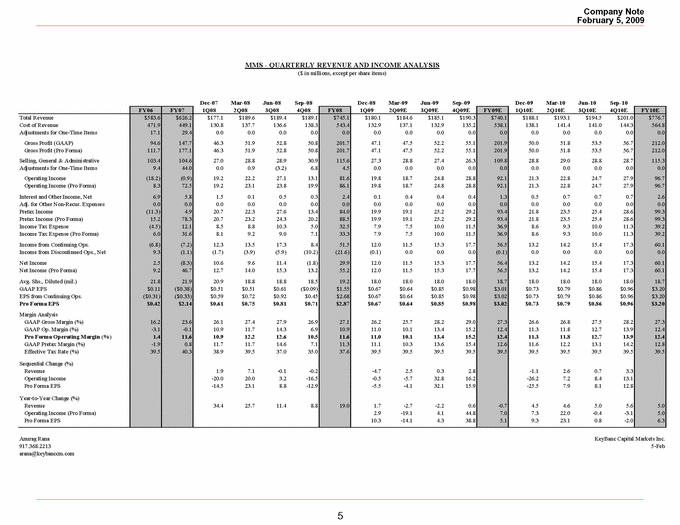
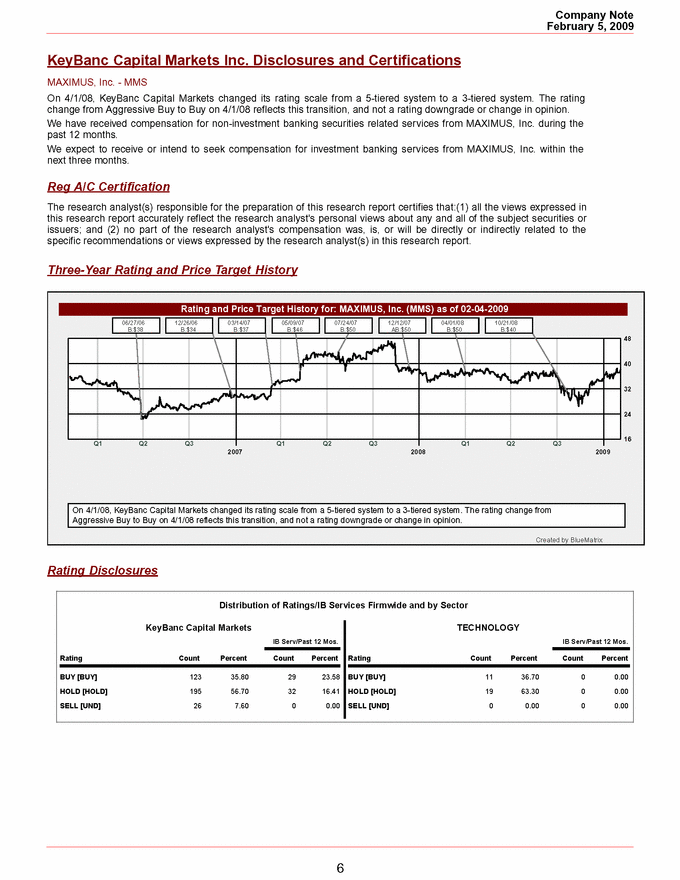
·                  “Earlier today, MAXIMUS, Inc. reported 1Q09 results that were essentially in line with our and Street expectations and which were devoid of any charges or special items for the first time in several quarters.”  KeyBanc, First Quarter, Appendix 14


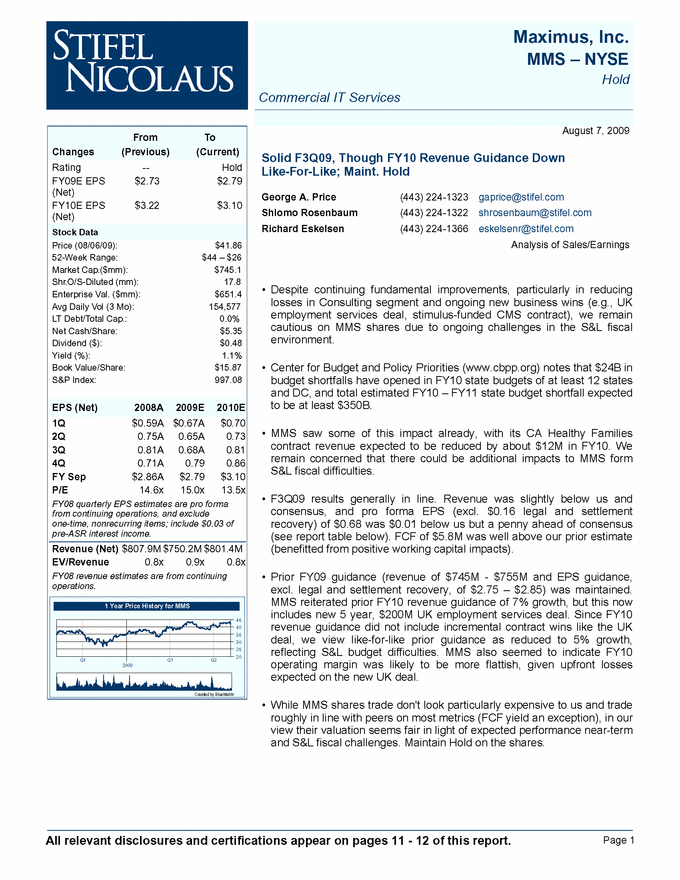
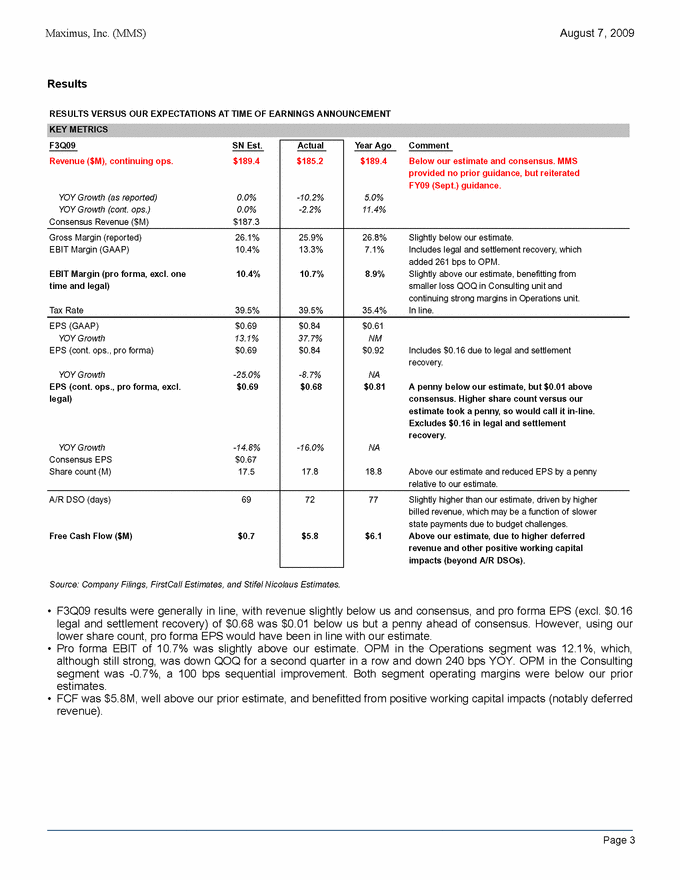
·                  “3Q09 results generally in line.  Revenue was slightly below us and consensus, and pro forma EPS (excluding $0.16 legal and settlement recovery) of $0.68 below us but a penny ahead of consensus.” Stifel Nicolaus, Third Quarter, Appendix 15.


This summary demonstrates the level of focus shown by management and our analysts in identifying significant unusual items within our financial results and giving our stakeholders an opportunity to analyze the Company without the distortion of these charges.  We believe that the items identified by the Company as unusual and infrequent made the presented financials more meaningful to our shareholders and analysts and believe this is reflected in the responses we received to our presentations of results.


We believe that our stakeholders would view our financial statements with a focus on the results both including and excluding significant unusual and infrequently occurring items and would accordingly view a pre-tax adjustment of $2.2M ($1.3M after-tax) in the context of a Company with revenues in excess of $700M and with typical net income in excess of $30M.  The feedback we received from our analysts provides us with comfort that this is the case.  We also believe that, had our analysts concluded that the stock compensation charge had resulted in a material distortion to our results, they would have brought this to the attention of both the Company and the wider public.  The SBC Adjustments were fully disclosed in every set of financial statements filed by the Company during fiscal 2008 and were included in our analyst call, a transcript of which was provided in an SEC filing.  The Company is not aware of any concerns or additional questions raised by the analyst community on this matter.


14


We believe this analysis supports our conclusion that an adjusted net income is most relevant to the users of our financial statements, and thus is the appropriate measure for considering materiality.  In using that measure, we have concluded that the SBC Adjustments were not material in any period presented.  Considering these conclusions, we believe that the correction of the error was immaterial.  Please do not hesitate to contact us if you need further information or clarification.


Sincerely


/s/ David N. Walker


David N. Walker

Chief Financial Officer


15


Appendix 1


Summary of SBC Adjustments


This appendix shows the effect on the financial statements of correcting the stock-compensation charge for each year affected.

($’000s)


2006


2007


2008


Pre-tax adjustment


(1,054

)

(1,122

)

2,176


Adjustment net of taxes


(638

)

(679

)

1,316


In the first quarter of fiscal 2008, the Company had not decided to dispose of components requiring discontinued operations classification. Accordingly, the distribution of the adjustment across the then-existing segments was as follows:


Operations Segment


(602

)

(641

)

1,243


Systems Segment


(204

)

(217

)

421


Consulting Segment


(248

)

(264

)

512


Total


(1,054

)

(1,122

)

2,176


Following the disposal of various components of the business in 2008, the stock-compensation charge was re-allocated to the continuing operations.  As a consequence, the required correction to the error would have been distributed as follows:


Operations Segment


(747

)

(795

)

1,542


Consulting Segment


(307

)

(327

)

634


(1,054

)

(1,122

)

2,176


These SBC Adjustments will be used in subsequent analyses to demonstrate the immateriality of these adjustments in the context of the Company’s financial results for these periods.


Appendix 2


Analysis of SBC Adjustments compared to financial results prior to the recast for discontinued operations


2006


2007


2008


Revenue


700,894


738,646


830,665

*


Income from operations


2,460


(8,255

)

12,312

*

Losses recorded on Texas Contract


29,887


15,246


Legal and settlement expenses/recovery


5,683


26,885


23,207


Goodwill impairment


4,598


Gain on sale of building


(2,382

)

Income from operations adjusted for unusual items


38,030


33,876


37,735


Stock compensation correction (pre-tax)


(1,054

)

(1,122

)

2,176


Stock compensation correction (tax-effected)


(638

)

(679

)

1,316


Stock compensation correction (pre-tax) as a percentage of revenue


-0.15

%

-0.15

%

0.26

%


Stock compensation correction (tax-effected) as a percentage of income from adjusted operations


-1.68

%

-2.00

%

3.49

%


*

The stock compensation error was corrected at December 31, 2007, the first quarter of the Company’s 2008 fiscal year. At September 30, 2008, the financial statements of MAXIMUS were recast to reflect the disposal of the certain businesses. As the initial assessment of materiality was conducted using the assessment of full year budgeted results including these business, we have included comparatives which show the results of the Company as if the discontinued operations classification had not been adopted at September 30, 2008. This increases revenue by $85.5M and reverses a loss of $5.6M recorded on the disposal of the segment.


The effect of the SBC Adjustments on recast numbers is included in Appendix 3.


Appendix 3


Analysis of SBC Adjustments compared to results reported in Form 10-K for the 2008 fiscal year (i.e. recast for discontinued operations)


2006


2007


2008


Revenue


583,571


626,231


745,133


Income from continuing operations


(6,845

)

(7,172

)

28,281


Losses recorded on Texas Contract


29,887


15,246


Legal and settlement expenses/recovery


5,683


26,885


23,207


Goodwill impairment


4,598


Gain on sale of building


(2,382

)

Income from continuing operations adjusted for unusual items


28,725


34,959


53,704


Net income


2,460


(8,255

)

6,677


Losses recorded on Texas Contract


29,887


15,246


Legal and settlement expenses/recovery


5,683


26,885


23,207


Goodwill impairment


4,598


Gain on sale of building


(2,382

)

Net income adjusted for unusual items


38,030


33,876


32,100


Stock compensation correction (pre-tax)


(1,054

)

(1,122

)

2,176


Stock compensation correction (tax-effected)


(638

)

(679

)

1,316


Stock compensation correction (pre-tax) as a percentage of revenue


-0.18

%

-0.18

%

0.29

%


Stock compensation correction as a percentage of income from adjusted continuing operations


-2.22

%

-1.94

%

2.45

%


Stock compensation correction as a percentage of adjusted net income


-1.68

%

-2.00

%

4.10

%


Appendix 4


Analysis of SBC Adjustments compared to financial results prior to recast for discontinued operations


2006


2007


2008


Revenue


Operations


470,863


503,604


629,226


Consulting


102,842


93,707


84,920


Systems


127,189


141,335


116,519


Total


700,894


738,646


830,665

*


Operating income


Operations


(9,453

)

39,132


89,616


Consulting


14,499


6,421


(344

)

Systems


(853

)

(4,655

)

(19,544

)

Total


4,193


40,898


69,728

*


Adjustment to Operations Segment operating income (Texas contract)


49,400


25,200


+


Adjusted operating income


Operations


39,947


64,332


89,616


Consulting


14,499


6,421


(344

)

Systems


(853

)

(4,655

)

(19,544

)

Total


53,593


66,098


69,728


Stock compensation correction (pre-tax)


Operations


(602

)

(641

)

1,243


Consulting


(248

)

(264

)

512


Systems


(204

)

(217

)

421


Total


(1,054

)

(1,122

)

2,176

+


Stock compensation correction as a percentage of revenue


Operations


-0.13

%

-0.13

%

0.20

%

Consulting


-0.24

%

-0.28

%

0.60

%

Systems


-0.16

%

-0.15

%

0.36

%


Stock compensation correction as a percentage of adjusted segment operating income


Operations


-1.51

%

-1.00

%

1.39

%

Consulting


-1.71

%

-4.11

%

-148.84

%

Systems


23.92

%

4.66

%

-2.15

%


*                 See Appendix 2 for explanation of the source of 2008 results.

+                 Numbers are shown pre-tax


Appendix 5


Analysis of SBC Adjustments compared to results reported in Form 10-K for the 2008 fiscal year

(i.e. recast for discontinued operations)


2006 results


2008 results


Results


Percentage contribution


restated for


restated for


2006


2007


2008


2006


2007


2008


SBC Adjustments


SBC Adjustments


Revenue


Operations


471,372


507,486


629,226


81

%

81

%

84

%


Consulting


112,199


118,745


115,907


19

%

19

%

16

%


Total


583,571


626,231


745,133


100

%

100

%

100

%


Operating income


Operations


(14,089

)

35,615


85,693


150.1

%

82.1

%

98.4

%


Consulting


4,705


7,748


1,425


-50.1

%

17.9

%

1.6

%


Total


(9,384

)

43,363


87,118


100.0

%

100.0

%

100.0

%


Adjustment to Operations segment operating income


49,400


25,200


Adjusted operating income


Operations


35,311


60,815


85,693


88.2

%

88.7

%

98.4

%

34,564


87,235


Consulting


4,705


7,748


1,425


11.8

%

11.3

%

1.6

%

4,398


2,059


Total


40,016


68,563


87,118


100.0

%

100.0

%

100.0

%

38,961


89,294


Adjusted profit margin


Operations


7.5

%

12.0

%

13.6

%


7.3

%


13.9

%


Consulting


4.2

%

6.5

%

1.2

%


3.9

%


1.8

%


Total


6.9

%

10.9

%

11.7

%


6.7

%


12.0

%


Stock compensation correction (pre-tax)


Operations


(747

)

(795

)

1,542


Consulting


(307

)

(327

)

634


Total


(1,054

)

(1,122

)

2,176


Stock compensation correction as a percentage of revenue


Operations


-0.16

%

-0.16

%

0.25

%


Consulting


-0.27

%

-0.28

%

0.55

%


Stock compensation correction as a percentage of adjusted segment operating income


Operations


-2.12

%

-1.31

%

1.80

%


Consulting


-6.52

%

-4.22

%

44.49

%


Appendix 6


Comparison of historic and subsequent net income to adjusted net income


Management notes that net income in 2006-08 was affected by certain unusual and infrequently occurring items.

In the absence of these items, net income would have been consistent year-over-year.

This is demonstrated by the analysis below.

All numbers are in $’000s


2004


2005


2006


2007


2008


2009


Net income (loss)


38,774


36,069


2,460


(8,255

)

6,677


46,540


Losses recorded on Texas contract


29,887


15,246


Legal and settlement expenses (recovery)


5,683


26,885


23,207


(4,271

)

Goodwill impairment


4,598


Gain on sale of building


(2,382

)


Net income after adjusting for unusual items


38,774


36,069


38,030


33,876


32,100


42,269


As noted, following these adjustments, net income returns to results which are consistent with prior and subsequent periods.


Appendix 7


Find CIBC research on Bloomberg, Reuters, firstcall.com CIBC World Markets Inc., P.O. Box 500, 161 Bay Street, BCE Place, Toronto, Canada M5J 2S8 (416) 594-7000 and cibcwm.com CIBC World Markets Corp., 300 Madison Avenue, New York, NY 10017-6204 (212) 667-7000 (800) 999-6726 Equity Research Earnings Update May 4, 2006 Business Services MAXIMUS, Inc. Quarter In Line, But EPS Coming Down Revenue was up 17% (the best growth since 2001) due to a few large contracts. These large contracts, while contributing to growth, are incurring operating losses and introduce additional risk to forecasting MMS results. We are reducing our 2006 estimate from $1.90 to $1.85 and lowering our 2007 estimate from $2.20 to $2.15. For 2006 we slightly lowered revenue and EBIT margins and for 2007 we slightly lowered revenue projections. New CEO Rich Montoni emphasized the company will seek fewer higher margin opportunities versus greater volume of lower margin business. The company is accelerating its move to exit certain businesses and appears more focused on managing the current business than acquiring. MMS is trading at $33.37 and has $8.18 per share of cash and equivalents on the balance sheet. Downward estimate revisions have become a theme with this name, particularly as some of the large new contracts have ramped up. We continue to rate MMS a Sector Performer. Stock Price Performance Source: Reuters All figures in US dollars, unless otherwise stated. 06-59970 © 2006 CIBC World Markets does and seeks to do business with companies covered in its research reports. As a result, investors should be aware that the firm may have a conflict of interest that could affect the objectivity of this report. Investors should consider this report as only a single factor in making their investment decision. See "Important Disclosures" section at the end of this report for important required disclosures, including potential conflicts of interest. See "Price Target Calculation" and "Key Risks to Price Target" sections at the end of this report, where applicable. Thatcher Thompson, CFA 1 (212) 667-8114 Thatcher.Thompson@us.cibc.com Adam Mezan, CFA 1 (212) 667-7116 adam.mezan@us.cibc.com Larry Lee 1 (212) 667-7003 Larry.Lee@us.cibc.com Stock Rating: Sector Performer Sector Weighting: Overweight 12-18 mo. Price Target None MMS-NYSE (5/4/06) $33.37 Key Indices: NYSE, Russ 2000 3-5-Yr. EPS Gr. Rate (E) 15.0% 52-week Range $30.79-$39.46 Shares Outstanding 21.9M Float 21.0M Shrs Avg. Daily Trading Vol. 107,048 Market Capitalization $731.1M Dividend/Div Yield $0.40 / 1.2% Fiscal Year Ends September Book Value $19.06 per Shr 2006 ROE (E) 6.8% LT Debt NA Preferred Nil Common Equity $417.5M Convertible Available No Earnings per Share Prev Current 2005 $1.82A 2006 $1.90E $1.85E 2007 $2.20E $2.15E P/E 2005 18.3x 2006 17.6x 18.0x 2007 15.2x 15.5x Company Description MAXIMUS is a leading provider of outsourced services to state and local gov'ts. www.maximus.com


Quarter In Line, But EPS Coming Down - May 04, 2006 2 Less Visibility Ahead MAXIMUS reported EPS of $0.41, which included $0.02 of legal and settlement expense. Excluding the $0.02 of expenses, the results were in line with expectations. Revenue was up 17%, the best quarterly revenue growth we have seen since 2001. The increased revenue is due to a few large contracts, including the British Columbia Health Operations deal and the Texas Welfare Eligibility contract. These large contracts, while contributing to growth, are incurring operating losses and introduce additional risk to forecasting MMS results. Lowering Estimates We are reducing our 2006 estimate from $1.90 to $1.85 and lowering our 2007 estimate from $2.20 to $2.15. For 2006 we slightly lowered projected revenue and EBIT margins and for 2007 we slightly lowered projected revenue. Q2 Focus On Large Contracts Most of the focus this quarter was on two large contracts in BC and Texas. The BC Health Operations contracts has lost roughly $3.2m over the first half of FY06, and the company expects to lose a total of $4-5m for the year, and turn the corner on profitability in 2007. In Texas, the company lost $2.3m on $10m of revenue from the contract in the second quarter. MAXIMUS is a subcontractor to Accenture on this large Welfare Eligibility contract. The Texas contract is the primary source of concern in the quarter. The Texas Commissioner of Health and Human Services recently delayed the phased rollout of the project to ensure that the system is designed correctly. MAXIMUS indicated that this delay has introduced some uncertainty and will result in some negotiations between MAXIMUS and the other parties. The company indicated that any material change that results from these negotiations would be communicated in the next 30 days. These large contracts offer large opportunities and greater risks. Texas and BC have cost the company roughly $0.15-0.16 per share in the first half of 2006 on earnings of $0.81. Strategy As announced a couple weeks ago, Rich Montoni has returned to MAXIMUS to assume the CEO position. He stated some changes in plans that we think are worth paying attention to: 1) The company is going to distinctly emphasize quality of new business over quantity. This means that profitability and contract terms will be more stringent. While the company had publicly stated its intent to exit certain lower margin, non-strategic businesses last year, it appears the timeline for such changes has been accelerated, and these moves should take place over the next six months. 2) In the past, MAXIMUS has indicated an appetite for larger acquisitions, but Mr. Montoni indicated a desire to focus more on the business they have. Any acquisitions are likely to be small deals. 3) Finally, management indicated a desire to invest capital in technology that will allow the company to scale the business more readily.


Quarter In Line, But EPS Coming Down - May 04, 2006 3 Attractive Valuation, But Maintain SP MMS is trading at about $33.37 and has $8.18 per share of cash and equivalents on the balance sheet. After backing out the cash, the stock is trading at 13.6x our FY06 estimate of $1.85 and 11.7x our FY07 estimate of $2.15. While this valuation is certainly attractive, we should also note that downward earnings revisions have become a theme with this name, particularly as some of the large new contracts have ramped up. With the delay in Texas, we think there exists some added earnings uncertainty. We continue to rate MMS a Sector Performer.


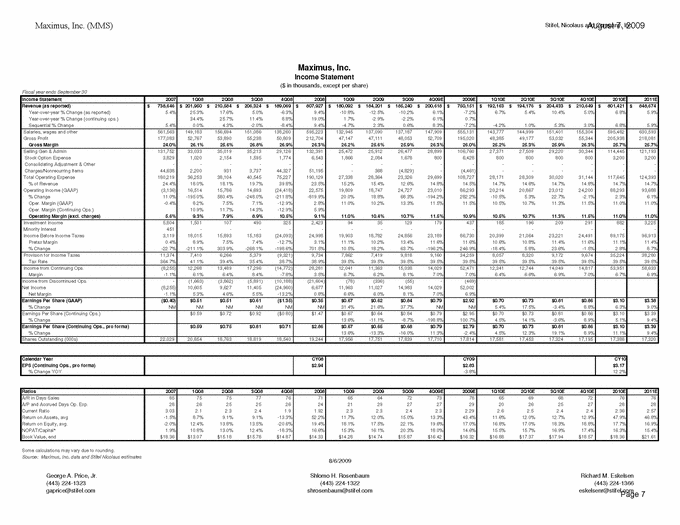
Quarter In Line, But EPS Coming Down - May 04, 2006 4 Exhibit 1. MAXIMUS Income Statement (FYE Sep) ($000s) Dec Mar Jun Sep Dec Mar Jun Sep FY04 1Q05 2Q05 3Q05 4Q05 FY05 1Q06 2Q06 3Q06E 4Q06E FY06E FY07E Revenues $603,774 $152,495 $154,051 $173,658 $167,334 $647,538 $162,726 $179,773 $194,122 $187,091 $723,712 $784,836 Cost of services 427,206 108,090 110,336 126,427 122,735 467,588 117,980 134,441 141,228 137,133 530,782 575,613 Gross profit $176,568 $44,405 $43,715 $47,231 $44,599 $179,950 $44,746 $45,332 $52,894 $49,958 $192,930 $209,222 SG&A 113,522 29,549 28,714 31,741 28,172 118,176 32,064 30,866 36,495 32,584 132,009 139,437 EBITA $63,046 $14,856 $15,001 $15,490 $16,427 $61,774 $12,682 $14,466 $16,399 $17,374 $60,921 $69,785 Other non-recurring expense 0 5,500 5,500 725 0 0 725 0 Operating income (EBIT) $63,046 $14,856 $15,001 $15,490 $10,927 $56,274 $12,682 $13,741 $16,399 $17,374 $60,196 $69,785 Interest and other income 1,044 100 703 1,229 1,313 3,345 2,038 940 1,600 1,313 5,891 7,936 Pretax income $64,090 $14,956 $15,704 $16,719 $12,240 $59,619 $14,720 $14,681 $17,999 $18,687 $66,087 $77,721 Income Taxes 25,316 5,907 6,204 6,604 4,835 23,550 5,814 5,791 7,020 7,288 25,912 30,311 Tax Rate 39.5% 39.5% 39.5% 39.5% 39.5% 39.5% 39.5% 39.4% 39.0% 39.0% 39.2% 39.0% Net Income $38,774 $9,049 $9,500 $10,115 $7,405 $36,069 $8,906 $8,890 $10,979 $11,399 $40,174 $47,410 EPS: F.D. (Reported) $1.77 $0.42 $0.44 $0.47 $0.34 $1.67 $0.41 $0.41 $0.50 $0.52 $1.83 $2.15 F.D. (ex-chg) $1.77 $0.42 $0.44 $0.47 $0.49 $1.82 $0.41 $0.43 $0.50 $0.52 $1.85 $2.15 Shares Outstanding - Diluted 21,947 21,551 21,612 21,599 21,850 21,653 21,908 21,888 21,908 21,928 21,908 22,053 Margin Analysis: Gross Profit 29.2% 29.1% 28.4% 27.2% 26.7% 27.8% 27.5% 25.2% 27.2% 26.7% 26.7% 26.7% EBITDA 12.6% 12.0% 12.0% 11.1% 9.2% 11.0% 10.3% 10.0% 10.8% 11.7% 10.7% 11.1% EBITA 10.4% 9.7% 9.7% 8.9% 9.8% 9.5% 7.8% 8.0% 8.4% 9.3% 8.4% 8.9% Operating income (EBIT) 10.4% 9.7% 9.7% 8.9% 6.5% 8.7% 7.8% 7.6% 8.4% 9.3% 8.3% 8.9% Pretax income 10.6% 9.8% 10.2% 9.6% 7.3% 9.2% 9.0% 8.2% 9.3% 10.0% 9.1% 9.9% Net Income 6.4% 5.9% 6.2% 5.8% 4.4% 5.6% 5.5% 4.9% 5.7% 6.1% 5.6% 6.0% Growth Analysis YoY: Total Revenues 8.1% 9.8% 2.2% 8.4% 8.6% 7.2% 6.7% 16.7% 11.8% 11.8% 11.8% 8.4% EBITA 6.6% (0.5%) (2.5%) (3.9%) (1.1%) (2.0%) (14.6%) (3.6%) 5.9% 5.8% (1.4%) 14.5% Operating income (EBIT) 10.5% (0.5%) (2.5%) (3.9%) (34.2%) (10.7%) (14.6%) (8.4%) 5.9% 59.0% 7.0% 15.9% F.D. (ex-chg) EPS 6.7% 0.7% 2.9% 4.1% 3.8% 2.9% (3.2%) (3.0%) 7.0% 5.8% 1.9% 16.0% EPS, F.D. (ex-chg, adj. FAS123) 7.0% 9.4% 17.0% 12.7% 11.7% Source: Company reports and CIBC World Markets Corp.


Quarter In Line, But EPS Coming Down - May 04, 2006 5 Our EPS estimates are shown below: 1 Qtr. 2 Qtr. 3 Qtr. 4 Qtr. Yearly 2005 Current $0.42A $0.44A $0.47A $0.49A $1.82A 2006 Prior $0.41A $0.44E $0.52E $0.53E $1.90E 2006 Current $0.41E $0.43E $0.50E $0.52E $1.85E 2007 Prior -- -- -- -- $2.20E 2007 Current -- -- -- -- $2.15E


Quarter In Line, But EPS Coming Down - May 04, 2006 6 IMPORTANT DISCLOSURES: Analyst Certification: Each CIBC World Markets research analyst named on the front page of this research report, or at the beginning of any subsection hereof, hereby certifies that (i) the recommendations and opinions expressed herein accurately reflect such research analyst's personal views about the company and securities that are the subject of this report and all other companies and securities mentioned in this report that are covered by such research analyst and (ii) no part of the research analyst's compensation was, is, or will be, directly or indirectly, related to the specific recommendations or views expressed by such research analyst in this report. Potential Conflicts of Interest: Equity research analysts employed by CIBC World Markets are compensated from revenues generated by various CIBC World Markets businesses, including the CIBC World Markets Investment Banking Department within the Corporate and Leveraged Finance Division. Research analysts do not receive compensation based upon revenues from specific investment banking transactions. CIBC World Markets generally prohibits any research analyst and any member of his or her household from executing trades in the securities of a company that such research analyst covers. Additionally, CIBC World Markets generally prohibits any research analyst from serving as an officer, director or advisory board member of a company that such analyst covers. In addition to 1% ownership positions in covered companies that are required to be specifically disclosed in this report, CIBC World Markets may have a long position of less than 1% or a short position or deal as principal in the securities discussed herein, related securities or in options, futures or other derivative instruments based thereon. Recipients of this report are advised that any or all of the foregoing arrangements, as well as more specific disclosures set forth below, may at times give rise to potential conflicts of interest. Important Disclosure Footnotes for MAXIMUS, Inc. (MMS)


Quarter In Line, But EPS Coming Down - May 04, 2006 7 Companies Mentioned in this Report that Are Not Covered by CIBC World Markets: Stock Prices as of 05/04/2006: Accenture (ACN-NYSE, $29.45, Not Rated)


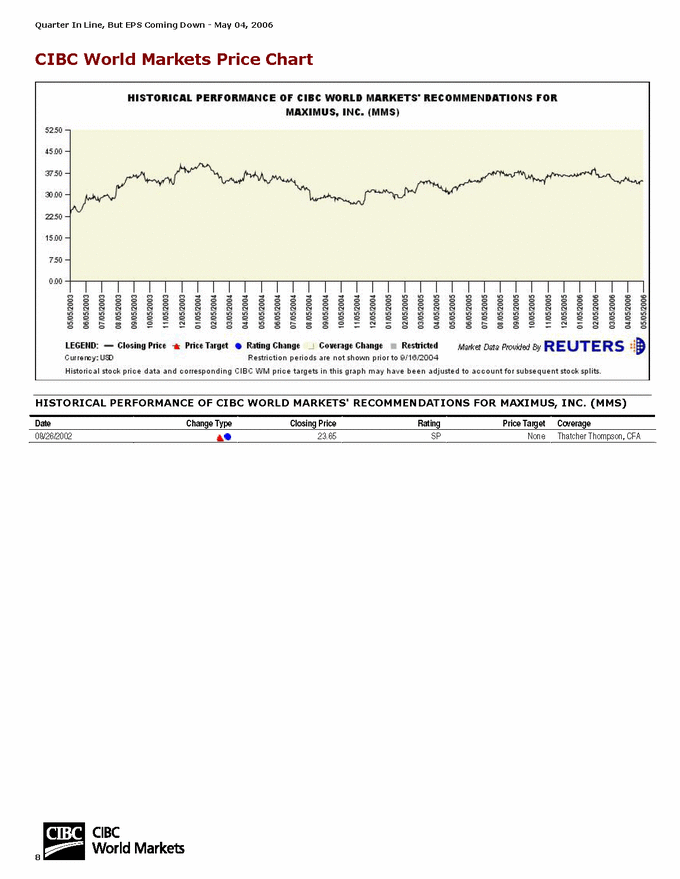
Quarter In Line, But EPS Coming Down - May 04, 2006 8 CIBC World Markets Price Chart HISTORICAL PERFORMANCE OF CIBC WORLD MARKETS' RECOMMENDATIONS FOR MAXIMUS, INC. (MMS) Date Change Type Closing Price Rating Price Target Coverage 08/26/2002 23.65 SP None Thatcher Thompson, CFA


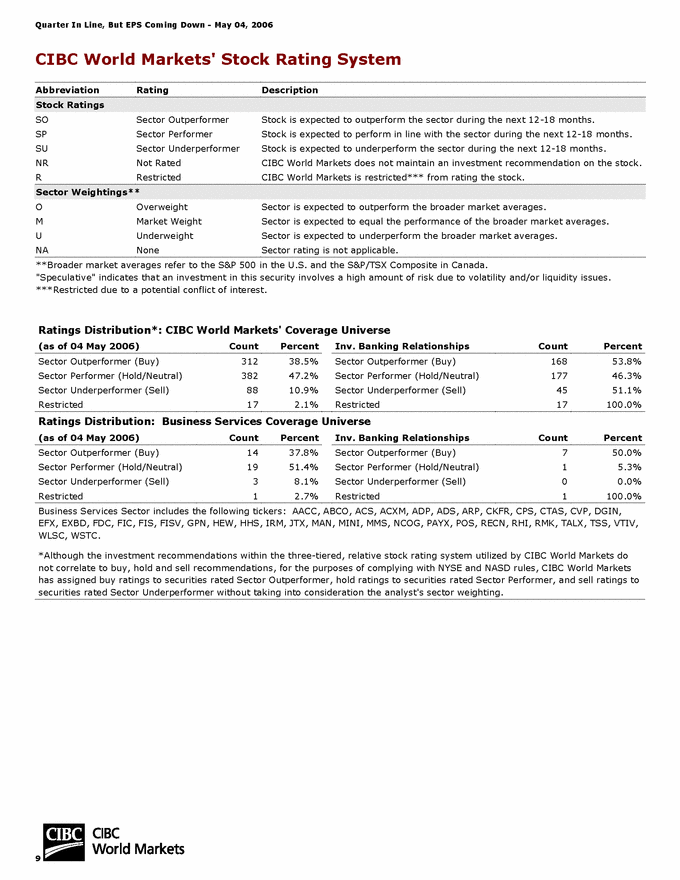
Quarter In Line, But EPS Coming Down - May 04, 2006 9 CIBC World Markets' Stock Rating System Abbreviation Rating Description Stock Ratings SO Sector Outperformer Stock is expected to outperform the sector during the next 12-18 months. SP Sector Performer Stock is expected to perform in line with the sector during the next 12-18 months. SU Sector Underperformer Stock is expected to underperform the sector during the next 12-18 months. NR Not Rated CIBC World Markets does not maintain an investment recommendation on the stock. R Restricted CIBC World Markets is restricted*** from rating the stock. Sector Weightings** O Overweight Sector is expected to outperform the broader market averages. M Market Weight Sector is expected to equal the performance of the broader market averages. U Underweight Sector is expected to underperform the broader market averages. NA None Sector rating is not applicable. **Broader market averages refer to the S&P 500 in the U.S. and the S&P/TSX Composite in Canada. "Speculative" indicates that an investment in this security involves a high amount of risk due to volatility and/or liquidity issues. ***Restricted due to a potential conflict of interest. Ratings Distribution*: CIBC World Markets' Coverage Universe (as of 04 May 2006) Count Percent Inv. Banking Relationships Count Percent Sector Outperformer (Buy) 312 38.5% Sector Outperformer (Buy) 168 53.8% Sector Performer (Hold/Neutral) 382 47.2% Sector Performer (Hold/Neutral) 177 46.3% Sector Underperformer (Sell) 88 10.9% Sector Underperformer (Sell) 45 51.1% Restricted 17 2.1% Restricted 17 100.0% Ratings Distribution: Business Services Coverage Universe (as of 04 May 2006) Count Percent Inv. Banking Relationships Count Percent Sector Outperformer (Buy) 14 37.8% Sector Outperformer (Buy) 7 50.0% Sector Performer (Hold/Neutral) 19 51.4% Sector Performer (Hold/Neutral) 1 5.3% Sector Underperformer (Sell) 3 8.1% Sector Underperformer (Sell) 0 0.0% Restricted 1 2.7% Restricted 1 100.0% Business Services Sector includes the following tickers: AACC, ABCO, ACS, ACXM, ADP, ADS, ARP, CKFR, CPS, CTAS, CVP, DGIN, EFX, EXBD, FDC, FIC, FIS, FISV, GPN, HEW, HHS, IRM, JTX, MAN, MINI, MMS, NCOG, PAYX, POS, RECN, RHI, RMK, TALX, TSS, VTIV, WLSC, WSTC. *Although the investment recommendations within the three-tiered, relative stock rating system utilized by CIBC World Markets do not correlate to buy, hold and sell recommendations, for the purposes of complying with NYSE and NASD rules, CIBC World Markets has assigned buy ratings to securities rated Sector Outperformer, hold ratings to securities rated Sector Performer, and sell ratings to securities rated Sector Underperformer without taking into consideration the analyst's sector weighting.


Quarter In Line, But EPS Coming Down - May 04, 2006 10 Legal Disclaimer This report is issued and approved for distribution by (i) in the United States, CIBC World Markets Corp., a member of the New York Stock Exchange ("NYSE"), NASD and SIPC, (ii) in Canada, CIBC World Markets Inc., a member of the Investment Dealers Association ("IDA"), the Toronto Stock Exchange, the TSX Venture Exchange and CIPF, (iii) in the United Kingdom, CIBC World Markets plc, which is regulated by the Financial Services Authority ("FSA"), and (iv) in Australia, CIBC World Markets Australia Limited, a member of the Australian Stock Exchange and regulated by the ASIC (collectively, "CIBC World Markets"). This report is provided, for informational purposes only, to institutional investor clients of CIBC World Markets in the United States and Canada and retail clients of CIBC World Markets in Canada, and does not constitute an offer or solicitation to buy or sell any securities discussed herein in any jurisdiction where such offer or solicitation would be prohibited. This document and any of the products and information contained herein are not intended for the use of private investors in the United Kingdom. Such investors will not be able to enter into agreements or purchase products mentioned herein from CIBC World Markets plc. The comments and views expressed in this document are meant for the general interests of clients of CIBC World Markets Australia Limited. The securities mentioned in this report may not be suitable for all types of investors. This report does not take into account the investment objectives, financial situation or specific needs of any particular client of CIBC World Markets. Recipients should consider this report as only a single factor in making an investment decision and should not rely solely on investment recommendations contained herein, if any, as a substitution for the exercise of independent judgment of the merits and risks of investments. The analyst writing the report is not a person or company with actual, implied or apparent authority to act on behalf of any issuer mentioned in the report. Before making an investment decision with respect to any security recommended in this report, the recipient should consider whether such recommendation is appropriate given the recipient's particular investment needs, objectives and financial circumstances. CIBC World Markets suggests that, prior to acting on any of the recommendations herein, Canadian retail clients of CIBC World Markets contact one of our client advisers in your jurisdiction to discuss your particular circumstances. Non-client recipients of this report who are not institutional investor clients of CIBC World Markets should consult with an independent financial advisor prior to making any investment decision based on this report or for any necessary explanation of its contents. CIBC World Markets will not treat non-client recipients as its clients solely by virtue of their receiving this report. Past performance is not a guarantee of future results, and no representation or warranty, express or implied, is made regarding future performance of any security mentioned in this report. The price of the securities mentioned in this report and the income they produce may fluctuate and/or be adversely affected by exchange rates, and investors may realize losses on investments in such securities, including the loss of investment principal. CIBC World Markets accepts no liability for any loss arising from the use of information contained in this report, except to the extent that liability may arise under specific statutes or regulations applicable to CIBC World Markets. Information, opinions and statistical data contained in this report were obtained or derived from sources believed to be reliable, but CIBC World Markets does not represent that any such information, opinion or statistical data is accurate or complete (with the exception of information contained in the Important Disclosures section of this report provided by CIBC World Markets or individual research analysts), and they should not be relied upon as such. All estimates, opinions and recommendations expressed herein constitute judgments as of the date of this report and are subject to change without notice. Nothing in this report constitutes legal, accounting or tax advice. Since the levels and bases of taxation can change, any reference in this report to the impact of taxation should not be construed as offering tax advice on the tax consequences of investments. As with any investment having potential tax implications, clients should consult with their own independent tax adviser. This report may provide addresses of, or contain hyperlinks to, Internet web sites. CIBC World Markets has not reviewed the linked Internet web site of any third party and takes no responsibility for the contents thereof. Each such address or hyperlink is provided solely for the recipient's convenience and information, and the content of linked thirdparty web sites is not in any way incorporated into this document. Recipients who choose to access such third-party web sites or follow such hyperlinks do so at their own risk. Although each company issuing this report is a wholly owned subsidiary of Canadian Imperial Bank of Commerce ("CIBC"), each is solely responsible for its contractual obligations and commitments, and any securities products offered or recommended to or purchased or sold in any client accounts (i) will not be insured by the Federal Deposit Insurance Corporation ("FDIC"), the Canada Deposit Insurance Corporation or other similar deposit insurance, (ii) will not be deposits or other obligations of CIBC, (iii) will not be endorsed or guaranteed by CIBC, and (iv) will be subject to investment risks, including possible loss of the principal invested. The CIBC trademark is used under license. © 2006 CIBC World Markets Corp. and CIBC World Markets Inc. All rights reserved. Unauthorized use, distribution, duplication or disclosure without the prior written permission of CIBC World Markets is prohibited by law and may result in prosecution.


Appendix 8


KeyBanc Capital Markets is a division of McDonald Investments Inc., member NYSE/NASD/SIPC, and a trade name under which KeyCorp markets the corporate and investment banking services of its subsidiaries, McDonald Investments Inc. and KeyBank National Association, to its clients. Securities products and services are provided by McDonald Investments Inc. by its licensed securities representatives, who may also be employees of KeyBank National Association. 1 FOR IMPORTANT DISCLOSURES AND CERTIFICATIONS, PLEASE REFER TO PAGES 3 - 4 OF THIS NOTE. ACTION STATEMENT Following yesterday's conference call regarding the Texas Human and Health services contract, we are making some changes to our model. We continue to rate the stock BUY(2) with a 12-month price target of $38. As a reminder, the Company expects pre-tax losses in the magnitude of $45 million-$50 million for 2H06 with the 3Q06 pre-tax impact between $35 million-$38 million related to the Texas contract. For 3Q06, the Company expects net loss per diluted share of $0.55-$0.60 and EPS in the range of $0.57-$0.67 for full year 2006. Based on management's comments and updated guidance, we are reducing our 3Q06 EPS estimates from $0.48 to a loss of $0.58. For full year 2006, we are now forecasting EPS of $0.61 compared to our earlier estimate of $1.84. For 2007, we are modeling a loss of $15 million related to the Texas contract and are reducing our estimate from $2.15 to $1.75. VALUATION At last night's closing price of $23.20, MMS was trading at 44.6x our CY06 and 12.7x our CY07 estimates compared to its peer group of Government and Defense companies, which trade at a median of 21.0x and 17.4x, respectively, for the same time period. On an EV/EBITDA basis, MMS trades at 10.7x our CY06 and 4.3x our CY07 estimates. In comparison, the Government and Defense companies trade at CY06 and CY07 multiples of 10.7x and 8.6x, respectively. On an EV/Revenue basis, MMS trades at 0.5x our CY06 and 0.4x our CY07 estimates. In comparison, the Government and Defense companies trade at CY06 and CY07 multiples of 1.1x and 1.0x, respectively. At our price target of $38, MMS would trade at a P/E multiple of 20.8x our CY07 estimates, an EV/EBITDA multiple of 8.5x our CY07 estimates and an EV/Revenue multiple of 0.8x our CY07 estimates. RISKS Risk factors that could impede the stock from achieving our price target include spending curtailment among state governments, execution risk on large contracts and price competition. June 28, 2006 KeyBanc TECHNOLOGY: IT Services Capital Markets Company Update / Estimates Change A Division of McDonald Investments Inc. MAXIMUS, Inc.: MMS: Estimate Changes to Reflect Losses Associated with the Texas Contract KeyBanc Capital Markets, A Division of McDonald Investments Inc. Anurag Rana: (917) 368-2213 — arana@keybanccm.com Investors should assume that we are seeking or will seek investment banking or other business relationships with the company described in this report. Rating BUY (2) Price $23.20 12-Mo. Price Target $38.00 Dividend $0.40 Yield 1.7% 52-Wk. Range $22-$39 Trading Volume 116,000 Market Cap. (mm) $496.5 Shares Out. (mm) 21.40 Book Value $18.27 Fiscal Year End September 2007E $1.75 2006E $0.61 2005A $1.82 2007 P/E 13.3x 2006 P/E 38.0x First Call 2007E $2.11 First Call 2006E $1.82 Next Quarter June Estimate ($0.58) Vs. $0.47 First Call Estimate $0.49


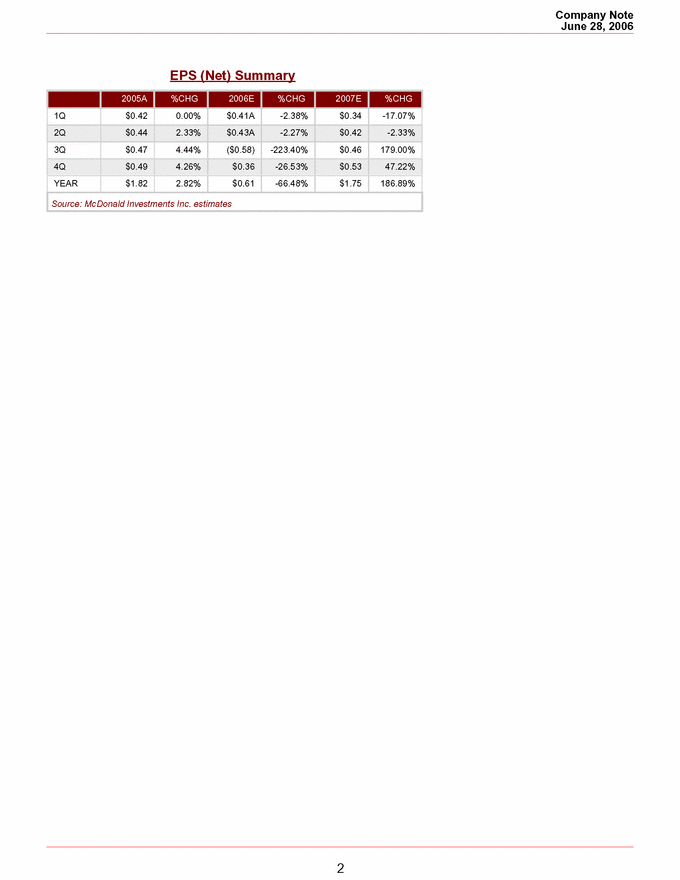
2 EPS (Net) Summary 2005A %CHG 2006E %CHG 2007E %CHG 1Q $0.42 0.00% $0.41A -2.38% $0.34 -17.07% 2Q $0.44 2.33% $0.43A -2.27% $0.42 -2.33% 3Q $0.47 4.44% ($0.58) -223.40% $0.46 179.00% 4Q $0.49 4.26% $0.36 -26.53% $0.53 47.22% YEAR $1.82 2.82% $0.61 -66.48% $1.75 186.89% Source: McDonald Investments Inc. estimates Company Note June 28, 2006


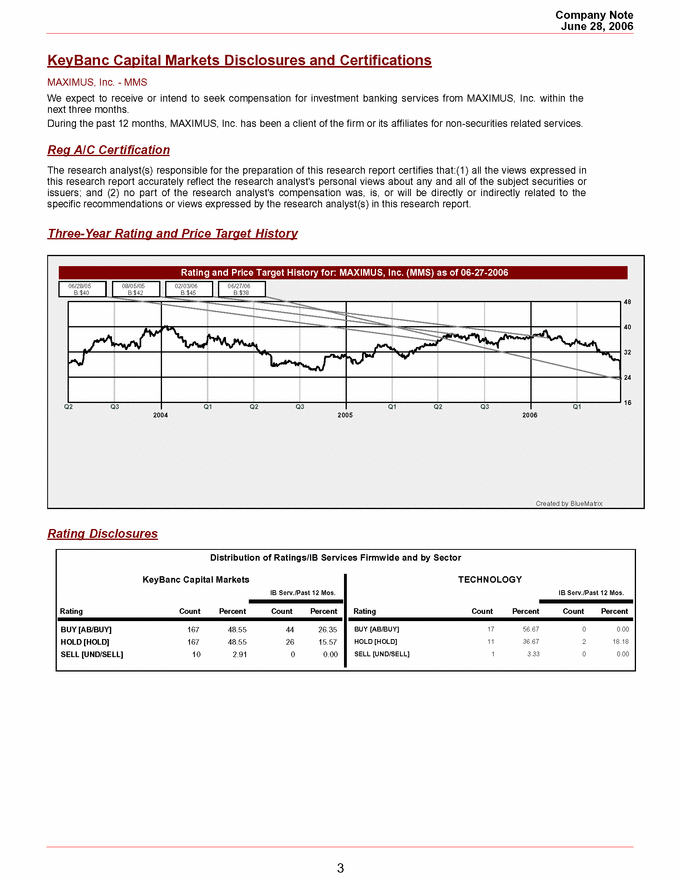
3 KeyBanc Capital Markets Disclosures and Certifications MAXIMUS, Inc. - MMS We expect to receive or intend to seek compensation for investment banking services from MAXIMUS, Inc. within the next three months. During the past 12 months, MAXIMUS, Inc. has been a client of the firm or its affiliates for non-securities related services. Reg A/C Certification The research analyst(s) responsible for the preparation of this research report certifies that:(1) all the views expressed in this research report accurately reflect the research analyst's personal views about any and all of the subject securities or issuers; and (2) no part of the research analyst's compensation was, is, or will be directly or indirectly related to the specific recommendations or views expressed by the research analyst(s) in this research report. Three-Year Rating and Price Target History Q2 Q3 Q1 Q2 Q3 Q1 Q2 Q3 Q1 16 24 32 40 48 2004 2005 2006 06/28/05 B:$40 08/05/05 B:$42 02/03/06 B:$45 06/27/06 B:$38 Rating and Price Target History for: MAXIMUS, Inc. (MMS) as of 06-27-2006 Created by BlueMatrix Rating Disclosures Distribution of Ratings/IB Services Firmwide and by Sector KeyBanc Capital Markets TECHNOLOGY IB Serv./Past 12 Mos. IB Serv./Past 12 Mos. Rating Count Percent Count Percent Rating Count Percent Count Percent BUY [AB/BUY] HOLD [HOLD] SELL [UND/SELL] 17 11 1 56.67 36.67 3.33 0 2 0 0.00 18.18 0.00 BUY [AB/BUY] HOLD [HOLD] SELL [UND/SELL] 167 167 10 48.55 48.55 2.91 44 26 0 26.35 15.57 0.00 Company Note June 28, 2006


4 Rating System AGGRESSIVE BUY (1) - The security is expected to outperform the market over the short term; investors should consider adding the security to their portfolios, subject to their overall diversification requirements. BUY (2) - The security is expected to outperform the market over the long term; investors should consider adding the security to their holdings opportunistically, subject to their overall diversification requirements. HOLD (3) - The security is expected to perform in line with general market indices; no buy or sell action is recommended at this time. UNDERWEIGHT (4) - The security is expected to underperform the market; investors should reduce their holdings opportunistically. SELL (5) - Absolute downside risk is evident for the security; investors should liquidate their holdings. The information contained in this report is based on sources considered to be reliable but is not represented to be complete and its accuracy is not guaranteed. The opinions expressed reflect the judgment of the author as of the date of publication and are subject to change without notice. This report does not constitute an offer to sell or a solicitation of an offer to buy any securities. Our company policy prohibits research analysts and members of their families from owning securities of any company followed by that analyst, unless otherwise disclosed. Our officers, directors, shareholders and other employees, and members of their families may have positions in these securities and may, as principal or agent, buy and sell such securities before, after or concurrently with the publication of this report. In some instances, such investments may be inconsistent with the opinions expressed herein. One or more of our employees, other than the research analyst responsible for the preparation of this report, may be a member of the Board of Directors of any company referred to in this report. The research analyst responsible for the preparation of this report is compensated, based in part, on investment banking revenue which may include revenue derived from the Firm's performance of investment banking services for companies referred to in this report, although such compensation is not based upon specific investment banking services transactions for these or any other companies. In accordance with industry practices, our analysts are prohibited from soliciting investment banking business for our Firm. © Copyright 2006, McDonald Investments Inc. All rights reserved. Securities, mutual funds and other investment products are: Not Insured by the FDIC. Not deposits or other obligations of, or guaranteed by McDonald Investments Inc., KeyBank or any of their affiliates. Subject to investment risks, including possible loss of the principal amount invested. Company Note June 28, 2006


Appendix 9


ANALYST CERTIFICATION AND REQUIRED DISCLOSURES BEGIN ON PAGE 7 1 *Rating/return divergence; See page 8 UBS does and seeks to do business with companies covered in its research reports. As a result, investors should be aware that the firm may have a conflict of interest that could affect the objectivity of this report. Investors should consider this report as only a single factor in making their investment decision. Customers of UBS in the United States can receive independent, third-party research on the company or companies covered in this report, at no cost to them, where such research is available. Customers can access this independent research at www.ubs.com/independentresearch or may call +1 877-208-5700 to request a copy of this research. UBS UBS Investment Research Maximus, Inc. In-line quarter, uncertain F07 outlook The "stock is cheap" argument holds limited weight for us F3Q came in as expected, and F06 revenue guidance was unchanged as we had anticipated. The rally in shares seems to be largely predicated on valuation, but for us the continued lack of visibility on F07 estimates (largely because of uncertainty regarding the TX contract) makes this "shares are cheap" argument less compelling. Maintain Neutral 2 in absence of near-term catalysts. F07 could be another repositioning year F05 was a turnaround year and F06 has been dominated by large underperforming contracts (TX and BC) and mgmt changes. F07 guidance will not be provided until November, but CEO Montoni outlined some general repositioning efforts designed to eventually achieve 10% top-line growth and 10% oper margin. We are hardpressed to envision these targets being achieved until at least F08, in part due to TX. Near-term balance sheet events still seem unlikely Mgmt reiterated that until the TX contract is rehabilitated and repositioning efforts are well underway, MMS is unlikely to execute significant cash deployment activities (ie. buybacks, special dividend). We maintain that MMS could be a takeout candidate because of its domain expertise (govt health & human services programs), but uncertainty regarding TX could be a turnoff for possible buyers. Valuation: Maintain Neutral 2, $27 PT (DCF/14x F07E EPS) F07 EPS $1.68 up $0.02. Highlights (US$m) 09/04 09/05 09/06E 09/07E 09/08E Revenues 604 648 718 768 816 EBIT (UBS) 63 58 14 54 75 Net income (UBS) 39 37 13 37 49 EPS (UBS, US$) 1.76 1.70 0.60 1.68 2.25 Net DPS (UBS, US$) 0.00 0.30 0.40 0.40 0.40 Profitability & Valuation 5-yr hist. av. 09/05 09/06E 09/07E 09/08E EBIT margin % - 8.9 2.0 7.1 9.2 ROIC (EBIT) % - 20.8 5.5 20.4 - EV/EBITDA x - 10.3 32.1 9.3 6.9 PE (UBS) x - 19.3 50.4 17.9 13.4 Net dividend yield % - 0.9 1.3 1.3 1.3 Source: Company accounts, Thomson Financial, UBS estimates. UBS adjusted EPS is stated before goodwill-related charges and other adjustments for abnormal and economic items at the analysts' judgement. Valuations: based on an average share price that year, (E): based on a share price of US$30.08 on 03 Aug 2006 17:55 EDT Jason Kupferberg Analyst jason.kupferberg@ubs.com +1-212-713 3559 Adam B. Frisch Analyst adam.frisch@ubs.com +1-212-713 3788 Allison Heiken Associate Analyst allison.heiken@ubs.com +1-212-713 3908 4 August 2006 Trading data 52-wk. range US$39.12-23.15 Market cap. US$0.65bn Shares o/s 21.6m Free float 88% Avg. daily volume ('000) 226 Avg. daily value (US$m) 6.2 Balance sheet data 09/06E Shareholders' equity US$0.40bn P/BV (UBS) 1.6x Net cash (debt) US$0.14bn Forecast returns Forecast price appreciation -10.2% Forecast dividend yield 1.3% Forecast stock return -8.9% Market return assumption 10.0% Forecast excess return -18.9% EPS (UBS, US$) 09/06E 09/05 From To Cons. Actual Q1 0.39 0.39 0.41 0.38 Q2 0.43 0.43 0.41 0.41 Q3 (0.85) (0.55) (0.64) 0.46 Q4E 0.38 0.32 0.37 0.45 09/06E 0.35 0.60 0.54 09/07E 1.66 1.68 1.63 Performance (US$) 0 5 10 15 20 25 30 35 40 45 06/03 09/03 12/03 03/04 06/04 09/04 12/04 03/05 06/05 09/05 12/05 03/06 06/06 0 20 40 60 80 100 120 140 Price Target (US$) (LHS) Rel. S & P 500 (R HS) Stock Price (US$) (LHS) Stock Price (US$) Rel. S & P 500 Source: UBS www.ubs.com/investmentresearch This report has been prepared by UBS Securities LLC Americas Diversified Technology Services Rating Neutral 2* Unchanged Global Equity Research Price target US$27.00 Unchanged Price US$30.08 RIC: MMS.N BBG: MMS US


Maximus, Inc. 4 August 2006 UBS 2 Portfolio Manager’s Summary F3Q came in as expected (revs $2.5M above our model due to extra voter registration equipment sales, EPS in-line), and F06 revenue guidance was unchanged as we had anticipated. We think the extension of recent momentum in shares is predicated largely on valuation (13.1x F07E EPS ex cash) and takeout speculation. But for us, the continued lack of visibility on F07 estimates (largely because of uncertainty regarding the TX contract) makes this "shares are cheap" argument less compelling, and TX could also be deemed a large enough risk factor to discourage potential acquirors. In absence of near-term catalysts, we maintain our Neutral 2 rating and $27 price target. Management reiterated that until the TX contract is rehabilitated and repositioning efforts are well underway, MMS is unlikely to execute significant cash deployment activities (ie. buybacks, special dividend), which we think remains somewhat of a disappointment for investors hoping for a big balance sheet event. F05 was a turnaround year for MMS, and F06 has been dominated by large underperforming contracts (TX and British Columbia, the latter of which we have not yet seen financial improvement commensurate with operational progress) and management changes. F07 guidance will not be provided until November, but CEO Montoni outlined some general repositioning efforts designed to eventually achieve 10% top-line growth and 10% operating margin. We are hard-pressed to envision these targets being achieved until at least F08, for two primary reasons: 1) MMS has a deep hole to dig out of on the TX contract, with an unclear path to profitability, 2) MMS’ repositioning efforts include the implementation of focus on smaller/more profitable engagements, improved project execution, and internal investments in contracting, compliance, risk management, and training, which collectively could impact the core growth and earnings power of the company next year. However, we do believe this new strategic plan makes sense for the company, if it is to operate as a relatively small vendor in the increasingly competitive state/local government IT market. We also think planned divestitures (expected to represent <5% of revenues and be completed by end of C06) could be mildly accretive to top and bottom-line growth. Valuation Shares of MMS are trading at 17.9x our new F07 EPS estimate of $1.68 (vs. $1.66 prior). Excluding cash, the F07 P/E multiple is 13.1x. We maintain our 12-month price target of $27, based on a blend of 14x (near-trough multiple given enduring risk on the TX subcontract) our new F07 EPS estimate of $1.68, and our DCF model. In setting our price target, we weigh our P/E analysis at a 2:1 ratio vs. our DCF, given the uncertain prospects for the TX contract, as well as the uncertain impact of MMS’ new repositioning strategy on the company’s growth and margin profile.


Maximus, Inc. 4 August 2006 UBS 3 Guidance and estimate revisions In keeping with recent practice, MMS refrained from providing quarterly guidance, but management did affirm F06 full year revenue guidance of $710M- $725M. The F06 GAAP EPS outlook was lowered to $0.31-$0.41 from $0.57-$0.67 prior, to reflect the previously announced $0.26 legal settlement charge related to a fraudulent employee lawsuit. We expect management to provide F07 guidance on its fiscal year-end earnings call in November. For F4Q06, our revenue estimate of $188.6M is unchanged. We lowered our F4Q EPS estimate to $0.32 from $0.38, to reflect modestly higher losses on the TX and BC contracts than we previously modeled. For TX this is a timing issue as losses in F3Q were modestly less than we expected, but the F2H total is expected to be about the same as originally envisioned. Our new F06 EPS estimate of $0.59 compares with $0.35 prior, as we reclassified the previously announced F3Q $0.26 legal charge below the line. Our F07 top-line growth estimate of 7.0% is unchanged, but the slight F3Q06 upside drove a small increase in our absolute F07 revenue forecast, to $768M from $765M prior. Our F07 EPS estimate edged up to $1.68 from $1.66 prior, and more details regarding the impact of the British Columbia and Texas contracts are in Table 1. British Columbia and Texas Contract Updates MMS continues to meet service-level agreements (SLAs) on the British Columbia contract and still expects it to achieve breakeven sometime in F07, but management remains somewhat non-committal regarding specific timing. We had hoped for a more accelerated ramp in profitability on this contract considering the degree of operational improvement over the past few quarters. As a result, we are taking a more conservative approach in modeling the contract’s performance in F07 and F08. We now anticipate a loss of $(0.06) for F07 (vs. breakeven prior) and a gain of $0.08 for F08 (vs. $0.10 prior), as shown in Table 1. For the TX integrated eligibility contract, the losses this quarter were slightly less than anticipated but management still expects F2H06 losses to be between $45M-$50M due to cost overruns and deferred contract cost impairments. Since the amended subcontract with ACN has only been in place for about six weeks, management indicated that it is premature to quantify the degree of expected improvement in F07 financial performance of the contract. We continue to assume the losses for F07 will be half of F06 and then F08 will again be half of F07, as presented in Table 1.


Maximus, Inc. 4 August 2006 UBS 4 Table 1: B.C. and TX EPS estimate impacts, F06E-F08E F06E F07E F08E British Columbia contract Pre-tax income/(loss) $(5.4M) $(2.0M) $3.0M Net income/(loss) $(3.2M) $(1.2M) $1.8M EPS impact $(0.15) $(0.06) $0.08 Texas contract Pre-tax income/(loss) $(49.7M) $(24.9M) $(12.4M) Net income/(loss) $(30.2M) $(15.0M) $(7.5M) EPS impact $(1.40) $(0.69) $(0.34) Total B.C. and TX EPS impact $(1.55) $(0.75) $(0.26) Source: UBS estimates, company press release Key takeaways from the F3Q06 results: Contract awards of $277M were down 41% y/y, up 71% sequentially, and down 28% y/y on a trailing 12-month basis. Awarded but unsigned contracts were $145M in the quarter, which is up 7% sequentially but below the past four quarter average of $179M. MMS has already won or extended 16 of the 17 contracts and 11 of the 14 options up for rebid in F06. The pipeline of $1.1B was down 15% sequentially but still remains in line with the past three year average. This includes a 43% q/q decline in the number of proposals pending to $280M. Management continues to focus on improving the current contract portfolio and pursuing smaller awards, so we would not be surprised to see more tepid award levels over the next few quarters. Revenue for the quarter was $187M, up 7.5% y/y and 3.8% sequentially. This was slightly above our estimate of $184M (and consensus of $182M), however the operations segment included $12.1M in hardware delivered on a voter contract (we had expected $10M). Excluding this pass-thru, revenue would have been flat year over year and -2.9% q/q. Revenue from the British Columbia and Texas contracts were $7.3M (vs last quarter of $7.7M) and $10.2M (flat sequentially), respectively. Consulting revenue of $26.7M was slightly higher than our estimate of $25.9 but declined 2% y/y, due primarily to project timing. The Operations segment revenue of $131M was impacted by the Texas project but beat our estimate of $126M primarily due to the higher than anticipated pass-thrus, as discussed, and was up 18% y/y and 8% q/q. The Systems segment decline was worse than our cautious -8% y/y expectation (given management’s discussion last quarter). It was down 18% y/y and 11% sequentially due to some delayed projects in the ERP division and some software license sales that slipped into F4Q.


Maximus, Inc. 4 August 2006 UBS 5 Excluding the legal expense of $9.1M, operating margin of -11.6% was down from 8.7% in F3Q05 and 8% in F2Q06 but was better than our estimate of -17%. This operating loss was driven largely by the TX contract, which lost $34.3M. The Systems segment operating margin of -10.5% (vs 0.9% in F2Q06 and 8.4% in F3Q05) was pressured by additional resources needed on the previously referenced ERP system implementations. Management noted it is being more cautious towards the terms of contract terms and conditions going forward in order to prevent these issues in the future. The Consulting segment margins of 14.3% was up 300 bps q/q but down 210 bps y/y due mostly to project timing. The Operation segment operating margin of -17.6%, down from 7.5% in F2Q05, included a $34.3M pretax loss on the Texas contract ($17.1M for a deferred costs write-off and $17.2M from the contract’s operating performance) and continued losses on the British Columbia contract (however B.C. improved to a $1.1M loss from -$1.4M in F2Q06). Management is targeting a 10% operating margin for the business but no timeframe has been provided. GAAP EPS of $(0.81) was $0.04 above our estimate. On a proforma basis, excluding the $0.26 impact of the legal settlement charge in the quarter, EPS was $(0.55). This included a foreign exchange gain of $0.7M (compared to a $0.4M loss last quarter), which benefited EPS by about $0.02. Per our model, days sales outstanding (DSO) was 90 days, down 4 days q/q (which was in line with our estimate). Operating cash flow of -$0.2M was down from $11.9M in F3Q05 and is down 67% y/y on a YTD basis. Management now expects cash flow from operations for F06 to be about $16M compared to its prior guidance of +/-10 to 15% of F05 levels (which suggested $63M-$85M). MMS had about $172M of cash and marketable securities on the balance sheet as of 6/30/06, which management plans to preserve for investments in growth opportunities in the market, increased recruiting efforts and training programs, and reinvestments in business development and internal systems. Although it wasn’t discussed on the call, we continue to believe niche acquisitions (as previously suggested by CEO Rich Montoni) remain a possible use of cash. For now, MMS is shifting away from additional share repurchases or a special dividend but the Board of Directors revisits these alternatives quarterly. Within the quarter, MMS repurchased 25K shares and has another $26.3M remaining under the current authorization.


Maximus, Inc. 4 August 2006 UBS 6 Chart 1: MMS Quarterly Income Statement, FY05A-FY08E ($ in millions, except per share data) 2005 2006 2007 2008 FY Dec '05A Mar. '06A Jun '06A Sept. '06E FY Dec '06E Mar. '07E Jun '07E Sept. '07E FY Dec '07E Mar. '08E Jun '08E Sept. '08E FY A 1 Q 2 Q 3 Q 4 Q E 1 Q 2 Q 3 Q 4 Q E 1 Q 2 Q 3 Q 4 Q E Revenues Consulting Segment 100.4 23.6 26.4 26.7 26.2 102.9 24.8 27.7 26.7 27.0 106.2 26.6 29.6 27.5 28.1 111.8 year-over-year growth -6.1% -1.8% 11.8% -2.0% 3.0% 2.6% 5.0% 5.0% 0.0% 3.0% 3.2% 7.0% 7.0% 3.0% 4.0% 5.2% sequential growth NA -7.1% 11.6% 1.3% -1.9% NA -5.3% 11.6% -3.5% 1.0% NA -1.6% 11.6% -7.1% 2.0% NA as a % of total revenue 15.5% 14.5% 14.7% 14.3% 13.9% 14.3% 13.2% 14.4% 13.8% 13.9% 13.8% 13.3% 14.6% 13.4% 13.5% 13.7% Systems Segment 134.4 36.3 32.2 28.7 34.9 132.1 34.5 34.3 30.3 36.4 135.5 36.2 36.0 31.8 38.3 142.3 year-over-year growth 14.6% 10.5% -1.2% -18.3% 3.0% -1.7% -5.0% 6.5% 5.5% 4.5% 2.6% 5.0% 5.0% 5.0% 5.0% 5.0% sequential growth NA 7.2% -11.2% -11.0% 21.5% NA -1.1% -0.4% -11.8% 20.4% NA -0.6% -0.4% -11.8% 20.4% NA as a % of total revenue 20.8% 22.3% 17.9% 15.4% 18.5% 18.4% 18.4% 17.9% 15.6% 18.7% 17.7% 18.2% 17.7% 15.5% 18.4% 17.4% Operations Segment 412.8 102.8 121.2 131.2 127.5 482.7 128.5 129.7 136.4 131.3 525.9 136.2 137.4 146.0 141.8 561.5 year-over-year growth 8.7% 7.5% 23.8% 17.9% 18.0% 16.9% 25.0% 7.0% 4.0% 3.0% 9.0% 6.0% 6.0% 7.0% 8.0% 6.8% sequential growth NA -4.9% 17.9% 8.3% -2.8% NA 0.8% 0.9% 5.2% -3.8% NA 3.7% 0.9% 6.2% -2.9% NA as a % of total revenue 63.7% 63.2% 67.4% 70.3% 67.6% 67.3% 68.4% 67.6% 70.5% 67.4% 68.5% 68.5% 67.7% 71.1% 68.1% 68.8% TOTAL REVENUE 647.5 162.7 179.8 186.6 188.6 717.7 187.8 191.7 193.4 194.7 767.6 199.0 203.1 205.3 208.1 815.5 year-over-year growth 7.2% 6.7% 16.7% 7.5% 12.7% 10.8% 15.4% 6.6% 3.7% 3.3% 7.0% 5.9% 6.0% 6.1% 6.9% 6.2% sequential growth -2.8% 10.5% 3.8% 1.1% -0.4% 2.1% 0.9% 0.7% 2.2% 2.1% 1.1% 1.4% TOTAL COST OF SERVICES 467.6 118.0 134.4 176.1 146.1 574.6 140.8 143.4 144.1 144.3 572.6 145.0 148.1 149.9 151.5 594.5 as a % of total revenue 72.2% 72.5% 74.8% 94.4% 77.5% 80.1% 75.0% 74.8% 74.5% 74.1% 74.6% 72.9% 72.9% 73.0% 72.8% 72.9% TOTAL GROSS PROFIT 180.0 44.7 45.3 10.5 42.4 143.0 46.9 48.3 49.3 50.4 195.0 53.9 55.0 55.4 56.6 221.0 total gross margin 27.8% 27.5% 25.2% 5.6% 22.5% 19.9% 25.0% 25.2% 25.5% 25.9% 25.4% 27.1% 27.1% 27.0% 27.2% 27.1% Operating expenses Selling, general and administrative 120.3 31.5 30.4 31.8 33.0 126.6 34.7 35.4 34.4 34.0 138.5 36.1 36.6 35.8 35.7 144.2 as a % of total revenue 18.6% 19.3% 16.9% 17.0% 17.5% 17.6% 18.5% 18.5% 17.8% 17.5% 18.0% 18.2% 18.0% 17.4% 17.1% 17.7% Amortization of Intangibles 2.1 0.5 0.5 0.5 0.5 2.0 0.5 0.5 0.5 0.5 2.0 0.5 0.5 0.5 0.5 2.0 EBIT 57.6 12.8 14.4 (21.7) 8.9 14.4 11.7 12.4 14.4 15.9 54.5 17.3 17.9 19.1 20.5 74.8 as a % of total revenues 8.9% 7.9% 8.0% -11.6% 4.7% 2.0% 6.2% 6.5% 7.5% 8.2% 7.1% 8.7% 8.8% 9.3% 9.8% 9.2% Net interest expense/(income) and other (3.3) (1.4) (0.9) (2.2) (2.2) (6.8) (1.5) (1.5) (1.5) (1.5) (6.0) (1.7) (1.7) (1.7) (1.7) (6.8) Pretax profit 60.9 14.2 15.4 (19.5) 11.1 21.2 13.2 13.9 15.9 17.4 60.5 19.0 19.6 20.8 22.2 81.6 as a % of total revenues 9.4% 8.7% 8.6% -10.5% 5.9% 3.0% 7.0% 7.2% 8.2% 8.9% 7.9% 9.5% 9.7% 10.2% 10.6% 10.0% Income taxes 24.1 5.6 6.1 (7.7) 4.3 8.3 5.2 5.5 6.3 6.9 23.9 7.5 7.7 8.2 8.8 32.2 as a % of pretax profit 39.5% 39.5% 39.5% 39.5% 38.6% 39.0% 39.5% 39.5% 39.5% 39.5% 39.5% 39.5% 39.5% 39.5% 39.5% 39.5% Cumulative effect of accounting change Net income (incl options, net special items) 36.9 8.603 9.3 (11.8) 6.8 12.9 8.0 8.4 9.6 10.5 36.6 11.5 11.9 12.6 13.4 49.4 as a % of total revenues 5.7% 5.3% 5.2% -6.3% 3.6% 1.8% 4.3% 4.4% 5.0% 5.4% 4.8% 5.8% 5.8% 6.1% 6.4% 6.1% EPS (incl options, fully diluted) $1.70 $0.39 $0.43 ($0.55) $0.32 $0.59 $0.37 $0.39 $0.44 $0.48 $1.68 $0.53 $0.54 $0.57 $0.61 $2.25 year-over-year growth -3.4% 2.4% 4.9% -219.9% -29.8% -65.5% -5.6% -8.9% -180.5% 51.2% 187.1% 41.7% 39.3% 29.5% 26.6% 33.6% Diluted shares outstanding 21.7 21.9 21.9 21.5 21.5 21.7 21.6 21.7 21.8 21.9 21.7 21.9 22.0 22.0 22.0 21.9 Excluding options Options expense (pretax) 5.7 1.3 1.3 1.1 1.3 5.0 1.3 1.3 1.3 1.3 5.2 1.3 1.3 1.3 1.3 5.2 Options tax effect 2.2 0.5 0.5 0.4 0.5 2.0 0.5 0.5 0.5 0.5 2.1 0.5 0.5 0.5 0.5 2.1 Options expense (net tax) 3.4 0.8 0.8 0.7 0.8 3.0 0.8 0.8 0.8 0.8 3.1 0.8 0.8 0.8 0.8 3.1 Net income (excl options) 40.3 9.4 10.1 (11.2) 7.6 16.0 8.8 9.2 10.4 11.3 39.7 12.3 12.6 13.4 14.2 52.5 EPS (excl options, fully diluted) $1.86 $0.43 $0.46 ($0.52) $0.36 $0.73 $0.41 $0.42 $0.48 $0.52 $1.83 $0.56 $0.58 $0.61 $0.65 $2.39 Other special items Other items 4.2 (0.1) 0.4 5.5 Stock-based compensation expense (after-tax) 0.5 0.5 0.0 0.0 Total special items 4.2 0.5 0.4 5.5 0.0 6.4 0.0 0.0 0.0 0.0 0.0 0.0 0.0 0.0 0.0 0.0 Net income (reported) 32.6 8.1 8.9 (17.3) 6.8 6.5 8.0 8.4 9.6 10.5 36.6 11.5 11.9 12.6 13.4 49.4 as a % of total revenues 5.0% 5.0% 4.9% -9.3% 3.6% GAAP EPS (inc special items, fully diluted) $1.51 $0.37 $0.41 ($0.81) $0.32 $0.29 $0.37 $0.39 $0.44 $0.48 $1.68 $0.53 $0.54 $0.57 $0.61 $2.25 Source: Company reports and UBS estimates


Maximus, Inc. 4 August 2006 UBS 7 Maximus, Inc. Maximus provides health and human services program management, consulting services, and systems products primarily to government agencies. The company operates primarily in the U.S. and has had contracts with government agencies in all 50 states. Statement of Risk Shares of MMS involve risks and uncertainties associated with technology stocks, including pricing and competition. MMS is also subject to risks related to state/local government budgets and unpredictable spending patterns. Analyst Certification Each research analyst primarily responsible for the content of this research report, in whole or in part, certifies that with respect to each security or issuer that the analyst covered in this report: (1) all of the views expressed accurately reflect his or her personal views about those securities or issuers; and (2) no part of his or her compensation was, is, or will be, directly or indirectly, related to the specific recommendations or views expressed by that research analyst in the research report.


Maximus, Inc. 4 August 2006 UBS 8 Required Disclosures This report has been prepared by UBS Securities LLC, an affiliate of UBS AG (UBS). For information on the ways in which UBS manages conflicts and maintains independence of its research product; historical performance information; and certain additional disclosures concerning UBS research recommendations, please visit www.ubs.com/disclosures. UBS Investment Research: Global Equity Ratings Definitions and Allocations UBS rating Definition UBS rating Definition Rating category Coverage1 IB services2 Buy 1 FSR is > 10% above the MRA, higher degree of predictability Buy 2 FSR is > 10% above the MRA, lower degree of predictability Buy 48% 34% Neutral 1 FSR is between -10% and 10% of the MRA, higher degree of predictability Neutral 2 FSR is between -10% and 10% of the MRA, lower degree of predictability Hold/Neutral 45% 35% Reduce 1 FSR is > 10% below the MRA, higher degree of predictability Reduce 2 FSR is > 10% below the MRA, lower degree of predictability Sell 7% 32% 1: Percentage of companies under coverage globally within this rating category. 2: Percentage of companies within this rating category for which investment banking (IB) services were provided within the past 12 months. Source: UBS; as of 30 June 2006. KEY DEFINITIONS Forecast Stock Return (FSR) is defined as expected percentage price appreciation plus gross dividend yield over the next 12 months. Market Return Assumption (MRA) is defined as the one-year local market interest rate plus 5% (a proxy for, and not a forecast of, the equity risk premium). Predictability Level The predictability level indicates an analyst's conviction in the FSR. A predictability level of '1' means that the analyst's estimate of FSR is in the middle of a narrower, or smaller, range of possibilities. A predictability level of '2' means that the analyst's estimate of FSR is in the middle of a broader, or larger, range of possibilities. Under Review (UR) Stocks may be flagged as UR by the analyst, indicating that the stock's price target and/or rating are subject to possible change in the near term, usually in response to an event that may affect the investment case or valuation. Rating/Return Divergence (RRD) This qualifier is automatically appended to the rating when stock price movement has caused the prevailing rating to differ from that which would be assigned according to the rating system and will be removed when there is no longer a divergence, either through market movement or analyst intervention. EXCEPTIONS AND SPECIAL CASES US Closed-End Fund ratings and definitions are: Buy: Higher stability of principal and higher stability of dividends; Neutral: Potential loss of principal, stability of dividend; Reduce: High potential for loss of principal and dividend risk. UK and European Investment Fund ratings and definitions are: Buy: Positive on factors such as structure, management, performance record, discount; Neutral: Neutral on factors such as structure, management, performance record, discount; Reduce: Negative on factors such as structure, management, performance record, discount. Core Banding Exceptions (CBE): Exceptions to the standard +/-10% bands may be granted by the Investment Review Committee (IRC). Factors considered by the IRC include the stock's volatility and the credit spread of the respective company's debt. As a result, stocks deemed to be very high or low risk may be subject to higher or lower bands as they relate to the rating. When such exceptions apply, they will be identified in the Companies Mentioned table in the relevant research piece.


Maximus, Inc. 4 August 2006 UBS 9 Companies mentioned Company Name Reuters Rating Price Price date/time CACI International16 CAI.N Neutral 1 US$56.46 02 Aug 2006 19:37 EDT Convergys Corp.16 CVG.N Buy 2 US$18.95 02 Aug 2006 19:37 EDT Kanbay Inc.2,4b,6a,6b,7,16 KBAY.O Buy 2 US$15.48 02 Aug 2006 19:37 EDT Keane Inc.16 KEA.N Reduce 2 US$14.82 02 Aug 2006 19:37 EDT Maximus, Inc.16 MMS.N Neutral 2 (RRD) US$27.10 02 Aug 2006 19:37 EDT Sapient Corp.16 SAPE.O Buy 2 US$5.01 02 Aug 2006 19:37 EDT SRA International2,4a,16 SRX.N Buy 1 US$24.20 02 Aug 2006 19:37 EDT Unisys Corp.16 UIS.N Buy 2 US$5.05 02 Aug 2006 19:37 EDT Source: UBS. EDT: Eastern daylight time. 2. UBS AG, its affiliates or subsidiaries has acted as manager/co-manager in the underwriting or placement of securities of this company/entity or one of its affiliates within the past three years. 4a. Within the past three years, UBS AG, its affiliates or subsidiaries has received compensation for investment banking services from this company/entity. 4b. Within the past 12 months, UBS AG, its affiliates or subsidiaries has received compensation for investment banking services from this company/entity. 6a. This company/entity is, or within the past 12 months has been, a client of UBS Securities LLC, and investment banking services are being, or have been, provided. 6b. This company/entity is, or within the past 12 months has been, a client of UBS Securities LLC, and non-investment banking securities-related services are being, or have been, provided. 7. Within the past 12 months, UBS Securities LLC has received compensation for products and services other than investment banking services from this company/entity. 16. UBS Securities LLC makes a market in the securities and/or ADRs of this company. Unless otherwise indicated, please refer to the Valuation and Risk sections within the body of this report. Maximus, Inc. (US$) 0 5 10 15 20 25 30 35 40 45 30-Jun-03 30-Aug-03 30-Oct-03 30-Dec-03 29-Feb-04 30-Apr-04 30-Jun-04 30-Aug-04 30-Oct-04 30-Dec-04 28-Feb-05 30-Apr-05 30-Jun-05 30-Aug-05 30-Oct-05 30-Dec-05 28-Feb-06 30-Apr-06 30-Jun-06 Price Target (US$) Stock Price (US$) Neutral 2 No Rating Source: UBS; as of 2 August 2006.


Maximus, Inc. 4 August 2006 UBS 10 Global Disclaimer This report has been prepared by UBS Securities LLC or an affiliate thereof (“UBS”). In certain countries UBS AG is referred to as UBS SA. This report is for distribution only under such circumstances as may be permitted by applicable law. It has no regard to the specific investment objectives, financial situation or particular needs of any specific recipient. It is published solely for informational purposes and is not to be construed as a solicitation or an offer to buy or sell any securities or related financial instruments. No representation or warranty, either express or implied, is provided in relation to the accuracy, completeness or reliability of the information contained herein, except with respect to information concerning UBS AG, its subsidiaries and affiliates, nor is it intended to be a complete statement or summary of the securities, markets or developments referred to in the report. The report should not be regarded by recipients as a substitute for the exercise of their own judgement. Any opinions expressed in this report are subject to change without notice and may differ or be contrary to opinions expressed by other business areas or groups of UBS as a result of using different assumptions and criteria. The analysis contained herein is based on numerous assumptions. Different assumptions could result in materially different results. The analyst(s) responsible for the preparation of this report may interact with trading desk personnel, sales personnel and other constituencies for the purpose of gathering, synthesizing and interpreting market information. UBS is under no obligation to update or keep current the information contained herein. UBS relies on information barriers to control the flow of information contained in one or more areas within UBS, into other areas, units, groups or affiliates of UBS. The compensation of the analyst who prepared this report is determined exclusively by research management and senior management (not including investment banking). Analyst compensation is not based on investment banking revenues, however, compensation may relate to the revenues of UBS Investment Bank as a whole, of which investment banking, sales and trading are a part. The securities described herein may not be eligible for sale in all jurisdictions or to certain categories of investors. Options, derivative products and futures are not suitable for all investors, and trading in these instruments is considered risky. Mortgage and asset-backed securities may involve a high degree of risk and may be highly volatile in response to fluctuations in interest rates and other market conditions. Past performance is not necessarily indicative of future results. Foreign currency rates of exchange may adversely affect the value, price or income of any security or related instrument mentioned in this report. For investment advice, trade execution or other enquiries, clients should contact their local sales representative. Neither UBS nor any of its affiliates, nor any of UBS' or any of its affiliates, directors, employees or agents accepts any liability for any loss or damage arising out of the use of all or any part of this report. Additional information will be made available upon request. For financial instruments admitted to trading on an EU regulated market: UBS AG, its affiliates or subsidiaries (excluding UBS Securities LLC and/or UBS Capital Markets LP) acts as a market maker or liquidity provider (in accordance with the interpretation of these terms in the UK) in the financial instruments of the issuer save that where the activity of liquidity provider is carried out in accordance with the definition given to it by the laws and regulations of any other EU jurisdictions, such information is separately disclosed in this research report. United Kingdom and the rest of Europe: Except as otherwise specified herein, this material is communicated by UBS Limited, a subsidiary of UBS AG, to persons who are market counterparties or intermediate customers (as detailed in the FSA Rules) and is only available to such persons. The information contained herein does not apply to, and should not be relied upon by, private customers. UBS Limited is regulated by the FSA. France: Prepared by UBS Limited and distributed by UBS Limited and UBS Securities France SA. UBS Securities France S.A. is regulated by the the Autorité des Marchés Financiers (AMF). Where an analyst of UBS Securities France S.A. has contributed to this report, the report is also deemed to have been prepared by UBS Securities France S.A. Germany: Prepared by UBS Limited and distributed by UBS Limited and UBS Deutschland AG. UBS Deutschland AG is regulated by the Bundesanstalt fur Finanzdienstleistungsaufsicht (BaFin). Spain: Prepared by UBS Limited and distributed by UBS Limited and UBS Securities España SV, SA. UBS Securities España SV, SA is regulated by the Comisión Nacional del Mercado de Valores (CNMV). . Russia: Prepared and distributed by the Moscow Representative Office of UBS Cyprus Moscow Limited. Switzerland: Distributed by UBS AG to persons who are institutional investors only. Italy: Prepared by UBS Limited and distributed by UBS Limited and UBS Italia Sim S.p.A UBS Italia Sim S.p.A. is regulated by the Bank of Italy and by the Commissione Nazionale per le Società e la Borsa (CONSOB). Where an analyst of UBS Italia Sim S.p.A. has contributed to this report, the report is also deemed to have been prepared by UBS Italia Sim S.p.A South Africa: UBS South Africa (Pty) Limited (Registration No. 1995/011140/07) is a member of the JSE Limited, the South African Futures Exchange and the Bond Exchange of South Africa. UBS South Africa (Pty) Limited is an authorised Financial Services Provider. United States: Distributed to US persons by either UBS Securities LLC or by UBS Financial Services Inc., subsidiaries of UBS AG; or by a group, subsidiary or affiliate of UBS AG that is not registered as a US broker-dealer (a “non-US affiliate”), to major US institutional investors only. UBS Securities LLC or UBS Financial Services Inc. accepts responsibility for the content of a report prepared by another non-US affiliate when distributed to US persons by UBS Securities LLC or UBS Financial Services Inc. All transactions by a US person in the securities mentioned in this report must be effected through UBS Securities LLC or UBS Financial Services Inc., and not through a non-US affiliate. Canada: Distributed by UBS Securities Canada Inc., a subsidiary of UBS AG and a member of the principal Canadian stock exchanges & CIPF. A statement of its financial condition and a list of its directors and senior officers will be provided upon request. Hong Kong: Distributed by UBS Securities Asia Limited. Singapore: Distributed by UBS Securities Pte. Ltd or UBS AG, Singapore Branch. Japan: Distributed by UBS Securities Japan Ltd to institutional investors only. Australia: Distributed by UBS AG (Holder of Australian Financial Services Licence No. 231087) and UBS Securities Australia Ltd (Holder of Australian Financial Services Licence No. 231098) only to “Wholesale” clients as defined by s761G of the Corporations Act 2001. New Zealand: Distributed by UBS New Zealand Ltd. © 2006 UBS. All rights reserved. This report may not be reproduced or redistributed, in whole or in part, without the written permission of UBS and UBS accepts no liability whatsoever for the actions of third parties in this respect.


Appendix 10


Current Price $28.40 Cash ($MM) $178 FY (Sep) 2006e was 2007e was 52 Week Range $22.35 - $39.46 Total Debt ($MM) $0 Q1 Dec $0.42 a Shares Out FD (MM) 21.9 Net Debt/Cap 0% Q2 Mar $0.43 a Float (MM) 22 Return on Equity 2% Q3 Jun ($0.07)a Average Daily Vol. 122K Est. 3-5 yr Rev growth 6-8% Q4 Sep $0.42 $0.36 Market Cap ($MM) $622 Est. 3-5 yr EPS growth 10-15% Year $1.20 $1.15 $1.50 Enterprise Value ($MM) $444 Dividend Yield 1% P/E 23.6X 18.9X Mgmt/Director Ownership 1.2% Book Value per Share $18.44 EV/ EBITDA 21.5X 7.6X *ex one time legal Charges Financial Metrics Pro-Forma Earnings Per Share Charles Strauzer cstrauzer@cjs-securities.com PLEASE REFER TO THE LAST PAGE OF THIS REPORT FOR IMPORTANT DISCLOSURES, ANALYST CERTIFICATION AND PRICE CHART. Excluding some on-going Texas contract expenses and the positive impact of a legal settlement, fourth (Sept) quarter, FY 06 results at MAXIMUS essentially “beat” expectations. Reported revenue in the fourth quarter rose 2.7% y/y to $171mm, with net income of $2.2mm resulting in $0.09 per diluted share. Pre tax losses from the Texas contract, however, totaled $12.7mm or $0.36 per share. Adding back the $0.36 and deducting the $0.03 legal settlement reimbursement results in an “adjusted” fourth quarter EPS of $0.42 vs. our $0.36 estimate. One additional item in the quarter was the deferral of $10mm in revenue in software license revenue to FY07 ($0.22 EPS impact). If this were included, EPS would have been even higher. Most questions on the call were centered on whether this change was indicative of the auditors questioning how conservative the prior accounting policies were. Many companies have undertaken this battle in the current regulatory environment and chosen to accept more stringent criteria. On a full year basis, reported EPS of $0.11 was impacted by $0.27 in legal settlement expenses, and $1.37 related to the Texas contract. Adding back these charges results in an adjusted FY06 EPS of $1.76. We believe this is the base number that investors should focus on and the starting point for our fiscal (Sept) 2007 estimates. C J S S E C U R I T I E S 50 MAIN ST WHITE PLAINS NY 10606 Telephone (914) 287-7600 MAXIMUS MARKET OUTPERFORM NOVEMBER 16, 2006 (MMS-$28.40:NYSE) P-TARGET: $34 COMPANY UPDATE · ADJUSTING FOR NOISE, QUARTER BEAT EXPECTATIONS · $10MM IN DEFERRED SOFTWARE LICENSE REVENUE SHIFTS $0.22 EPS INTO FY 07 · TEXAS CONTRACT CREATES WIDE RANGE IN 07 GUIDANCE: MMS CURRENTLY IN NEGOTIATIONS WITH ACCENTURE REGARDING FURTHER CHANGE IN SCOPE · CORE BUSINESS ON TRACK FOR 8-10% REV GROWTH, MORE RAPID EPS · ROBUST BACKLOG, PIPELINE OF BIDDING OPPORTUNITIES · BALANCE SHEET REMAINS STRONG WITH ~$7/SHARE IN CASH · MAINTAIN MO ASSUMING MGT CAN RESOLVE OVERHANG ISSUES


CJS SECURITIES, INC. MAXIMUS 11-16-06 Charles Strauzer cstrauzer@cjs-securities.com While adjusted EPS continues to reflect strength in the core business, investors are clearly focused on Texas and the potential outcome of additional negotiations with Accenture over the scope of the work. As a reminder Accenture is the prime contractor and MMS is functioning in a subcontractor role. Numerous questions in the conference call Q&A centered on the issue but were met with a general reluctance on the part of management to comment. They were unwilling to discuss basic issues like who initiated the discussions, was there pressure from the state to change roles of either of the parties, is either party looking to exit the contract, etc, etc. While losses from Texas are currently tracking in-line with management’s previous guidance (total pre-tax loss of $49.4mm in FY06) it is clear that the spectrum of potential outcomes creates wide variability in FY07 guidance. At this point, the best guess for the impact is an additional $20-$30mm, most of which is expected to be incurred early in the year. Management is addressing this uncertainty by providing “core” estimates from the recurring base business, minus the outcome from the Texas contract. Using core earnings of $2.10-$2.20, management is forecasting total company EPS of between $1.25 and $1.65 in FY07, the large spread being the result of a $0.85-$0.55 estimated negative impact from Texas. Revenues are expected to increase by 5%-10%; however, if this number is adjusted to reflect nearly $11mm of “one-time” revenue from voter machines, the growth rate is 11% yr/yr. Management is anticipating 25mm of operating cash flow in 07, and after 13-18mm of capital spending expects to generate roughly $10mm in FCF. We remind clients that trends in the underlying business are strong. The company had a 98% win rate of all options and re-bids in FY 06, and currently has a robust pipeline of over $1 billion. Industry trends also remain favorable with Medicare reform, federal reporting requirements, and other legislative changes driving demand across all segments. The company continues to enjoy a stellar reputation as a “blue chip” provider, with high client satisfaction and a proven ability to solve complex problems for governments. In terms of on-going profitability initiatives, the Company has begun to execute on its plan to divest non-core operations. In October, management sold the Corrections practice and shut down the student loans collections business (combined annual operating loss of over $1mm). We continue to believe that if the company can get to its previously stated goal of 10% top line growth at 10%+ operating margins within the next few years, earnings growth could be substantial. Additionally, a greater emphasis is being placed on applying more stringent criteria to new and re-bid contract opportunities. CEO Rich Montoni has stated the company will no longer “chase revenue” and will seek to concentrate on the core $50-100mm contracts where it has expertise. The company’s cash hoard remains intact at just over $155mm or ~$7/share but management remains on the sidelines in using it to buyback stock given the current uncertainty in Texas and the need to maintain certain cash levels for contract surety. One negative was that DSO’s in the quarter increased to 108 days, driven primarily by software licensing billing and seemingly one-time Texas contractor issues. With no meaningful debt, other than minor capital leases, the balance sheet remains vastly under-utilized and once the Company gets the Texas contract under control we would expect it to resume using its cash to enhance shareholder value (hopefully sooner than later). As we have said before investors may be willing to give Montoni a few quarters to get things back on track but beyond that if tangible improvement to shareholder value does not surface, patience will likely to wear thin, especially with activist type investors now in the stock. We remain at market outperform as we believe long term valuation could work higher if the company can muddle through some near term issues and return the company to solid earnings growth. While the


CJS SECURITIES, INC. MAXIMUS 11-16-06 Charles Strauzer cstrauzer@cjs-securities.com company has stated it will refrain from share repurchase until after it has a better handle on the resolution for its Texas contract, it does have significant fire power once it returns to the market. In sum, the risk/reward balance remains favorable. Year Ago Actual Current Quarter Actual Current Q Estimate Better/ Q4 9/05a % Revs Q4 9/06e % Revs Y/Y Q4 9/06e % Revs (Worse) Segment Revenues Consulting 25.4 15.2% 26.1 15.2% 2.7% 26.5 14.2% -1.3% Systems 33.9 20.2% 30.0 17.5% -11.4% 35.7 19.2% -16.0% Operations 108.0 64.6% 115.7 67.3% 7.1% 124.3 66.7% -6.9% Total Revenue 167.3 100.0% 171.8 100.0% 2.7% 186.4 100.0% -7.8% Income from Operations Consulting 4.5 17.8% 5.2 19.8% 14.4% 2.9 11.1% 76.0% Systems 1.4 4.2% (2.0) -6.7% -241.7% 1.7 4.8% -218.1% Operations 10.0 9.3% (2.9) -2.5% -129.4% 6.5 5.2% -145.3% Consolidating Adjustments (0.6) 0.5 -175.1% 0.7 -29.8% Total Income from Operations 15.3 9.2% 0.7 0.4% -95.6% 11.8 6.3% -94.3% Revenue 167.3 100.0% 171.8 100.0% 2.7% 186.4 100.0% -7.8% Gross Profit 44.6 26.7% 35.6 20.7% -20.1% 43.8 23.5% -18.6% Selling, General & Administrative (28.2) -16.8% (35.0) -20.3% 24.1% (32.0) -17.2% -8.4% EBIT 10.9 6.5% 1.6 0.9% -85.5% 11.8 6.3% -86.6% Interest Income 1.3 0.8% 1.7 1.0% 28.3% 1.3 0.7% 29.6% Pretax Income 12.2 7.3% 3.3 1.9% -73.3% 13.1 7.0% -75.0% Taxes (4.8) -2.9% (1.3) -0.7% NM (5.2) -2.8% 305.7% Tax Rate 39.5% NA 39.0% NA -0.5% 39.5% NA 0.5% Net Income $7.4 4.4% $2.0 1.2% -73.1% $7.9 4.2% -74.8% EPS (Fully Diluted) Ex Items 0.42 $ 0.36 $ EBITDA 16.5 9.9% 8.2 4.8% -50.4% 17.4 9.3% -52.9% Depreciation & Amortization 5.6 3.3% 5.2 3.0% -7.4% 4.2 2.2% -19.2% Source: CJS Securities Estimates, Company Documents MAXIMUS Actual vs. Estimates for Q4 9/06e (in MMs except EPS)


CJS SECURITIES, INC. MAXIMUS 11-16-06 IMPORTANT DISCLOSURES Valuation Methodology: 7.5X 2007E EV/EBITDA Investment Risks: State budget cuts/reductions, management execution, competition, general macro economic factors, timing of contracts, inability to reduce costs in underperforming units, cost over-runs in fixed price contracts, penalties for non-performance, acquisitions. CJS Securities, Inc. Equity Research rating system Market Outperform (MO): a stock that should perform at least 15% better than the Russell 2000 index over the next 6-18 months Market Perform (MP): a stock that should perform in line with or slightly better than the Russell 2000 index Market Under-Perform (MU): a stock expected to under-perform the Russell 2000 index We will continue to have some stocks on a Monitor List, where we are indicating to clients not to expect a similar level of research coverage as companies on our active coverage list. Hence, we do not have investment opinions, nor do we intend to publish estimates, on Monitor list names. As of 7/1/06, CJS Securities provides active research on 62 companies, of which 38 (61%) are rated MO(buy) and 24 (39%) are rated MP(hold) and 0 (0%) are rated MU(sell), we also have two additional companies on our Monitor List (no rating, estimates or price target). The information and statistics in this report have been obtained from sources we believe are reliable but we do not warrant their accuracy or completeness. Prices and opinions concerning the composition of market sectors included in this report reflect the judgments as of this date and are subject to change without notice. This material is for your information only and does not constitute an offer to buy or sell, or the solicitation of any offer to buy or sell any securities. CJS Securities Inc., its affiliates, directors, officers, stockholders, employees (or members of their families), and accounts with respect to which the forgoing have investment discretion, may have long or short positions in, and may, as principal or agent, buy or sell the securities mentioned herein. Occasionally, CJS Securities, Inc. may receive sales credits or fees, directly or indirectly, when an individual company under research coverage or a related peer company does an underwritten offering. CJS intends to seek commission related non-investment banking services over the next 3 months. Accordingly, the firm may have a conflict of interest that could effect the objectivity of this report. ANALYST CERTIFICATION The Research Analyst(s) who prepared the document / email hereby certify that the views expressed in this document / email COMPANY : MAXIMUS INC CURRENCY : USD HISTORY OF RECOMMENDATION AND PRICE TARGET CHANGES DATE CLOSING PRICE RECOMMENDATION CHANGE PRICE TARGET 29-Jun-2006 23.79 30.00 29-Jun-2006 23.79 MARKET OUTPERFORM 23-Nov-2005 37.00 44.00 19-Sep-2005 37.43 MARKET PERFORM 01-Jul-2005 36.00 41.00 22-Nov-2004 31.25 36.00 05-Nov-2004 28.00 39.00 08-Mar-2004 35.75 45.00 08-Mar-2004 35.75 MARKET OUTPERFORM Source: Firstcall & CJS Sec. Charles Strauzer cstrauzer@cjs -securities.com


Appendix 11


Current Price $28.93 Cash ($MM) $158 FY (Sep) 2007e was 2008e was 52 Week Range $22.35 - $37.50 Total Debt ($MM) $0 Q1 Dec ($0.48)a Shares Out FD (MM) 21.9 Net Debt/Cap 0% Q2 Mar ($0.05) Float (MM) 22 Return on Equity -4% Q3 Jun $0.40 Average Daily Vol. 210K Est. 3-5 yr Rev growth 5-8% Q4 Sep $0.47 Market Cap ($MM) $634 Est. 3-5 yr EPS growth 10-15% Year $0.35 $0.70 $1.90 $1.30 Enterprise Value ($MM) $476 Dividend Yield 1% P/E 83.6X 15.2X Mgmt/Director Ownership 1.2% Book Value per Share $18.44 EV/ EBITDA 14.2X 5.3X *ex one time legal Charges Financial Metrics GAAP Earnings Per Share Charles Strauzer cstrauzer@cjs-securities.com PLEASE REFER TO THE LAST PAGE OF THIS REPORT FOR IMPORTANT DISCLOSURES, ANALYST CERTIFICATION AND PRICE CHART. Q1 results (ex legal expense, write off of a project in Ontario and a receivables write down and normalized for tax rate) were modestly better than our lowered estimates. As a reminder we had recently cut our estimates for FY 07 in half due to the revision of the Texas TAA contract (see our 12/22/06 note for more details) and the shift in MAXIMUS’ role as subcontractor. Excluding the losses from Texas and normalizing tax rate EPS would have been $0.39. Revenue was $17mm below our estimate but again excluded $16mm of revenue that was written off. Core operations segment revenue (excluding the aforementioned items) was actually up nearly 10% y/y and performed well with a 11.7% operating margin (7.7% including Ontario). Systems segment performance suffered as it lost $1.6mm in the quarter despite hitting our sales estimate. Consulting revenue was $2.5mm below our expectations and margins were 160bps light. Management expects margins to soften in Q2 sequentially in this segment on timing of sales with margins recovering in the second half. Given that the Systems segment will likely show only modest profit as it does not expect this year to be a strong one as the sales cycle for its software products has lengthened. Consulting profits are likely to be lower y/y and the company now expects larger losses from Texas (now $45mm-55mm versus our expectation of $20-30mm). We were at the low end of consensus for FY 07 at $0.70 and with guidance now at $0.40-$0.80 (our estimates included operating losses related to Texas, guidance includes those losses plus legal expenses and receivable and Ontario write downs) we are once again cutting our FY 07 estimates in half to below the low end of guidance. Despite the wide range, we have trouble believing guidance at this point given the lingering uncertainty of C J S S E C U R I T I E S 50 MAIN ST WHITE PLAINS NY 10606 Telephone (914) 287-7600 MAXIMUS MARKET OUTPERFORM FEBRUARY 12, 2007 (MMS-$29.22:NYSE) P-TARGET: $38 WAS $31 COMPANY UPDATE • Q1 EX-ITEMS ESSENTIALLY INLINE WITH LOWERED ESTIMATES • TEXAS CONTRACT REMAINS MATERIAL OVERHANG AND MASK ON EARNINGS • CORE BUSINESS REMAINS SOUND AND SHOWING GOOD PROFITABILITY • HIGHER TX LOSSES FORCE US TO CUT FY 07 IN HALF AGAIN • RAISING 08 ESTIMATES ON ASSUMPTION TX IS RESOLVED BY EARLY C08 • MAINTAIN MKT OUTPERFORM, RAISING PRICE TARGET


CJS SECURITIES, INC. MAXIMUS 2-12-07 Charles Strauzer cstrauzer@cjs-securities.com MMS’ role in Texas and related losses. We are however raising our FY 2008 EPS to $1.90 from $1.30 (which we had lowered from $1.80 in December) even though management expects the core business generate profits north of $2.00/share this year. We arrive at this estimate for several reasons: • The company is weeding out lower margin and/or problem contracts while culling its new business pipeline by applying higher risk management standards. This approach while positive for the long term health of the company is almost certainly going to dampen top line growth over the next 12-18 months and create noise around reported profitability; • If MMS continues to perform enrollment work in Texas it will likely do so at a loss as it will still need to keep approximately 330 employees in the state (currently there are 773 FTEs on the payroll, down from 1,200 at the end of December), thus impacting Operations segment margins at least until the middle of FY 08. The 11.7% margin produced in the quarter by this segment (ex Texas and Ontario) was at the high end of management’s expectations (assuming a 10-12% range) and assuming a resolution in Texas by early calendar 08 margins should move back to 10% by FQ4; • As for the other segments we estimate flat to slightly lower margins in consulting as it we believe last year’s 14% margin was abnormally aided by a large amount of claiming revenue in Q4 (margins in FY 05 were 13.2% and we expect margins to normalize this year at ~13%). The systems segment has been operating at the lowest margin for many years and this year will be only marginally profitable. We assume only modest contribution to profits next year and in our opinion this segment is also holding back the true earnings power of the company. Systems integration work is largely generic and MMS has some proprietary software to help differentiate it from larger competitors but there have not been any significant software wins recently to help profitability. On a blended basis we come out at just over 9% operating margins. While our estimates may prove conservative given our lower degree of confidence in the company’s guidance we prefer to react positively to either a more favorable resolution to the Texas situation if/when that happens and/or to additional contract wins. Another concern we have relates to the potential financial liability related to walking away from the Texas contract. According to the 8-K filed on 6/27/06 the prime and subcontract contain limits of liability of $250mm and the company has agreed to indemnify Accenture for claims and losses for which MAXIMUS is responsible. Both sides have filed for arbitration against each other for damages in the amount of $100mm. We understand that both sides share in the performance faults of the contract and would not expect MMS to be on the hook for the entire $250mm liability should the entire contract suffer a meltdown. The dispute is likely to take more than a year to reach the arbitration panel and usually a settlement is reached before it gets that far in these cases. However, we hope and would believe Accenture wants an amicable solution given the company’s publicly stated desire to build its state BPO practice. MAXIMUS likely wants a resolution as well as it probably does not want this as a stain on a well-regarded reputation.


CJS SECURITIES, INC. MAXIMUS 2-12-07 Charles Strauzer cstrauzer@cjs-securities.com The company’s cash hoard is a nice security blanket at ~$7/share but management remains on the sidelines in using it to buyback stock given the current uncertainty in Texas and the need to maintain certain cash levels for contract surety. As we have said before investors may be willing to give the company time to get things back on track. The longer it takes to see tangible improvement to shareholder value, investor patience will likely to wear thin, especially with activist type investors now in the stock. As we said in our quarterly update we expected the TX issue to be an overhang on the stock and we continue to believe so. However, we do believe this contract will eventually get resolved and the arbitration filing could be the mechanism to finally do so. Our price target is now $38 up from $31 or 7.5X our higher FY08E EBITDA and the stock currently trading at 5.3X. The biggest risk facing the company is if it is found to have the preponderance of the fault in TX and is forced to pay material damages over and above the losses from the contract. We do however think that this is a well-disclosed possibility and likely in the stock at this point and believe long term valuation could work higher if the company can restore credibility by being able to clearly demonstrate the true earnings power of the core business.


CJS SECURITIES, INC. MAXIMUS 2-12-07 Charles Strauzer cstrauzer@cjs-securities.com MAXIMUS, Inc. (MMS) Income Statement All Figures $MM, except per share FY 2004a FY 2005a Q1 12/05a Q2 3/06a Q3 6/06a Q4 9/06a FY 2006e Q1 12/06e Q2 3/07e Q3 6/07e Q4 9/07e FY 2007e FY 2008e Revenue 603.8 647.5 162.7 179.8 186.6 171.8 700.9 161.1 178.6 189.4 181.8 711.0 745.0 % growth year-to-year 8.1% 7.2% 6.7% 16.7% 7.5% 2.7% 8.2% -1.0% -0.6% 1.5% 5.8% 1.4% 4.8% Cost of Revenue (427.7) (467.6) (118.0) (134.4) (158.8) (136.2) (547.4) (140.9) (149.7) (142.4) (133.7) (566.6) (547.7) % of Revenue 70.8% 72.2% 72.5% 74.8% 85.1% 79.3% 78.1% 87.4% 83.8% 75.2% 73.5% 79.7% 73.5% % growth year-to-year 9.2% 9.3% 9.1% 21.8% 25.6% 10.9% 17.1% 19.4% 11.3% -10.4% -1.8% 3.5% -3.3% Gross Profit 176.0 180.0 44.7 45.3 10.6 35.6 136.3 20.3 29.0 47.0 48.1 144.4 197.3 Gross Margin 29.2% 27.8% 27.5% 25.2% 5.7% 20.7% 19.5% 12.6% 16.2% 24.8% 26.5% 20.3% 26.5% % growth year-to-year 7.0% 2.2% 0.8% 3.7% -77.5% -20.1% -24.2% -54.7% -36.1% 341.6% 35.1% 5.9% 36.6% Selling, General & Administrative (113.0) (116.7) (31.6) (30.9) (32.3) (35.0) (129.7) (34.7) (32.2) (34.1) (32.7) (133.6) (134.1) % of Revenue 18.7% 18.0% 19.4% 17.2% 17.3% 20.3% 18.5% 18.0% 18.0% 18.0% 18.0% 18.8% 18.0% % Growth Year-to-Year 5.2% 3.3% 7.2% 8.9% 5.2% 24.1% 11.1% 9.8% 4.1% 5.6% -6.4% 3.0% 0.4% Write off of deferred contract costs (17.1) (17.1) (28.0) (13.0) Legal Expense 0.0 (7.0) (0.5) (0.7) (9.1) 0.9 (9.4) (3.0) (3.0) 0.0 Operating Profit 63.0 56.3 12.7 13.7 (30.8) 1.6 (2.8) (17.4) (3.2) 12.9 15.4 7.8 63.2 % of Revenue 10.4% 8.7% 7.8% 7.6% -16.5% 0.9% -0.4% -10.8% -1.8% 6.8% 8.5% 1.1% 8.5% % Growth Year-to-Year 10.5% -10.7% -14.6% -8.5% -298.9% -85.5% -105.0% -237.0% -123.2% -141.9% 873.4% -374.4% 714.7% Net Interest Income & Other 1.0 3.3 2.0 0.9 2.2 1.7 6.9 1.2 1.4 1.4 1.4 5.4 6.0 Pretax Income 64.1 59.6 14.7 14.7 (28.6) 3.3 4.0 (16.2) (1.8) 14.3 16.8 13.1 69.2 % of Revenue 10.6% 9.2% 9.0% 8.2% -15.3% 1.9% 0.6% -10.1% -1.0% 7.6% 9.2% 1.8% 9.3% % Growth Year-to-Year 9.7% -7.0% -1.6% -6.6% -271.2% -73.3% -93.2% -210.1% -112.1% -150.0% 414.2% 225.2% 427.4% Taxes (25.3) (23.6) (5.8) (5.8) 11.3 (1.3) (1.6) 5.8 0.7 (5.6) (6.6) (5.6) (27.0) Tax Rate 39.5% 39.5% 39.5% 39.5% 39.5% 39.0% 39.0% 35.9% 39.0% 39.0% 39.0% 42.8% 39.0% Net Income 38.8 36.1 8.9 8.9 (17.3) 2.0 2.5 (10.4) (1.1) 8.7 10.2 7.5 42.2 % of Revenue 6.4% 5.6% 5.5% 4.9% -9.3% 1.2% 0.4% -6.5% -0.6% 4.6% 5.6% 1.1% 5.7% % Growth Year-to-Year 9.7% -7.0% -1.6% -6.6% -271.1% -73.1% -93.2% -216.7% -112.2% -150.4% 414.2% 204.7% 462.9% Net Earnings per Share fd $ 1.76 $ 1.67 $ 0.41 $ 0.41 $ (0.81) $ 0.09 $ 0.11 $ (0.48) $ (0.05) $ 0.40 $ 0.47 $ 0.35 $ 1.90% Growth Year-to-Year 6.3% -5.4% -3.2% -7.8% -272.1% -73.4% -93.2% -218.4% -112.4% -149.9% 418.9% 206.8% 449.6% Net (Charges)/Income 0.0 (4.2) (0.3) (0.4) (15.8) (7.2) (23.8) (18.8) (7.9) 0.0 0.0 (26.6) 0.0 Pro-Forma Net Income(ex one time items) 38.8 40.3 9.2 9.3 (1.5) 9.2 26.2 8.4 6.8 8.7 10.2 34.1 42.2 Pro-Forma EPS (ex one time items) $ 1.76 $ 1.86 $ 0.42 $ 0.43 $ (0.07) $ 0.42 $ 1.20 $ 0.39 $ 0.31 $ 0.40 $ 0.47 $ 1.57 $ 1.90% Growth Year-to-Year 6.3% 5.7% -0.6% -5.3% -113.7% -15.4% -35.4% -7.9% -26.5% -688.2% 12.6% 30.9% 20.8% FAS 123R Options expense pre-tax** 0.0 0.0 1.5 1.5 1.5 1.5 5.8 1.5 1.5 1.5 1.5 5.8 5.8 FD EPS before options exp. $ 1.76 $ 1.86 $ 0.46 $ 0.47 $ (0.03) $ 0.46 $ 1.36 $ 0.43 $ 0.35 $ 0.44 $ 0.51 $ 1.73 $ 2.06% Growth Year-to-Year 6.3% 5.7% 8.9% 3.6% -105.5% -7.2% -26.7% -7.1% -24.1% -1708.2% 11.6% 26.6% 19.3% Weighted Avg. S/O (mil)-fd 22.0 21.7 21.9 21.9 21.5 21.9 21.8 21.6 21.7 21.7 21.7 21.7 22.2 EBITDA 76.2 71.4 18.3 19.3 (25.2) 8.2 20.6 (10.9) 3.3 19.4 21.8 33.6 89.0 % of Revenue 12.6% 11.0% 11.2% 10.8% -13.5% 4.8% 2.9% -6.7% 1.8% 10.2% 12.0% 4.7% 11.9% % Growth Year-to-Year 11.6% -6.3% -0.4% 4.8% -239.0% -50.4% -71.1% -159.5% -83.1% -176.9% 166.7% 63.0% 164.8% Depreciation & Amortization 13.2 15.1 4.1 4.2 4.2 5.2 17.6 5.1 5.0 5.0 5.0 20.1 20.0 % of Revenue 2.2% 2.3% 2.5% 2.3% 2.2% 3.0% 2.5% 3.1% 2.8% 2.6% 2.8% 2.8% 2.7% % Growth Year-to-Year 17.1% 15.2% 18.7% 20.9% 58.7% -7.4% 16.5% 21.9% 19.9% 19.9% -3.1% 13.6% -0.3% Source: Company Reports and CJS Securities Estimates Notes: (1) Pro-forma to include FAS 123 R option expense for years FY 05 and beyond


CJS SECURITIES, INC. MAXIMUS 2-12-07 IMPORTANT DISCLOSURES Valuation Methodology: 7.5X 2008E EV/EBITDA Investment Risks: TX contract resolution and potential liability claims, State budget cuts/reductions, management execution, competition, general macro economic factors, timing of contracts, inability to reduce costs in underperforming units, cost over-runs in fixed price contracts, penalties for non-performance, acquisitions. CJS Securities, Inc. Equity Research rating system Market Outperform (MO): a stock that should perform at least 15% better than the Russell 2000 index over the next 6-18 months Market Perform (MP): a stock that should perform in line with or slightly better than the Russell 2000 index Market Under-Perform (MU): a stock expected to under-perform the Russell 2000 index We will continue to have some stocks on a Monitor List, where we are indicating to clients not to expect a similar level of research coverage as companies on our active coverage list. Hence, we do not have investment opinions, nor do we intend to publish estimates, on Monitor list names. As of 1/4/07, CJS Securities provides active research on 63 companies, of which 39 (62%) are rated MO (buy) and 24(38%) are rated MP (hold) and 0 (0%) are rated MU (sell), we also have two additional companies on our Monitor List (no rating, estimates or price target). The information and statistics in this report have been obtained from sources we believe are reliable but we do not warrant their accuracy or completeness. Prices and opinions concerning the composition of market sectors included in this report reflect the judgments as of this date and are subject to change without notice. This material is for your information only and does not constitute an offer to buy or sell, or the solicitation of any offer to buy or sell any securities. CJS Securities Inc., its affiliates, directors, officers, stockholders, employees (or members of their families), and accounts with respect to which the forgoing have investment discretion, may have long or short positions in, and may, as principal or agent, buy or sell the securities mentioned herein. Occasionally, CJS Securities, Inc. may receive sales credits or fees, directly or indirectly, when an individual company under research coverage or a related peer company does an underwritten offering. CJS intends to seek commission related non-investment banking services over the next 3 months. Accordingly, the firm may have a conflict of interest that could effect the objectivity of this report. ANALYST CERTIFICATION The Research Analyst(s) who prepared the document / email hereby certify that the views expressed in this document / email accurately reflect the analyst(s) personal views about the subject companies and their securities. The Research Analyst(s) also certify that the Analyst(s) have not been, are not, and will not be receiving direct or indirect compensation for expressing the specific recommendation(s) or view(s) in this report. Reprints and/or redistribution of CJS Securities, Inc. reports are strictly prohibited without permission. Copyright 2007, CJS Securities, Inc. Additional information is available upon request. COMPANY : MAXIMUS INC CURRENCY : USD HISTORY OF RECOMMENDATION AND PRICE TARGET CHANGES DATE CLOSING PRICE RECOMMENDATION CHANGE PRICE TARGET 22-Dec-2006 29.77 31.00 07-Aug-2006 27.85 34.00 29-Jun-2006 23.79 30.00 29-Jun-2006 23.79 MARKET OUTPERFORM 23-Nov-2005 37.00 44.00 19-Sep-2005 37.43 MARKET PERFORM 01-Jul-2005 36.00 41.00 22-Nov-2004 31.25 36.00 05-Nov-2004 28.00 39.00 08-Mar-2004 35.75 45.00 08-Mar-2004 35.75 MARKET OUTPERFORM Source: Firstcall & CJS Sec. Charles Strauzer cstrauzer@cjs-securities.com


Appendix 12


FOR IMPORTANT DISCLOSURES AND CERTIFICATIONS, PLEASE REFER TO PAGES 3 - 4 OF THIS NOTE. 1 ACTION STATEMENT This morning, MMS announced its earnings results for 2Q07, with total revenue and EPS that came in above our and the Street estimates. Total revenue in the quarter was $179.1 million, which exceeded our estimate of $172.6 million and the Street forecast of $177.7 million. EPS in the quarter were $0.11, ahead of our forecast of $0.04 and the Street estimate of a loss of $0.01. The Texas contract had a negative impact of approximately $0.18 on the bottom line, while provision for legal expenses diluted the earnings by approximately $0.16. Excluding these losses, EPS in the quarter were $0.45. New sales awards as of May 2, 2007, were approximately $302 million compared to $292 million last year. We view this as a positive, given somewhat weak bookings in the 1Q07 ($80 million compared to $130 million in 1Q06). Additionally, the Company stated in its press release that it expects Texas to be profitable from 3Q07 (current quarter) onward. More importantly, the Company increased its guidance for the full year to total revenues in the range of $740 million-$770 million (up from $710 million-$730 million) and EPS in the range of $0.85-$0.95 (up from $0.40-$0.80). The Company also gave guidance for FY08 with a revenue growth rate of 10% and EPS in the range of $2.30-$2.60. This compares to the current Street estimate of a revenue growth rate of 6.2% and EPS of $2.01 and our estimate of a revenue growth rate of 5.0% and EPS of $2.20. Currently, the Company has cash of approximately $8.07 per diluted share on its balance sheet (up from $7.60 per diluted share in the prior quarter). We maintain our BUY (2) rating on the stock, as well as our price target of $37.00. We will be revisiting our estimates, rating, and price target after the conference call, which is scheduled for 9:00 am (dial in: 800-552-8050). VALUATION Currently, MMS trades at P/E multiples of 26.5x our CY07 and 16.4x our CY08 estimates compared to its peer group median of 22.6x and 16.6x, respectively. On a cash-adjusted basis, the current valuation appears to us to be even more attractive at a P/E multiple of 12.9x our CY08 numbers. At our price target of $37, MMS would trade at a P/E multiple of 16.8x our CY08 estimates. RISKS Risk factors that could impede the shares from achieving our price target include spending curtailment among state governments, execution risk on large contracts and price competition. May 9, 2007 KeyBanc TECHNOLOGY: IT Services Capital Markets MAXIMUS, Inc.: MMS: 2Q07 Results Ahead of Expectations; Guidance Increased; Maintain BUY KeyBanc Capital Markets Inc. Member NYSE/NASD/SIPC Anurag Rana: (917) 368-2213 — arana@keybanccm.com Investors should assume that we are seeking or will seek investment banking or other business relationships with the company described in this report. Rating BUY (2) Price $36.00 12-Mo. Price Target $37.00 Dividend $0.40 Yield 1.1% 52-Wk. Range $22-$36 Trading Volume 205,000 Market Cap. (mm) $770.4 Shares Out. (mm) 21.40 Book Value $18.27 Fiscal Year End September 2008E $2.20 2007E $0.40 2006A $0.11 2008 P/E 16.4x 2007 P/E 90.0x First Call 2008E $2.01 First Call 2007E $0.42 Next Quarter March Estimate $0.04 Vs. $0.41 First Call Estimate ($0.01)


2 EPS (Net) Summary 2006A %CHG 2007E %CHG 2008E %CHG 1Q $0.41 -2.4% $(0.48)A NM -- -- 2Q $0.41 -6.8% $0.04 -90.2% -- -- 3Q $(0.81) NM $0.35 NM -- -- 4Q $0.09 -81.6% $0.49 444.4% -- -- YEAR $0.11 -94.0% $0.40 263.6% $2.20 450.0% Source: KeyBanc Capital Markets Inc. estimates Company Note May 9, 2007


3 KeyBanc Capital Markets Inc. Disclosures and Certifications MAXIMUS, Inc. - MMS We expect to receive or intend to seek compensation for investment banking services from MAXIMUS, Inc. within the next three months. Reg A/C Certification The research analyst(s) responsible for the preparation of this research report certifies that:(1) all the views expressed in this research report accurately reflect the research analyst's personal views about any and all of the subject securities or issuers; and (2) no part of the research analyst's compensation was, is, or will be directly or indirectly related to the specific recommendations or views expressed by the research analyst(s) in this research report. Three-Year Rating and Price Target History Q2 Q3 Q1 Q2 Q3 Q1 Q2 Q3 Q1 15 20 25 30 35 40 2005 2006 2007 06/28/05 B:$40 08/05/05 B:$42 02/03/06 B:$45 06/27/06 B:$38 12/26/06 B:$34 03/14/07 B:$37 Rating and Price Target History for: MAXIMUS, Inc. (MMS) as of 05-08-2007 Created by BlueMatrix Rating Disclosures Distribution of Ratings/IB Services Firmwide and by Sector KeyBanc Capital Markets IB Serv/Past 12 Mos. Rating Count Percent Count Percent BUY [BUY/AB] 125 44.02 36 28.80 HOLD [HOLD] 154 54.23 37 24.03 SELL [UND/SELL] 5 1.76 0 0.00 TECHNOLOGY IB Serv/Past 12 Mos. Rating Count Percent Count Percent BUY [BUY/AB] 6 50.00 2 33.33 HOLD [HOLD] 6 50.00 1 16.67 SELL [UND/SELL] 0 0.00 0 0.00 Company Note May 9, 2007


4 Rating System AGGRESSIVE BUY (1) - The security is expected to outperform the market over the short term; investors should consider adding the security to their portfolios, subject to their overall diversification requirements. BUY (2) - The security is expected to outperform the market over the long term; investors should consider adding the security to their holdings opportunistically, subject to their overall diversification requirements. HOLD (3) - The security is expected to perform in line with general market indices; no buy or sell action is recommended at this time. UNDERWEIGHT (4) - The security is expected to underperform the market; investors should reduce their holdings opportunistically. SELL (5) - Absolute downside risk is evident for the security; investors should liquidate their holdings. The information contained in this report is based on sources considered to be reliable but is not represented to be complete and its accuracy is not guaranteed. The opinions expressed reflect the judgment of the author as of the date of publication and are subject to change without notice. This report does not constitute an offer to sell or a solicitation of an offer to buy any securities. Our company policy prohibits research analysts and members of their families from owning securities of any company followed by that analyst, unless otherwise disclosed. Our officers, directors, shareholders and other employees, and members of their families may have positions in these securities and may, as principal or agent, buy and sell such securities before, after or concurrently with the publication of this report. In some instances, such investments may be inconsistent with the opinions expressed herein. One or more of our employees, other than the research analyst responsible for the preparation of this report, may be a member of the Board of Directors of any company referred to in this report. The research analyst responsible for the preparation of this report is compensated, based in part, on investment banking revenue which may include revenue derived from the Firm's performance of investment banking services for companies referred to in this report, although such compensation is not based upon specific investment banking services transactions for these or any other companies. In accordance with industry practices, our analysts are prohibited from soliciting investment banking business for our Firm. © Copyright 2007, KeyBanc Capital Markets Inc. All rights reserved. Securities, mutual funds and other investment products are: • Not Insured by the FDIC. • Not deposits or other obligations of, or guaranteed by KeyBanc Capital Markets Inc., KeyBank, N.A. or any of their affiliates. • Subject to investment risks, including possible loss of the principal amount invested. Company Note May 9, 2007


Appendix 13


Please see important disclosure information on pages 6 - 8 of this report. Event Maximus is exploring strategic alternatives, including the sale of the business. The company also plans to take a $33MM pre-tax charge due to a settlement with the federal government concerning the company's Medicaid claiming work for the District of Columbia. Excluding this charge management reiterated full year guidance. Key Points • Why consider selling the business when recent results don't reflect future potential? Maximus is on the cusp of improving results due to the exit of problem contracts and better internal execution, in our view. The impact of these changes to potential growth and returns is impossible for investors to fully grasp until a few clean quarters are reported. We estimate reported EPS likely steps up significantly from negative $0.94 over the past twelve months, including the June quarter, to positive $2.36 over the forward twelve months. However the recent earnings volatility likely causes potential bidders to haircut these projections or utilize a relatively high discount rate. There is a significant disconnect right now between what management knows and what investors can perceive—a disadvantage to current investors, in our view. • So what is Maximus worth on a takeout? After excluding earnings from the discontinued Texas and Ontario contracts and other one-time charges (we said it has been messy), we estimate F2007 EPS comes in around $2.15 (above guidance on February 8 of $2.00-2.10). Normalized EPS of $2.15 implies EBITDA of approximately $95MM, assuming a 40% tax rate and $21MM of D&A. Earlier this year Keane, Inc. was acquired for $854MM, or a little over 10x C06 EBITDA, for flattish performance. A 10x multiple on $95MM implies a $51 stock price, after including $175MM of cash (post settlement payment). Valuation/Risks The EV of Maximus (assuming $175MM of cash after the DC settlement payment) is about 7.5x our C2008 EBITDA estimate of $108.6MM (about 15% growth from normalized 2007). Alternatively, MMS trades at 17x our C08 EPS estimate of $2.56. By both valuation metrics we believe MMS remains attractive, especially considering the likelihood of accelerated earnings and cash flow growth over the next year due to the completion of a turnaround. ROIC should recover to the mid-teens and perceived risk likely continues to dissipate over the next year. These dynamics imply healthy stock performance over the next year. The key risk is poor execution on the sale of the business that does not maximize shareholder value, in our view. Please see the attached DCF model to understand the operating assumptions supporting our $51 PT. Impact on Other Companies N/A July 25, 2007 Technology IT Services Company Update Price Target Change Estimate Change MAXIMUS (NYSE: MMS) Potential Full Value Realization Unlikely Investment Summary If bought, Maximus should be worth $51, by our analysis. That said, the timing of a potential sale of the business is quite poor and probably depresses the take-out price because of the "story" of large charges inflating perceived risks and obscuring business trends, making valuing the business challenging. Rating: BUY Price: $44.39 Price Target: $51.00 Previous: $50.00 Bloomberg: NYSE: MMS Market Data 52-Week Range: $45.48-$25.33 Total Entprs. Value (MM): $801.8 Market Cap. (MM): $976.6 Shares Out. (MM): 22.0 Avg. Daily Vol.: 190,017 Financial Summary Book Value (MM): $399.6 Net Debt (MM): ($174.8) Net Debt/Capital: 0.0% ROE: 12.6% 3-5 Yr. Est. EPS Growth Rate: 15.0% ROIC: 13.4% Lg-Trm Debt to Eqty: 2% ROE: Estimate for FYE 2008 ROIC: Estimate for FYE 2008 USD 2005A 2006E 2007E 2008E Rev. (MM) 647.5 700.9 750.2 825.2 EV/Rev. 1.2x 1.1x 1.1x 1.0x EPS Cal. 1.66 (0.79) 1.80 2.56 Cal. P/E 26.7x NM 24.7x 17.3x EPS Diluted Dec — 0.41 (0.48)A — Mar — 0.41 0.11A — Jun — (0.81) (0.66) — Prev. -- -- 0.65 -- Sep — 0.09 0.62 — FY Sep — 0.11 (0.42) 2.45 Prev. FY -- -- 0.90 -- FY P/E NM NM NM 18.1x GAAP EPS. Consensus — 0.11 0.42 2.01 Matthew G. McKay, CFA (617) 342-7909, mmckay@Jefferies.com


Please see important disclosure information on pages 6 - 8 of this report. Matthew G. McKay, CFA, mmckay@Jefferies.com, (617) 342-7909 Page 2 of 8 Company Description MAXIMUS was incorporated in 1975, has been publicly traded since 1997, and is based in Reston, Virginia. The company offers services primarily to state and local governments, as well as the federal government. In fiscal 3Q04 management reorganized the company into three business segments: health services, human services, and technical services. The main drivers of the business are program management and outsourcing of health and human services that are federally mandated and funded. In addition, the company is positioned to take advantage of legislative actions encouraging state and local spending on modernization of voting technology, improving port security, and offering improved educational services. MAXIMUS is a member of the Russell 2000 and S&P 600 SmallCap index. (NYSE:MMS) Jefferies & Company, Inc.


Please see important disclosure information on pages 6 - 8 of this report. Matthew G. McKay, CFA , mmckay@Jefferies.com, (617) 342-7909 Page 3 of 8 Maximus, Inc. 2005-2008E Profit and Loss Model ($ in millions, except per share) -------------------------F2006A-------------------------- ---------------------------------F2007E---------------------------------- (FY End September) F2005A Q1A Q2A Q3A Q4A F2006A Q1A Q2A Q3E Q4E F2007E F2008E C2006A C2007E C2008E Income Statement Data Revenue 647.5 162.7 179.8 186.6 171.8 700.9 161.1 179.1 209.0 201.0 750.2 825.2 699.3 766.3 843.0 Cost of revenue 467.6 118.0 134.4 158.9 136.2 547.5 140.9 136.2 152.6 145.7 575.4 600.6 570.4 563.9 612.6 Gross Income 180.0 44.7 45.3 27.7 35.6 153.4 20.3 42.9 56.4 55.3 174.9 224.6 128.9 202.4 230.4 Selling, general & administrative 116.7 31.6 30.9 32.3 35.0 129.7 34.7 34.5 35.1 34.8 139.0 141.7 132.8 138.5 143.5 Amortization of intangibles 0.0 0.0 0.0 0.0 0.0 0.0 0.0 0.0 0.0 0.0 0.0 0.0 0.0 0.0 0.0 Other 7.0 0.5 0.7 26.2 (0.9) 26.5 3.0 6.1 33.0 0.0 42.1 0.0 29.0 39.1 0.0 Total operating expenses 591.3 150.1 166.0 217.4 170.2 703.7 178.5 176.8 220.7 180.5 756.4 742.3 732.2 741.5 756.1 Op Inc - Exc Options & One-time 63.3 13.2 14.4 (4.6) 0.7 23.7 (14.4) 8.4 21.3 20.5 35.9 83.0 (3.9) 63.9 86.9 Interest income, net 3.3 2.0 0.9 2.2 1.7 6.9 0.5 1.6 1.7 1.7 5.5 7.4 5.3 6.8 7.6 Other, net 0.0 0.0 0.0 0.0 0.0 0.0 0.7 0.0 0.0 0.0 0.7 0.0 0.7 0.0 0.0 Pretax income - Operating 66.6 15.2 15.4 (2.4) 2.4 30.5 (13.2) 10.0 23.0 22.2 42.0 90.3 2.1 70.7 94.4 Taxes - Operating 26.4 6.0 6.1 (1.0) 0.9 11.9 (4.7) 4.0 9.1 8.8 17.1 35.7 1.3 28.0 37.3 Cumulative effect accounting change 0.0 0.0 0.0 0.0 0.0 0.0 0.0 0.0 0.0 0.0 0.0 0.0 0.0 0.0 0.0 N.I. - Exc. One-time, Options & Div 40.2 9.2 9.3 (1.5) 1.4 18.6 (8.5) 6.0 13.9 13.4 24.9 54.6 0.8 42.7 57.1 Diluted EPS - Operating $1.86 $0.42 $0.43 ($0.07) $0.07 $0.85 ($0.39) $0.27 $0.63 $0.61 $1.13 $2.45 $0.03 $1.93 $2.56 Diluted EPS - Reported $1.67 $0.41 $0.41 ($0.81) $0.09 $0.11 ($0.48) $0.11 ($0.66) $0.62 ($0.42) $2.45 ($0.79) $0.48 $2.56 Diluted Shares Outstanding 21.7 21.9 21.9 21.5 21.0 21.8 21.6 22.0 22.1 22.2 22.0 22.3 21.5 22.1 22.3 Growth Revenue 7.2% 6.7% 16.7% 7.5% 2.7% 8.2% (1.0)% (0.4)% 12.0% 17.0% 7.0% 10.0% 6.3% 9.6% 10.0% Operating income (1.4)% (11.3)% (6.2)% (128.0)% (95.9)% (62.6)% (209.1)% (41.7)% N/A 2946.4% 51.5% 131.3% N/A N/A 35.9% Net income 2.0% 1.6% (4.3)% (113.7)% (86.6)% (53.7)% (192.1)% (35.3)% N/A 834.4% 33.7% 119.4% (98.0)% 5125.3% 33.8% EPS - Operating 3.7% (0.0)% (5.5)% (113.8)% (86.1)% (54.0)% (193.5)% (35.6)% N/A 785.9% 32.9% 116.3% (98.2)% 5667.6% 32.6% Margin Analysis Cost of revenue 72.2% 72.5% 74.8% 85.2% 79.3% 78.1% 87.4% 76.1% 73.0% 72.5% 76.7% 72.8% 81.6% 73.6% 72.7% Gross income 27.8% 27.5% 25.2% 14.8% 20.7% 21.9% 12.6% 23.9% 27.0% 27.5% 23.3% 27.2% 18.4% 26.4% 27.3% S,G&A 18.0% 19.4% 17.2% 17.3% 20.3% 18.5% 21.5% 19.2% 16.8% 17.3% 18.5% 17.2% 19.0% 18.1% 17.0% Amortization 0.0% 0.0% 0.0% 0.0% 0.0% 0.0% 0.0% 0.0% 0.0% 0.0% 0.0% 0.0% 0.0% 0.0% 0.0% Operating Income 9.8% 8.1% 8.0% -2.5% 0.4% 3.4% -8.9% 4.7% 10.2% 10.2% 4.8% 10.1% -0.6% 8.3% 10.3% Pretax Income 10.3% 9.4% 8.6% -1.3% 1.4% 4.4% -8.2% 5.6% 11.0% 11.1% 5.6% 10.9% 0.3% 9.2% 11.2% Tax rate 39.5% 39.6% 39.4% 39.5% 39.0% 39.0% 35.9% 40.0% 39.5% 39.5% -11416.0% 39.5% 61.1% 39.6% 39.5% Net Income 6.2% 5.7% 5.2% -0.8% 0.8% 2.7% -5.3% 3.4% 6.7% 6.7% 3.3% 6.6% 0.1% 5.6% 6.8% Source: Company reports and Jefferies & Company estimates Note: Operating EPS excludes one-time gains and charges. (NYSE:MMS) Jefferies & Company, Inc.


Please see important disclosure information on pages 6 - 8 of this report. Matthew G. McKay, CFA , mmckay@Jefferies.com, (617) 342-7909 Page 4 of 8 Maximus, Inc. 2005-2008E Balance Sheet and Cash Flow Model ($ in millions, except per share) ---------------------F2007E---------------------- ---------------------F2008E---------------------- (FY End September) 2005A 2006A Q1A Q2A Q3E Q4E 2007E Q1E Q2E Q3E Q4E 2008E C2006A C2007E C2008E Balance Sheet Summary Cash and Cash Equivalents $180.6 $158.4 $164.1 $177.6 $215.0 $202.3 $202.3 $176.2 $194.7 $208.9 $218.7 $218.7 $164.1 $176.2 $228.7 Receivables 168.3 201.1 166.9 165.8 171.8 182.8 182.8 179.9 191.9 211.6 201.1 201.1 166.9 179.9 202.2 Other 7.3 24.2 30.2 26.0 27.0 27.1 27.1 26.7 26.9 28.0 28.1 28.1 30.2 26.7 27.7 Total Current Assets 356.1 383.7 361.2 369.3 413.7 412.3 412.3 382.8 413.4 448.5 447.9 447.9 361.2 382.8 458.5 Property, Equipment & Software, Net 55.1 67.4 64.6 63.6 60.4 59.1 59.1 58.0 57.3 56.2 55.0 55.0 64.6 58.0 54.0 Investments 0.0 0.0 0.0 0.0 0.0 0.0 0.0 0.0 0.0 0.0 0.0 0.0 0.0 0.0 0.0 Goodwill & Other Intangibles 94.6 92.4 90.9 90.5 90.5 90.5 90.5 90.5 90.5 90.5 90.5 90.5 90.9 90.5 90.5 Other 28.8 15.1 12.7 11.4 16.8 16.0 16.0 13.6 12.2 18.2 17.3 17.3 12.7 13.6 14.7 Total Assets 534.6 558.5 529.4 534.8 581.4 577.8 577.8 544.9 573.4 613.4 610.7 610.7 529.4 544.9 617.7 Accounts Payable 38.2 54.5 44.4 51.5 56.8 41.5 41.5 40.7 54.3 62.3 45.7 45.7 44.4 40.7 44.5 Accrued Expenses 26.8 24.4 22.2 24.1 28.1 28.6 28.6 24.4 26.5 30.9 31.4 31.4 22.2 24.4 26.8 Current Portion Long-term Debt 1.5 1.7 1.7 1.6 1.6 1.6 1.6 1.6 1.6 1.6 1.6 1.6 1.7 1.6 1.6 Deferred Revenue 32.9 54.4 48.3 41.4 50.8 47.3 47.3 47.3 45.6 55.9 52.0 52.0 48.3 47.3 52.0 Other 8.4 1.6 1.1 1.5 6.1 6.4 6.4 1.2 1.7 1.7 2.1 2.1 1.1 1.2 1.4 Total Current Liabilities 107.7 136.6 117.6 120.1 143.3 125.4 125.4 115.2 129.7 152.3 132.8 132.8 117.6 115.2 126.3 Long-term Debt 3.6 2.0 1.6 1.2 1.2 1.1 1.1 1.1 1.0 1.0 0.9 0.9 1.6 1.1 0.9 Other 17.3 14.9 13.7 13.9 46.9 46.9 46.9 13.9 13.9 13.9 13.9 13.9 13.7 13.9 13.9 Total Liabilities 128.6 153.6 133.0 135.2 191.4 173.4 173.4 130.2 144.6 167.2 147.6 147.6 133.0 130.2 141.0 Minorty Interest 0.0 0.0 0.0 0.0 0.0 0.0 0.0 0.0 0.0 0.0 0.0 0.0 0.0 0.0 0.0 Total Shareholders' Equity 406.0 404.9 396.5 399.6 390.0 404.4 404.4 414.8 428.8 446.2 463.1 463.1 396.5 414.8 476.7 Total Liabilities and Owners Equity $534.6 $558.5 $529.4 $534.8 $581.4 $577.8 $577.8 $544.9 $573.4 $613.4 $610.7 $610.7 $529.4 $544.9 $617.7 Balance Sheet Metrics DSO 70 80 72 65 60 65 70 70 69 69 66 71 72 70 72 DSO (Unbilled) 25 25 23 20 15 18 19 23 20 15 17 18 23 23 23 DPO 30 36 29 34 34 26 26 29 34 34 26 28 29 29 29 ROE 9.3% 0.6% (4.2)% (5.7)% (5.2)% (2.3)% (2.3)% 2.6% 5.1% 12.5% 12.6% 12.6% (4.2)% 2.6% 12.8% ROIC (incl GW) 12.2% (4.8)% (12.1)% (11.9)% (5.8)% (2.1)% (2.1)% 4.1% 5.8% 13.5% 13.3% 13.3% (12.1)% 4.1% 14.3% Debt/ Capital 1.2% 0.9% 0.8% 0.7% 0.7% 0.7% 0.7% 0.6% 0.6% 0.6% 0.5% 0.5% 0.8% 0.6% 0.5% Debt/ TTM EBITDA 0.1 x 0.3 x (0.2)x (0.1)x 2.4 x 0.1 x 0.2 x 0.1 x 0.0 x 0.0 x 0.0 x 0.0 x (0.2)x 0.1 x 0.0 x Net Cash/ Share $8.00 $7.02 $7.43 $7.94 $9.59 $9.00 $9.08 $7.80 $8.62 $9.24 $9.66 $9.69 $7.43 $7.80 $10.08 Book Value/Share $18.75 $18.56 $18.36 $18.18 $17.65 $18.26 $18.42 $18.68 $19.27 $20.01 $20.72 $20.79 $18.36 $18.68 $21.28 Invested Capital (in GW) 334.5 355.8 354.6 357.8 328.9 356.7 356.7 366.7 366.7 353.2 376.5 376.5 354.6 366.7 400.2 Cash Flow Summary Operating Sources 626.7 679.3 199.9 181.6 229.5 190.7 801.7 182.9 186.2 203.1 232.4 804.7 727.1 784.7 818.7 Operating Uses 576.8 689.8 194.5 167.7 195.9 203.1 761.2 175.8 167.5 188.6 222.4 754.3 731.6 742.5 765.2 Free Cash Flow 49.8 (10.4) 5.4 13.9 33.6 (12.4) 40.5 7.1 18.7 14.5 10.0 50.4 (4.5) 42.2 53.5 Acquisitions/ LT Investments (1.9) 0.0 2.2 0.0 0.0 0.0 2.2 0.0 0.0 0.0 0.0 0.0 2.2 0.0 0.0 Non-operating Cash Flow (80.7) (9.1) (25.2) 7.0 3.8 (0.2) (14.6) (0.2) (0.2) (0.3) (0.3) (1.0) (12.3) 10.3 (1.0) Reported CFO 74.1 15.7 7.6 17.4 35.7 (8.2) 52.5 (21.6) 23.1 18.9 14.4 34.9 18.3 23.2 71.2 NOPAT 41.0 (17.2) (17.6) 6.8 (10.2) 13.4 (7.6) 4.8 13.0 16.5 15.9 50.2 (43.0) 14.9 57.3 EBITDA 71.4 14.8 (12.3) 7.3 (6.3) 25.9 14.6 19.0 24.8 30.8 29.9 104.5 (14.3) 45.9 108.6 Annual Growth Operating Sources 7.5% 8.4% 31.4% 12.6% 13.8% 16.1% 18.0% (8.5)% 2.5% (11.5)% 21.9% 0.4% 15.4% 7.9% 4.3% Operating Uses 4.8% 19.6% 27.4% 8.4% (4.9)% 15.2% 10.4% (9.6)% (0.1)% (3.8)% 9.5% (0.9)% 24.8% 1.5% 3.0% Free Cash Flow 53.2% N/A N/A 112.2% N/A N/A N/A 31.3% 34.8% (56.7)% N/A 24.4% N/A N/A 26.8% Reported CFO 57.4% (78.8)% 51.0% 52.1% N/A N/A 234.3% N/A 32.6% (46.9)% N/A (33.6)% (73.5)% 27.2% 206.4% Cash Flow per Share Data Free Cash Flow $2.30 ($0.48) $0.25 $0.63 $1.52 ($0.56) $1.84 $0.32 $0.84 $0.65 $0.45 $2.26 ($0.23) $1.91 $2.40 Reported CFO $3.42 $0.72 $0.35 $0.79 $1.61 ($0.37) $2.39 ($0.97) $1.04 $0.85 $0.65 $1.56 $0.84 $1.06 $3.19 EBITDA $3.30 $0.68 ($0.57) $0.33 ($0.29) $1.17 $0.66 $0.86 $1.12 $1.38 $1.34 $4.69 ($0.67) $2.07 $4.86 Notes: Operating Sources defined as Revenue + Decrease in operating assets + Adjustments for acquisitions and reclassifications Operating Use defined as Cash expenses + Decrease in operating liabilities + Capital expenditures & capitalized software Free Cash Flow = Operating Sources - Operating Uses Source: Company Reports and Jefferies & Co. estimates (NYSE:MMS) Jefferies & Company, Inc.


Please see important disclosure information on pages 6 - 8 of this report. Matthew G. McKay, CFA , mmckay@Jefferies.com, (617) 342-7909 Page 5 of 8 Maximus, Inc. MMS One-Year Price Target Discounted Cash Flow Analysis (10-Year) ($ in millions, except per share) Projection Period Assumptions Operating Assumptions Miscellaneous Last Actual FY End: 9/30/2006 F2007E F2008E 5-Year Normal Growth 15% Exit Multiple FY End: 9/30/2016 Organic Growth 7.0% 10.0% 10-Year Treasury Yield 4.9% Price Target Date: 7/25/2008 Acquired Revenue 0.0% 0.0% Estimated Beta 1.78 Calendar Adjustment Factor: -1.82 Operating Margin 4.8% 10.1% Debt Interest Rate 6.0% DSO 89 89 Expected S&P 500 Performance 9.0% ROIC (In GW) (2.1)% 13.3% Diluted Shares Outstanding 22.0 Discount Assumptions Base discount rate: 11.5% Balance Sheet Adjustments Mar-07 Exit Multiple Assumptions Incremental discount rate: 2% Cash & ST Investments 177 FCF exit multiple 9.4x Derived WACC 13.5% ST & LT Debt 3 Incremental exit multiple 0.5x F2006A F2007E F2008E F2009E F2010E F2011E F2012E F2013E F2014E F2015E F2016E Free cash flow (10.4) 40.5 50.4 57.9 66.6 76.6 86.5 96.1 104.7 112.0 117.6 Growth Rate N/A 24% 15% 15% 15% 13% 11% 9% 7% 5% Note: FCF equals CFO minus Capital Expenditures and Capitalized Software 11.5% Discount Rate 13.5% Discount Rate 15.5% Discount Rate FCF Multiple 9.4x 9.9x 10.4x 9.4x 9.9x 10.4x 9.4x 9.9x 10.4x Terminal Value 1,103 1,162 1,221 1,103 1,162 1,221 1,103 1,162 1,221 Present Value of Terminal Value 452 477 501 391 412 433 339 357 375 Present Value of Cash Flows 564 564 564 534 534 534 508 508 508 Asset Value 1,016 1,040 1,064 925 946 967 847 865 883 Cash 177 177 177 177 177 177 177 177 177 Debt 3 3 3 3 3 3 3 3 3 Implied Equity Value 1,190 1,215 1,239 1,100 1,121 1,141 1,021 1,039 1,058 Implied Equity Value per Share $54.18 $55.28 $56.38 $50.05 $51.00 $51.95 $46.49 $47.31 $48.13 Implied Perpetual Growth Rate 0.8% 1.3% 1.7% 2.6% 3.1% 3.5% 4.4% 4.9% 5.4% Source: Jefferies & Company, Inc. (NYSE:MMS) Jefferies & Company, Inc.


Please see important disclosure information on pages 6 - 8 of this report. Matthew G. McKay, CFA , mmckay@Jefferies.com, (617) 342-7909 Page 6 of 8 ANALYST CERTIFICATIONS I, Matthew McKay, CFA, certify that all of the views expressed in this research report accurately reflect my personal views about the subject security(ies) and subject company(ies). I also certify that no part of my compensation was, is, or will be, directly or indirectly, related to the specific recommendations or views expressed in this research report. Important Disclosures As is the case with all Jefferies employees, the analyst(s) responsible for the coverage of the financial instruments discussed in this report receive compensation based in part on the overall performance of the firm, including investment banking income. We seek to update our research as appropriate, but various regulations may prevent us from doing so. Aside from certain industry reports published on a periodic basis, the large majority of reports are published at irregular intervals as appropriate in the analyst's judgement. Meanings of Jefferies & Company, Inc, Ratings Buy - Describes stocks that we expect to provide a total return (price appreciation plus yield) of 15% or more within a 12-month period. Hold - Describes stocks that we expect to provide a total return (price appreciation plus yield) of plus or minus 15% within a 12-month period. Underperform - Describes stocks that we expect to provide a total negative return (price appreciation plus yield) of 15% or more within a 12-month period. Our focus on mid-capitalization and growth companies implies that many of the companies we cover are typically more volatile than the overall stock market, which can be amplified for companies with an average stock price consistently below $10. For companies in this category only, the expected total return (price appreciation plus yield) for Buy rated stocks is 20% or more within a 12-month period. For Hold rated stocks with an average stock price consistently below $10, the expected total return (price appreciation plus yield) is plus or minus 20% within a 12-month period. For Underperform rated stocks with an average stock price consistently below $10, the expected total return (price appreciation plus yield) is minus 20% within a 12-month period. NR - The investment rating and price target have been temporarily suspended. Such suspensions are in compliance with applicable regulations and/or Jefferies & Company, Inc. policies. CS - Coverage Suspended. Jefferies & Company, Inc. has suspended coverage of this company. NC - Not covered. Jefferies & Company, Inc. does not cover this company. Speculative Buy - Describes stocks we view with a positive bias, whose company fundamentals and financials are being monitored, but for which there is insufficient information for Jefferies & Company, Inc. to assign a Buy, Hold or Underperform Rating. At the discretion of the analyst, a Speculative buy-rated stock could also include stocks with a price under $5, or where the company is not investment grade to highlight the risk of the situation. Speculative Underperform - Describes stocks we view with a negative bias, whose company fundamentals and financials are being monitored, but for which there is insufficient information for Jefferies & Company, Inc. to assign a Buy, Hold or Underperform Rating. At the discretion of the analyst, a Speculative underperform-rated stock could also include stocks with a price under $5, or where the company is not investment grade to highlight the risk of the situation. Restricted - Describes issuers where, in conjunction with Jefferies engagement in certain transactions, company policy or applicable securities regulations prohibit certain types of communications, including investment recommendations. Monitor - Describes stocks whose company fundamentals and financials are being monitored, and for which no financial projections or opinions on the investment merits of the company are provided. Valuation Methodology Jefferies' methodology for assigning ratings may include the following: market capitalization, maturity, growth/value, volatility and expected total return over the next 12 months. The price targets are based on several methodologies, (NYSE:MMS) Jefferies & Company, Inc.


Please see important disclosure information on pages 6 - 8 of this report. Matthew G. McKay, CFA , mmckay@Jefferies.com, (617) 342-7909 Page 7 of 8 which may include, but are not restricted to, analyses of market risk, growth rate, revenue stream, discounted cash flow (DCF), EBITDA, EPS, cash flow (CF), free cash flow (FCF), EV/EBITDA, P/E, PE/growth, P/CF, P/FCF, premium (discount)/average group EV/EBITDA, premium (discount)/average group P/E, sum of the parts, net asset value, dividend returns, and return on equity (ROE) over the next 12 months. Risk which may impede the achievement of our Price Target This report was prepared for general circulation and does not provide investment recommendations specific to individual investors. As such, the financial instruments discussed in this report may not be suitable for all investors and investors must make their own investment decisions based upon their specific investment objectives and financial situation utilizing their own financial advisors as they deem necessary. Past performance of the financial instruments recommended in this report should not be taken as an indication or guarantee of future results. The price, value of, and income from, any of the financial instruments mentioned in this report can rise as well as fall and may be affected by changes in economic, financial and political factors. If a financial instrument is denominated in a currency other than the investor's home currency, a change in exchange rates may adversely affect the price of, value of, or income derived from the financial instrument described in this report. In addition, investors in securities such as ADRs, whose values are affected by the currency of the underlying security, effectively assume currency risk. Q2 Q3 Q1 Q2 Q3 Q1 Q2 Q3 Q1 Q2 16 24 32 40 48 2005 2006 2007 08/26/04 H:$29 05/09/05 H:$32 11/23/05 H:$38 05/08/06 H:$36 06/27/06 H:$26 08/07/06 H:$30 02/09/07 B:$45 05/10/07 B:$50 Rating and Price Target History for: MAXIMUS, Inc. (MMS) as of 07-24-2007 Created by BlueMatrix Distribution of Ratings IB Serv./Past 12 Mos. Rating Count Percent Count Percent BUY [BUY/SB] HOLD [HOLD] SELL [UNPF/SU] 437 338 33 54.08 41.83 4.08 55 30 4 12.59 8.88 12.12 OTHER DISCLOSURES This material has been prepared by Jefferies & Company, Inc. a U.S.-registered broker-dealer, employing appropriate expertise, and in the belief that it is fair and not misleading. The information upon which this material is based was obtained from sources believed to be reliable, but has not been independently verified, therefore, we do not guarantee its accuracy. Additional and supporting information is available upon request. This is not an offer or solicitation of an offer to buy or sell any security or investment. Any opinion or estimates constitute our best judgment as of this date, and are subject to change without notice. Jefferies & Company, Inc. and Jefferies International Limited and their affiliates and their respective directors, officers and employees may buy or sell securities mentioned herein as agent or principal for their own account. Additional information for UK and Canadian investors (NYSE:MMS) Jefferies & Company, Inc.


Please see important disclosure information on pages 6 - 8 of this report. Matthew G. McKay, CFA , mmckay@Jefferies.com, (617) 342-7909 Page 8 of 8 This material is approved for distribution in the United Kingdom by Jefferies International Limited which is authorized and regulated by the Financial Services Authority ("FSA"). While we believe this information and materials upon which this information was based are accurate, except for any obligations under the rules of the FSA, we do not guarantee its accuracy. This material is intended for use only by a person or entity that qualifies as an authorised person or exempt person within the meaning of section 19 of the UK Financial Services and Markets Act 2000 (the "Act") or qualifies as a person to whom the financial promotion restrictions imposed by the Act does not apply by virtue of the Financial Services and Markets Act 2000 (Financial Promotion) Order 2005, or is a person classified as an "intermediate customer" for the purposes of the Conduct of Business Rules of the FSA. None of the investments or investment services mentioned or described herein are available to other persons in the UK and in particular are not available to "private customers" as defined by the rules of the FSA. For Canadian investors, this material is intended for use only by professional or institutional investors. None of the investments or investment services mentioned or described herein are available to other persons or to anyone in Canada who is not a "Designated Institution" as defined by the Securities Act (Ontario). This material does not constitute a personal recommendation or take into account the particular investment objectives, financial situations, or needs of individual clients. Clients should consider whether any advice or recommendation in this report is suitable for their particular circumstances and, if appropriate, seek professional advice, including tax advice. The price and value of the investments referred to herein and the income from them may fluctuate. Past performance is not a guide to future performance, future returns are not guaranteed, and a loss of original capital may occur. Fluctuations in exchange rates could have adverse effects on the value or price of, or income derived from, certain investments. Jefferies & Company, Inc. research reports are disseminated and available primarily electronically, and, in some cases, in printed form. Electronic research is simultaneously available to all clients. This report or any portion hereof may not be reprinted, sold or redistributed without the written consent of Jefferies & Company, Inc. Jefferies International Limited has adopted a conflicts management policy in connection with the preparation and publication of research, the details of which are available upon request in writing to: The Compliance Officer, Jefferies International Limited, Bracken House, One Friday Street, London EC4M 9JA; telephone +44 (0) 20 7618 3500; facsimile +44 (0) 20 7618 3760. © 2007 Jefferies & Company, Inc, (NYSE:MMS) Jefferies & Company, Inc.


Appendix 14


FOR IMPORTANT DISCLOSURES AND CERTIFICATIONS, PLEASE REFER TO PAGES 6 - 7 OF THIS NOTE. ACTION STATEMENT Earlier today, MAXIMUS, Inc. (MMS-NYSE) reported 1Q09 results that were essentially in line with our and Street expectations, and which were devoid of any charges or special items for the first time in several quarters. MMS maintained its FY09 EPS guidance of $3.00-3.15, while saying that it expects FY09 revenue to be at the lower end of its previously communicated $750 million-$775 million range owing to project delays (which could be offset by some contributions from new federal legislation). We were already expecting FY09 revenue at the low end of the range ($754 million; the Street was only slightly higher at $758 million), so this news comes as little surprise to us. MMS expects the reauthorization of SCHIP will result in a substantial increase in enrollments in the programs it operates, though it expects any material contribution to take place in FY10 and beyond. More broadly, the Company expects the majority of potential benefits from any new federal legislation will not have a material impact on results until FY10 and beyond. We view MMS' long-term growth prospects as significant, given both ongoing federal support for Medicaid and SCHIP, along with MMS' leading position in those markets; 28 states and the District of Columbia outsource Medicaid Managed Care, of which MMS manages enrollment in 13, with a 67% market share of the population in those 29 outsourcing states, and 12 states outsource SCHIP enrollment, of which MMS manages enrollment in five states, with a 69% market share. In our view, MMS is well positioned to ride out U.S. economic problems in the quarters to come. Its core Operations business now accounts for 87% of revenue and continues to grow at a healthy rate(11% on a constant currency basis in 1Q09) and earn high margins (13.7% in 1Q09). Well over 70% of its revenue comes from federally funded programs such as Medicaid and SCHIP, so a significant percentage of its top line is stable, in our opinion. The Company has just three large remaining "legacy" ERP contracts in its money-losing Consulting segment, two of which are performing to the Company's satisfaction, and MMS said on its conference call that it expects the Consulting segment to become profitable in FY09. MMS also continues to generate steady cash flow and has a strong balance sheet, with $61.5 million of cash (and another $13 million that it expects to receive in 2Q09) and no debt. We continue to believe that the Company's strong presence in the health and human services market will bode well for future growth, given this administration's apparent support for many such services. Moreover, we believe MMS could benefit from increasing unemployment, as this situation could lead to a spike in the number of people eligible for public health plans that MMS has expertise in administering. After these results, we are reducing our FY09 revenue estimate from $754 million to $740 million, which implies a year-over-year decline of 0.7%. However, we are leaving our EPS estimate of $3.02 intact. We are also introducing FY10 estimates: revenue growth of 5% and EPS of $3.20, which implies 6.3% growth. For both years, we are expecting an operating margin of 12.4%. We are maintaining our BUY rating on the stock and are increasing our price target from $40 to $43. February 5, 2009 KeyBanc TECHNOLOGY: IT Services Capital Markets / Price Target Change MAXIMUS, Inc.: MMS: 1Q09 Call ; Maintain BUY KeyBanc Capital Markets Inc. Member NYSE/FINRA/SIPC Anurag Rana: (917) 368-2213 — arana@keybanccm.com Adam Josephson: (917) 368-2289 — ajosephson@keybanccm.com Investors should assume that we are seeking or will seek investment banking or other business relationships with the company described in this report. Rating BUY Price $38.07 12-Mo. Price Target $43.00 Dividend $0.48 Yield 1.3% 52-Wk. Range $26-$45 Trading Volume 230,000 Market Cap. (mm) $685.3 Shares Out. (mm) 18.00 Book Value/Share $14.28 Fiscal Year End September 2010E $3.20 2009E $3.02 2008A $0.35 2010 P/E 11.9x 2009 P/E 12.6x First Call 2010E $3.21 First Call 2009E $3.02 Next Quarter March Estimate $0.64 Vs. $0.51 First Call Estimate $0.75 1


2 KEY INVESTMENT POINTS 1Q09 Results as Expected MMS reported 1Q09 results that were essentially in line with our and Street expectations. Its revenue was $180 million (up 5% on a constant currency basis), compared to our forecast of $181 million, and its EPS was $0.67, compared to our estimate of $0.68 and the Street's estimate of $0.66. Its operating margin was 11.0%, 20 basis points below our forecast. MMS' Operations segment (approximately 87% of revenue) continues to perform well, in our view, growing revenue 6% year-over-year (11% on a constant currency basis) and earning an operating margin of 13.7%. MMS continues to expect the segment's operating margin in FY09 to be at the higher end of the Company's stated range of 10-15%. The Consulting segment (roughly 13% of revenue) experienced a revenue decline of 22% and lost $1.5 million. This segment's results were hampered by a project charge of $2.5 million as a result of a cost increase on a fixed price contract. MMS' total bookings (signed contract wins) year-to-date at January 30, 2009, were $208 million, compared to $311 million a year ago. MMS' new contracts pending at February 3, 2009, were $135 million, compared to $264 million last year. The tables below compare the Company's results to our estimates, and provide a broader snapshot of the results. Table 1. Variance Actual Estimate Variance % Variance Revenue $180.1 $181.4 -$1.3 -1% YoY Change (%) 1.7% 2.4% -0.7% Gross Margin 26.2% 26.7% -0.5% Op. Income $19.8 $20.3 -$0.5 -2% YoY Change (%) 2.9% 5.5% -2.6% Op. Margin 11.0% 11.2% -0.2% Tax Rate 39.5% 39.5% 0.0% EPS $0.67 $0.68 ($0.01) -1% YoY Change (%) 18.9% 20.3% -1.4% Shares Outstanding 18.0 18.7 -0.8 -4% Source: Company reports, KeyBanc Capital Markets Inc. Company Note February 5, 2009


3 Table 2. Snapshot 3Q07 4Q07 1Q08 2Q08 3Q08 4Q08 1Q09 Income Statement Data Revenue 170 174 177 190 189 189 180 Op. Income (Pro Forma) 22 24 19 23 24 20 20 TTM EBITDA (Pro Forma) 85 91 102 104 99 99 Gross Margin (Pro Forma) 29% 27% 26% 27% 28% 27% 26% Op. Margin (Pro Forma) 13% 14% 11% 12% 13% 11% 11% YoY % Change Revenue -9% 1% 34% 26% 11% 9% 2% Op. Income (Pro Forma) 41% 78% 9% -17% 3% EPS (Excl. Charges) 99% 108% 36% 11% 19% Segment Data Operations % of Total Revenue 83% 82% 83% 85% 83% 86% 87% Operating Margin 14% 16% 12% 14% 14% 14% 14% Consulting % of Total Revenue 17% 18% 17% 15% 17% 14% 13% Operating Margin 7% 6% 6% 2% 4% -8% -6% Balance Sheet & Cash Flow Net Cash* 214 197 63 64 78 122 77 TTM FCF (CFO - CapEx) 12 37 27 10 59 19 TTM FCF % Revenue 2% 5% 4% 1% 8% 3% Source: Company reports, KeyBanc Capital Markets Inc. *Net cash in 1Q09 includes a $13 million insurance reimbursement that the Company expects to receive in 2Q09. Balance Sheet and Cash Flow Highlights At the end of the quarter, the Company had $61.5 million in cash (about $3.43 per diluted share) and no debt on its balance sheet. This cash amount excludes a $13 million insurance reimbursement that MMS expects to receive in 2Q09 related to its arbitration settlement. Including this amount, MMS would have around $4.15 of cash per diluted share. MMS paid $40 million in 1Q09 related to the settlement, which resulted in a use of cash from continuing operations of $21.2 million and negative free cash flow (free cash flow is defined as cash flow from operations less PP&E and capitalized software costs) of $25.3 million. Excluding the payout, MMS generated $18.8 million in cash from operations and free cash flow from continuing operations of $14.7 million. MMS is maintaining its FY09 cash flow guidance of $35 million-$45 million of cash from continuing operations and $15 million-$25 million of free cash flow. Excluding the $40 million cash payout, MMS would be guiding to $55 million-$65 million of free cash flow in FY09. The Company bought back 740,490 shares for $23.2 million under its share repurchase program during the quarter, and had approximately $59.5 million available under this program for additional purchases as of December 31. FY09 EPS Guidance Reiterated MMS maintained its FY09 EPS guidance of $3.00-$3.15, while saying that it expects FY09 revenue to be at the lower end of its previously communicated $750 million-$775 million range owing to project delays (which could be offset by some contributions from new federal legislation). We were already expecting FY09 revenue at the low end of the range ($754 million; the Street was only slightly higher at $758 million), so this news is little surprise to us. MMS expects the reauthorization of SCHIP will result in a substantial increase in enrollments in the programs it operates, though it expects any material contribution to take place in FY10 and beyond. Estimate Changes We are reducing our FY09 revenue estimate from $754 million to $740 million, which implies a year-over-year decline of 0.7%. However, we are leaving our EPS estimate of $3.02 intact. We are also introducing FY10 estimates: revenue growth of 5% and EPS of $3.20, which implies 6.3% growth. For both years, we are expecting an operating margin of 12.4%. VALUATION MMS trades at a P/E multiple of 11.8x our revised CY09 EPS estimate, compared to its peer group median of 16.5x. On an EV/EBITDA multiple basis, the stock trades at 6.1x our CY09 estimate, compared to its peer group median of 8.6x. At our revised price target of $43, MMS would trade at a P/E multiple of 13.4x our CY09 estimate and an EV/EBITDA multiple of 7.0x. Company Note February 5, 2009


4 RISKS Risk factors that could impede the stock from achieving our price target include spending curtailment among state governments, execution risk on large contracts and price competition. EPS (Net) Summary 2008A %CHG 2009E %CHG 2010E %CHG 1Q $0.51 NM $0.67A 31.4% $0.73 9.0% 2Q $0.51 363.6% $0.64 25.5% $0.79 23.4% 3Q $0.61 NM $0.85 39.3% $0.86 1.2% 4Q ($1.35) NM $0.98 NM $0.96 -2.0% YEAR $0.35 NM $3.02 762.9% $3.20 6.0% Source: KeyBanc Capital Markets Inc. estimates Company Note February 5, 2009


5 MMS - QUARTERLY REVENUE AND INCOME ANALYSIS ($ in millions, except per share items) Dec-07 Mar-08 Jun-08 Sep-08 Dec-08 Mar-09 Jun-09 Sep-09 Dec-09 Mar-10 Jun-10 Sep-10 FY06 FY07 1Q08 2Q08 3Q08 4Q08 FY08 1Q09 2Q09E 3Q09E 4Q09E FY09E 1Q10E 2Q10E 3Q10E 4Q10E FY10E Total Revenue $583.6 $626.2 $177.1 $189.6 $189.4 $189.1 $745.1 $180.1 $184.6 $185.1 $190.3 $740.1 $188.1 $193.1 $194.5 $201.0 $776.7 Cost of Revenue 471.9 449.1 130.8 137.7 136.6 138.3 543.4 132.9 137.1 132.9 135.2 538.1 138.1 141.4 141.0 144.3 564.8 Adjustments for One-Time Items 17.1 29.4 0.0 0.0 0.0 0.0 0.0 0.0 0.0 0.0 0.0 0.0 0.0 0.0 0.0 0.0 0.0 Gross Profit (GAAP) 94.6 147.7 46.3 51.9 52.8 50.8 201.7 47.1 47.5 52.2 55.1 201.9 50.0 51.8 53.5 56.7 212.0 Gross Profit (Pro Forma) 111.7 177.1 46.3 51.9 52.8 50.8 201.7 47.1 47.5 52.2 55.1 201.9 50.0 51.8 53.5 56.7 212.0 Selling, General & Administrative 103.4 104.6 27.0 28.8 28.9 30.9 115.6 27.3 28.8 27.4 26.3 109.8 28.8 29.0 28.8 28.7 115.3 Adjustments for One-Time Items 9.4 44.0 0.0 0.9 (3.2) 6.8 4.5 0.0 0.0 0.0 0.0 0.0 0.0 0.0 0.0 0.0 0.0 Operating Income (18.2) (0.9) 19.2 22.2 27.1 13.1 81.6 19.8 18.7 24.8 28.8 92.1 21.3 22.8 24.7 27.9 96.7 Operating Income (Pro Forma) 8.3 72.5 19.2 23.1 23.8 19.9 86.1 19.8 18.7 24.8 28.8 92.1 21.3 22.8 24.7 27.9 96.7 Interest and Other Income, Net 6.9 5.8 1.5 0.1 0.5 0.3 2.4 0.1 0.4 0.4 0.4 1.3 0.5 0.7 0.7 0.7 2.6 Adj. for Other Non-Recur. Expenses 0.0 0.0 0.0 0.0 0.0 0.0 0.0 0.0 0.0 0.0 0.0 0.0 0.0 0.0 0.0 0.0 0.0 Pretax Income (11.3) 4.9 20.7 22.3 27.6 13.4 84.0 19.9 19.1 25.2 29.2 93.4 21.8 23.5 25.4 28.6 99.3 Pretax Income (Pro Forma) 15.2 78.3 20.7 23.2 24.3 20.2 88.5 19.9 19.1 25.2 29.2 93.4 21.8 23.5 25.4 28.6 99.3 Income Tax Expense (4.5) 12.1 8.5 8.8 10.3 5.0 32.5 7.9 7.5 10.0 11.5 36.9 8.6 9.3 10.0 11.3 39.2 Income Tax Expense (Pro Forma) 6.0 31.6 8.1 9.2 9.0 7.1 33.3 7.9 7.5 10.0 11.5 36.9 8.6 9.3 10.0 11.3 39.2 Income from Continuing Ops. (6.8) (7.2) 12.3 13.5 17.3 8.4 51.5 12.0 11.5 15.3 17.7 56.5 13.2 14.2 15.4 17.3 60.1 Income from Discontinued Ops., Net 9.3 (1.1) (1.7) (3.9) (5.9) (10.2) (21.6) (0.1) 0.0 0.0 0.0 (0.1) 0.0 0.0 0.0 0.0 0.0 Net Income 2.5 (8.3) 10.6 9.6 11.4 (1.8) 29.9 12.0 11.5 15.3 17.7 56.4 13.2 14.2 15.4 17.3 60.1 Net Income (Pro Forma) 9.2 46.7 12.7 14.0 15.3 13.2 55.2 12.0 11.5 15.3 17.7 56.5 13.2 14.2 15.4 17.3 60.1 Avg. Shs., Diluted (mil.) 21.8 21.9 20.9 18.8 18.8 18.5 19.2 18.0 18.0 18.0 18.0 18.7 18.0 18.0 18.0 18.0 18.7 GAAP EPS $0.11 ($0.38) $0.51 $0.51 $0.61 ($0.09) $1.55 $0.67 $0.64 $0.85 $0.98 $3.01 $0.73 $0.79 $0.86 $0.96 $3.20 EPS from Continuing Ops. ($0.31) ($0.33) $0.59 $0.72 $0.92 $0.45 $2.68 $0.67 $0.64 $0.85 $0.98 $3.02 $0.73 $0.79 $0.86 $0.96 $3.20 Pro Forma EPS $0.42 $2.14 $0.61 $0.75 $0.81 $0.71 $2.87 $0.67 $0.64 $0.85 $0.98 $3.02 $0.73 $0.79 $0.86 $0.96 $3.20 Margin Analysis GAAP Gross Margin (%) 16.2 23.6 26.1 27.4 27.9 26.9 27.1 26.2 25.7 28.2 29.0 27.3 26.6 26.8 27.5 28.2 27.3 GAAP Op. Margin (%) -3.1 -0.1 10.9 11.7 14.3 6.9 10.9 11.0 10.1 13.4 15.2 12.4 11.3 11.8 12.7 13.9 12.4 Pro Forma Operating Margin (%) 1.4 11.6 10.9 12.2 12.6 10.5 11.6 11.0 10.1 13.4 15.2 12.4 11.3 11.8 12.7 13.9 12.4 GAAP Pretax Margin (%) -1.9 0.8 11.7 11.7 14.6 7.1 11.3 11.1 10.3 13.6 15.4 12.6 11.6 12.2 13.1 14.2 12.8 Effective Tax Rate (%) 39.5 40.3 38.9 39.5 37.0 35.0 37.6 39.5 39.5 39.5 39.5 39.5 39.5 39.5 39.5 39.5 39.5 Sequential Change (%) Revenue 1.9 7.1 -0.1 -0.2 -4.7 2.5 0.3 2.8 -1.1 2.6 0.7 3.3 Operating Income -20.0 20.0 3.2 -16.5 -0.5 -5.7 32.8 16.2 -26.2 7.2 8.4 13.1 Pro Forma EPS -14.5 23.1 8.8 -12.9 -5.5 -4.1 32.1 15.9 -25.5 7.9 8.1 12.8 Year-to-Year Change (%) Revenue 34.4 25.7 11.4 8.8 19.0 1.7 -2.7 -2.2 0.6 -0.7 4.5 4.6 5.0 5.6 5.0 Operating Income (Pro Forma) 2.9 -19.1 4.1 44.8 7.0 7.3 22.0 -0.4 -3.1 5.0 Pro Forma EPS 10.3 -14.1 4.3 38.8 5.1 9.3 23.1 0.8 -2.0 6.3 Anurag Rana KeyBanc Capital Markets Inc. 917.368.2213 5-Feb arana@keybanccm.com Company Note February 5, 2009


6 KeyBanc Capital Markets Inc. Disclosures and Certifications MAXIMUS, Inc. - MMS On 4/1/08, KeyBanc Capital Markets changed its rating scale from a 5-tiered system to a 3-tiered system. The rating change from Aggressive Buy to Buy on 4/1/08 reflects this transition, and not a rating downgrade or change in opinion. We have received compensation for non-investment banking securities related services from MAXIMUS, Inc. during the past 12 months. We expect to receive or intend to seek compensation for investment banking services from MAXIMUS, Inc. within the next three months. Reg A/C Certification The research analyst(s) responsible for the preparation of this research report certifies that:(1) all the views expressed in this research report accurately reflect the research analyst's personal views about any and all of the subject securities or issuers; and (2) no part of the research analyst's compensation was, is, or will be directly or indirectly related to the specific recommendations or views expressed by the research analyst(s) in this research report. Three-Year Rating and Price Target History Q1 Q2 Q3 Q1 Q2 Q3 Q1 Q2 Q3 16 24 32 40 48 2007 2008 2009 06/27/06 B:$38 12/26/06 B:$34 03/14/07 B:$37 05/09/07 B:$46 07/24/07 B:$50 12/12/07 AB:$50 04/01/08 B:$50 10/21/08 B:$40 Rating and Price Target History for: MAXIMUS, Inc. (MMS) as of 02-04-2009 Created by BlueMatrix On 4/1/08, KeyBanc Capital Markets changed its rating scale from a 5-tiered system to a 3-tiered system. The rating change from Aggressive Buy to Buy on 4/1/08 reflects this transition, and not a rating downgrade or change in opinion. Rating Disclosures Distribution of Ratings/IB Services Firmwide and by Sector KeyBanc Capital Markets IB Serv/Past 12 Mos. Rating Count Percent Count Percent BUY [BUY] 123 35.80 29 23.58 HOLD [HOLD] 195 56.70 32 16.41 SELL [UND] 26 7.60 0 0.00 TECHNOLOGY IB Serv/Past 12 Mos. Rating Count Percent Count Percent BUY [BUY] 11 36.70 0 0.00 HOLD [HOLD] 19 63.30 0 0.00 SELL [UND] 0 0.00 0 0.00 Company Note February 5, 2009


7 Rating System BUY - The security is expected to outperform the market over the next six to 12 months; investors should consider adding the security to their holdings opportunistically, subject to their overall diversification requirements. HOLD - The security is expected to perform in line with general market indices over the next six to 12 months; no buy or sell action is recommended at this time. UNDERWEIGHT - The security is expected to underperform the market over the next six to 12 months; investors should reduce their holdings opportunistically. The information contained in this report is based on sources considered to be reliable but is not represented to be complete and its accuracy is not guaranteed. The opinions expressed reflect the judgment of the author as of the date of publication and are subject to change without notice. This report does not constitute an offer to sell or a solicitation of an offer to buy any securities. Our company policy prohibits research analysts and members of their families from owning securities of any company followed by that analyst, unless otherwise disclosed. Our officers, directors, shareholders and other employees, and members of their families may have positions in these securities and may, as principal or agent, buy and sell such securities before, after or concurrently with the publication of this report. In some instances, such investments may be inconsistent with the opinions expressed herein. One or more of our employees, other than the research analyst responsible for the preparation of this report, may be a member of the Board of Directors of any company referred to in this report. The research analyst responsible for the preparation of this report is compensated, based in part, on investment banking revenue which may include revenue derived from the Firm's performance of investment banking services for companies referred to in this report, although such compensation is not based upon specific investment banking services transactions for these or any other companies. In accordance with industry practices, our analysts are prohibited from soliciting investment banking business for our Firm. Copyright 2009, KeyBanc Capital Markets Inc. All rights reserved. Securities, mutual funds and other investment products are: • Not Insured by the FDIC. • Not deposits or other obligations of, or guaranteed by KeyBanc Capital Markets Inc., KeyBank, N.A. or any of their affiliates. • Subject to investment risks, including possible loss of the principal amount invested. Company Note February 5, 2009


Appendix 15


Page 1 All relevant disclosures and certifications appear on pages 11 - 12 of this report. August 7, 2009 Solid F3Q09, Though FY10 Revenue Guidance Down Like-For-Like; Maint. Hold George A. Price (443) 224-1323 gaprice@stifel.com Shlomo Rosenbaum (443) 224-1322 shrosenbaum@stifel.com Richard Eskelsen (443) 224-1366 eskelsenr@stifel.com Analysis of Sales/Earnings • Despite continuing fundamental improvements, particularly in reducing losses in Consulting segment and ongoing new business wins (e.g., UK employment services deal, stimulus-funded CMS contract), we remain cautious on MMS shares due to ongoing challenges in the S&L fiscal environment. • Center for Budget and Policy Priorities (www.cbpp.org) notes that $24B in budget shortfalls have opened in FY10 state budgets of at least 12 states and DC, and total estimated FY10 – FY11 state budget shortfall expected to be at least $350B. • MMS saw some of this impact already, with its CA Healthy Families contract revenue expected to be reduced by about $12M in FY10. We remain concerned that there could be additional impacts to MMS form S&L fiscal difficulties. • F3Q09 results generally in line. Revenue was slightly below us and consensus, and pro forma EPS (excl. $0.16 legal and settlement recovery) of $0.68 was $0.01 below us but a penny ahead of consensus (see report table below). FCF of $5.8M was well above our prior estimate (benefitted from positive working capital impacts). • Prior FY09 guidance (revenue of $745M - $755M and EPS guidance, excl. legal and settlement recovery, of $2.75 – $2.85) was maintained. MMS reiterated prior FY10 revenue guidance of 7% growth, but this now includes new 5 year, $200M UK employment services deal. Since FY10 revenue guidance did not include incremental contract wins like the UK deal, we view like-for-like prior guidance as reduced to 5% growth, reflecting S&L budget difficulties. MMS also seemed to indicate FY10 operating margin was likely to be more flattish, given upfront losses expected on the new UK deal. • While MMS shares trade don't look particularly expensive to us and trade roughly in line with peers on most metrics (FCF yield an exception), in our view their valuation seems fair in light of expected performance near-term and S&L fiscal challenges. Maintain Hold on the shares. Maximus, Inc. MMS – NYSE Hold Commercial IT Services From To Changes (Previous) (Current) Rating -- Hold FY09E EPS (Net) $2.73 $2.79 FY10E EPS (Net) $3.22 $3.10 Stock Data Price (08/06/09): $41.86 52-Week Range: $44 – $26 Market Cap.($mm): $745.1 Shr.O/S-Diluted (mm): 17.8 Enterprise Val. ($mm): $651.4 Avg Daily Vol (3 Mo): 154,577 LT Debt/Total Cap.: 0.0% Net Cash/Share: $5.35 Dividend ($): $0.48 Yield (%): 1.1% Book Value/Share: $15.87 S&P Index: 997.08 EPS (Net) 2008A 2009E 2010E 1Q $0.59A $0.67A $0.70 2Q 0.75A 0.65A 0.73 3Q 0.81A 0.68A 0.81 4Q 0.71A 0.79 0.86 FY Sep $2.86A $2.79 $3.10 P/E 14.6x 15.0x 13.5x FY08 quarterly EPS estimates are pro forma from continuing operations, and exclude one-time, nonrecurring items; include $0.03 of pre-ASR interest income. Revenue (Net) $807.9M $750.2M $801.4M EV/Revenue 0.8x 0.9x 0.8x FY08 revenue estimates are from continuing operations. Q3 Q1 Q2 20 25 30 35 40 45 2009 1 Year Price History for MMS Created by BlueMatrix


Page 2 Investment Conclusions We are maintaining our Hold rating on MMS share and remain cautious on company prospects in the near term. Although we commend management for improving the business from a fundamental standpoint through reducing legacy losses in its Consulting segment (now expects to be breakeven or even post small profit by year-end, following 3 consecutive quarters of OPM improvements) and continuing to win new business (e.g., new UK employment services deal), we believe that the current S&L fiscal environment remains uncertain. The Center for Budget and Policy Priorities (www.cbpp.org) has reported that $24B in budget shortfalls have opened in FY10 state budgets (begun July 1, 2009 in most states) in at least 12 states plus DC. CBPP also estimates that state FY11 budget shortfalls will be $160B - $180B, with the estimated total budget shortfall over the next two state fiscal years will be at least $350B. MMS experienced a first wave of S&L budget issues this quarter, as its FY10 revenue outlook was impacted by CA budget cuts in the CA Healthy Families program. MMS expects to see revenue impacted by ~$12M in FY10 from CA Healthy Families, and we think there could be some risk in one of the remaining two CA contracts (we believe more risk of potential cuts in CalWorks versus Medi-Cal). These ongoing S&L fiscal difficulties, coupled with MMS new UK government contract (which we expect to be a long term positive for the company but remain somewhat leery of due to past difficulties with other sizable UK government contracts) cause us to remain cautious on MMS shares. Maximus, Inc. (MMS) August 7, 2009


Page 3 Results RESULTS VERSUS OUR EXPECTATIONS AT TIME OF EARNINGS ANNOUNCEMENT KEY METRICS F3Q09 SN Est. Actual Year Ago Comment Revenue ($M), continuing ops. $189.4 $185.2 $189.4 Below our estimate and consensus. MMS provided no prior guidance, but reiterated FY09 (Sept.) guidance. YOY Growth (as reported) 0.0% -10.2% 5.0% YOY Growth (cont. ops.) 0.0% -2.2% 11.4% Consensus Revenue ($M) $187.3 Gross Margin (reported) 26.1% 25.9% 26.8% Slightly below our estimate. EBIT Margin (GAAP) 10.4% 13.3% 7.1% Includes legal and settlement recovery, which added 261 bps to OPM. EBIT Margin (pro forma, excl. one time and legal) 10.4% 10.7% 8.9% Slightly above our estimate, benefitting from smaller loss QOQ in Consulting unit and continuing strong margins in Operations unit. Tax Rate 39.5% 39.5% 35.4% In line. EPS (GAAP) $0.69 $0.84 $0.61 YOY Growth 13.1% 37.7% NM EPS (cont. ops., pro forma) $0.69 $0.84 $0.92 Includes $0.16 due to legal and settlement recovery. YOY Growth -25.0% -8.7% NA EPS (cont. ops., pro forma, excl. legal) $0.69 $0.68 $0.81 A penny below our estimate, but $0.01 above consensus. Higher share count versus our estimate took a penny, so would call it in-line. Excludes $0.16 in legal and settlement recovery. YOY Growth -14.8% -16.0% NA Consensus EPS $0.67 Share count (M) 17.5 17.8 18.8 Above our estimate and reduced EPS by a penny relative to our estimate. A/R DSO (days) 69 72 77 Slightly higher than our estimate, driven by higher billed revenue, which may be a function of slower state payments due to budget challenges. Free Cash Flow ($M) $0.7 $5.8 $6.1 Above our estimate, due to higher deferred revenue and other positive working capital impacts (beyond A/R DSOs). Source: Company Filings, FirstCall Estimates, and Stifel Nicolaus Estimates. • F3Q09 results were generally in line, with revenue slightly below us and consensus, and pro forma EPS (excl. $0.16 legal and settlement recovery) of $0.68 was $0.01 below us but a penny ahead of consensus. However, using our lower share count, pro forma EPS would have been in line with our estimate. • Pro forma EBIT of 10.7% was slightly above our estimate. OPM in the Operations segment was 12.1%, which, although still strong, was down QOQ for a second quarter in a row and down 240 bps YOY. OPM in the Consulting segment was -0.7%, a 100 bps sequential improvement. Both segment operating margins were below our prior estimates. • FCF was $5.8M, well above our prior estimate, and benefitted from positive working capital impacts (notably deferred revenue). Maximus, Inc. (MMS) August 7, 2009


Page 4 Guidance OUR ESTIMATES VERSUS UPDATED GUIDANCE FOLLOWING DIVESTITURE ANNOUNCEMENT GUIDANCE F4Q09 SN Ests. Guidance Comment Revenue ($M, cont. ops.) $192.9 No guidance MMS only provides annual guidance. Consensus Revenue ($M) $194.5 EPS (cont. ops., pro forma) $0.72 No guidance MMS only provides annual guidance. Consensus EPS $0.79 FY09 Revenue ($M, cont. ops.) $746.5 $745M - $755M Maintained prior guidance. Also reiterating preliminary FY10 guidance of 7% growth, although maintaing prior FY10 guidance due to the new UK win, which is offsetting program reductions, mainly in CA. Previously, MMS' 7% guidance excluded new wins, so we view this as a reduction in like-for-like guidance. Consensus Revenue ($M) $746.1 EPS $2.73 $2.75 - $2.85 Maintained prior guidance, and guidance excludes $0.16 benefit from legal and settlement recovery. Consensus EPS $2.76 FCF ($M) $5.6 $15M - $25M Maintained cash from operations guidance of $35M - $45M ($15M - $25M FCF), which excludes $11M payment due to divestiture. Source: Company Filings, FirstCall Estimates, and Stifel Nicolaus Estimates. • MMS reiterated its prior FY10 revenue guidance of 7% growth, although this now includes a new 5 year, $200M UK employment services deal, which we estimate adds ~2% revenue growth in FY10. Excluding this new contract, we view like-for-like prior guidance as having been reduced to ~5% growth, which reflects S&L budget difficulties, most notably in CA (where MMS indicated CA Healthy Families contract has been impacted). • The company also reiterated prior FY09 guidance on both the top and bottom lines. Revenue guidance remains $745M - $755M and EPS guidance, which excludes the legal and settlement recovery in F3Q09, was maintained at $2.75 – $2.85. • FY09 cash from operations is also unchanged at $35M - $45M, excluding a $11M divestiture-related payment. • However, the company seemed to us to back away somewhat from prior comments around margin expansion YOY in FY10. MMS seemed to indicate that they now expect more flattish YOY margins, early losses on the new UK contract (less revenue recognized against costs in the early stages of the contract, more pronounced in F1H10). Maximus, Inc. (MMS) August 7, 2009


Page 5 Estimates ESTIMATES F4Q09 Current Prior Variance YOY Change Comment Revenue ($M, as reported) $200.6 $192.9 $7.8 6.1% Up from our prior estimate, as MMS should have good visibility on the remaining quarter. We now expect FY09 revenue at the midpoint of guidance. Gross Margin 26.3% 26.4% - 10 bps - 60 bps Operating Margin (excl. charges) 11.5% 10.6% + 90 bps + 100 bps Expect profitability improvements QOQ in both segments. Diluted EPS (pro forma, cont. ops.) $0.79 $0.72 $0.07 11.3% Above our prior estimate on higher revenue and margin assumptions. We now expect FY09 EPS to be near the midpoint of guidance. FCF ($M) $7.5 $2.8 $4.7 ($9.4) FY09 Current Prior Variance YOY Change Comment Revenue ($M, as reported) $750.2 $746.5 $3.6 -7.2% Up modestly from our prior guidance, as we now expect FY09 revenue at the midpoint of guidance of $745M - $755M. Gross Margin 26.0% 26.1% - 10 bps - 30 bps Operating Margin (excl. charges) 10.9% 10.6% + 30 bps + 180 bps Up slightly due to better than expected F3Q09 and expectations of ongoing profitability improvement in F4Q09. Diluted EPS (pro forma, cont. ops.) $2.79 $2.73 $0.06 -2.4% Near the midpoint of guidance of $2.75 - $2.85. FCF ($M) $15.4 $5.6 $9.8 ($25.7) Slightly above guidance of $15M - $25M, including an $11M divestiture payment. FY10 Current Prior Variance YOY Change Comment Revenue ($M, as reported) $801.4 $795.1 $6.3 6.8% We expect FY10 growth to be near preliminary guidance of 7% growth, as new UK contract win offsets some revenue pressures (MMS expects CA Healthy Families revenue to decline by ~$12M). Gross Margin 25.7% 26.1% - 40 bps - 30 bps Operating Margin (excl. charges) 11.0% 11.0% No change + 10 bps In line with our prior estimate, but we now expect relative flat OPM YOY, given F1H10 margin pressure from new U.K. contract. Diluted EPS (pro forma) $3.10 $3.22 ($0.12) 11.1% Below prior estimate, as we now expect MMS to utilize only half of current $54.1M repurchase authorization over the next 5 quarters. FCF ($M) $50.4 $49.1 $1.4 $35.1 Calendar Year Current Prior Variance YOY Change Comment CY09 Revenue ($M, as reported) $762.2 $757.9 $4.3 -3.0% CY09 Pro forma EPS $2.83 $2.80 $0.03 -3.8% CY10 Revenue ($M, as reported) $804.6 $814.2 ($9.6) 5.6% CY10 Pro forma EPS $3.17 $3.29 ($0.12) 12.2% Source: Company data and Stifel Nicolaus. Valuation MMS shares are trading at 14.8x CY09 EPS of $2.83 (down 3.8% YOY) and 13.2x CY10 EPS of $3.17 (up 12.2% YOY), roughly in line with the Commercial comp group, excl. MMS, at 15.4x CY09 and 13.3x CY10, though well below the State and Local comp group, excl. MMS, at 24.4x CY09 and 18.9x CY10. MMS stock does not look particularly expensive to us on some metrics (notably CY09 and CY10 P/E and CY09 EBITDA), with CY09 FCF yield being an exception. However, we are maintaining our cautious stance on MMS largely due to the still difficult S&L fiscal situation (the next two state fiscal years are shaping up to be very poor from a budget standpoint), UK contract start up costs in FY10 (losses expected to be $0.05 - $0.10), and a lack of sustained positive catalysts. While on the one had there are positive catalysts for the stock, including a seemingly increasing flow of stimulus-related deals, the new UK government contract will not reach full revenue and profitability run rate until FY11, and there are also potential negatives (the S&L fiscal situation being the biggest impact) which we expect will keep a lid on the positive impacts in the near term. Maintain Hold on the share. Maximus, Inc. (MMS) August 7, 2009


Page 6 Company Description Founded in 1975, Maximus is a leader in providing program management support (including both IT services and business process outsourcing) and consulting services primarily to health and human services agencies in state and local governments. Maximus utilizes technology combined with its strong program management skills and understanding of government agencies' business processes to result in an operation that is more efficient than governments could achieve on their own at similar costs. Maximus is based in McLean, Virginia. Maximus, Inc. (MMS) August 7, 2009


Page 7 Stifel, Nicolaus and Company, Inc. Fiscal year ends September 30 Income Statement 2007 1Q08 2Q08 3Q08 4Q08 2008 1Q09 2Q09 3Q09 4Q09E 2009E 1Q10E 2Q10E 3Q10E 4Q10E 2010E 2011E Revenue (as reported) $ 738,646 $ 201,950 $ 210,584 $ 206,324 $ 189,069 $ 807,927 $ 180,092 $ 184,201 $ 185,240 $ 200,618 $ 750,151 $ 192,163 $ 194,176 $ 204,433 $ 210,649 $ 801,421 $ 848,674 Year-over-year % Change (as reported) 5.4% 25.3% 17.6% 5.0% -6.3% 9.4% -10.8% -12.5% -10.2% 6.1% -7.2% 6.7% 5.4% 10.4% 5.0% 6.8% 5.9% Year-over-year % Change (continuing ops.) 34.4% 25.7% 11.4% 8.8% 19.0% 1.7% -2.9% -2.2% 6.1% 0.7% Sequential % Change 5.4% 0.0% 4.3% -2.0% -8.4% 9.4% -4.7% 2.3% 0.6% 8.3% -7.2% -4.2% 1.0% 5.3% 3.0% 6.8% 5.9% Salaries, wages and other 561,563 149,183 156,694 151,086 138,260 595,223 132,945 137,090 137,187 147,909 555,131 143,777 144,999 151,401 155,304 595,482 630,593 Gross Profit 177,083 52,767 53,890 55,238 50,809 212,704 47,147 47,111 48,053 52,709 195,020 48,385 49,177 53,032 55,344 205,938 218,081 Gross Margin 24.0% 26.1% 25.6% 26.8% 26.9% 26.3% 26.2% 25.6% 25.9% 26.3% 26.0% 25.2% 25.3% 25.9% 26.3% 25.7% 25.7% Selling Gen & Admin 131,752 33,033 35,019 35,213 29,126 132,391 25,472 25,912 26,477 28,899 106,760 27,371 27,509 29,220 30,344 114,445 121,193 Stock Option Expense 3,829 1,020 2,154 1,595 1,774 6,543 1,866 2,084 1,678 800 6,428 800 800 800 800 3,200 3,200 Consolidating Adjustment & Other - - - - - - - - - - - - - - - - - Charges/Nonrecurring Items 44,638 2,200 931 3,737 44,327 51,195 - 368 (4,829) - (4,461) - - - - - - Total Operating Expense 180,219 36,253 38,104 40,545 75,227 190,129 27,338 28,364 23,326 29,699 108,727 28,171 28,309 30,020 31,144 117,645 124,393 % of Revenue 24.4% 18.0% 18.1% 19.7% 39.8% 23.5% 15.2% 15.4% 12.6% 14.8% 14.5% 14.7% 14.6% 14.7% 14.8% 14.7% 14.7% Operating Income (GAAP) (3,136) 16,514 15,786 14,693 (24,418) 22,575 19,809 18,747 24,727 23,010 86,293 20,214 20,867 23,012 24,200 88,293 93,688 % Change 11.0% -195.0% 580.4% -248.0% -211.8% -819.9% 20.0% 18.8% 68.3% -194.2% 282.2% -10.5% 5.3% 22.7% -2.1% 2.3% 6.1% Oper. Margin (GAAP) -0.4% 8.2% 7.5% 7.1% -12.9% 2.8% 11.0% 10.2% 13.3% 11.5% 11.5% 10.5% 10.7% 11.3% 11.5% 11.0% 11.0% Oper. Margin (Continuing Ops.) 10.9% 11.7% 14.3% -12.9% 5.9% Operating Margin (excl. charges) 5.6% 9.3% 7.9% 8.9% 10.5% 9.1% 11.0% 10.4% 10.7% 11.5% 10.9% 10.5% 10.7% 11.3% 11.5% 11.0% 11.0% Investment Income 5,804 1,501 107 490 325 2,423 94 35 129 179 437 185 196 209 291 882 3,225 Minority Interest 451 - - - - - - - - - - - - - - - - Income Before Income Taxes 3,119 18,015 15,893 15,183 (24,093) 24,998 19,903 18,782 24,856 23,189 86,730 20,399 21,064 23,221 24,491 89,175 96,913 Pretax Margin 0.4% 8.9% 7.5% 7.4% -12.7% 3.1% 11.1% 10.2% 13.4% 11.6% 11.6% 10.6% 10.8% 11.4% 11.6% 11.1% 11.4% % Change -22.7% -211.1% 303.9% -268.1% -198.6% 701.5% 10.5% 18.2% 63.7% -196.2% 246.9% -18.4% 5.8% 23.6% -1.5% 2.8% 8.7% Provision for Income Taxes 11,374 7,410 6,266 5,379 (9,321) 9,734 7,862 7,419 9,818 9,160 34,259 8,057 8,320 9,172 9,674 35,224 38,280 Tax Rate 364.7% 41.1% 39.4% 35.4% 38.7% 38.9% 39.5% 39.5% 39.5% 39.5% 39.5% 39.5% 39.5% 39.5% 39.5% 39.5% 39.5% Income from Continuing Ops. (8,255) 12,268 13,489 17,296 (14,772) 28,281 12,041 11,363 15,038 14,029 52,471 12,341 12,744 14,049 14,817 53,951 58,633 Margin -1.1% 6.1% 6.4% 8.4% -7.8% 3.5% 6.7% 6.2% 8.1% 7.0% 7.0% 6.4% 6.6% 6.9% 7.0% 6.7% 6.9% Income from Discontinued Ops. - (1,663) (3,862) (5,891) (10,188) (21,604) (78) (336) (55) - (469) Net Income (8,255) 10,605 9,627 11,405 (24,960) 6,677 11,963 11,027 14,983 14,029 52,002 Net Margin -1.1% 5.3% 4.6% 5.5% -13.2% 0.8% 6.6% 6.0% 8.1% 7.0% 6.9% Earnings Per Share (GAAP) ($0.40) $0.51 $0.51 $0.61 ($1.35) $0.35 $0.67 $0.62 $0.84 $0.79 $2.92 $0.70 $0.73 $0.81 $0.86 $3.10 $3.38 % Change NM NM NM NM NM NM 31.4% 21.6% 37.7% NM NM 5.4% 17.5% -3.4% 8.8% 6.3% 9.0% ($ in thousands, except per share) Income Statement Maximus, Inc. Earnings Per Share (Continuing Ops.) $0.59 $0.72 $0.92 ($0.80) $1.47 $0.67 $0.64 $0.84 $0.79 $2.95 $0.70 $0.73 $0.81 $0.86 $3.10 $3.39 % Change 13.6% -11.1% -8.7% -198.8% 100.7% 4.5% 14.1% -3.6% 8.9% 5.1% 9.4% Earnings Per Share (Continuing Ops., pro forma) $0.59 $0.75 $0.81 $0.71 $2.86 $0.67 $0.65 $0.68 $0.79 $2.79 $0.70 $0.73 $0.81 $0.86 $3.10 $3.39 % Change 13.6% -13.3% -16.0% 11.3% -2.4% 4.5% 12.3% 19.1% 8.9% 11.1% 9.4% Shares Outstanding (000s) 22,029 20,854 18,763 18,819 18,540 19,244 17,956 17,751 17,839 17,710 17,814 17,581 17,453 17,324 17,195 17,388 17,320 Calendar Year CY08 CY09 CY10 EPS (Continuing Ops., pro forma) $2.94 $2.83 $3.17 % Change YOY -3.8% 12.2% Ratios 2007 1Q08 2Q08 3Q08 4Q08 2008 1Q09 2Q09 3Q09 4Q09E 2009E 1Q10E 2Q10E 3Q10E 4Q10E 2010E 2011E A/R in Days Sales 85 75 75 77 76 71 65 64 72 73 78 65 69 68 72 76 76 A/P and Accrued Days Op. Exp. 28 26 25 25 26 24 21 29 27 27 29 20 26 25 27 28 28 Current Ratio 3.03 2.1 2.3 2.4 1.9 1.92 2.3 2.3 2.4 2.3 2.29 2.6 2.5 2.4 2.4 2.36 2.57 Return on Assets, avg -1.5% 8.7% 9.1% 9.1% -13.3% 52.2% 11.7% 12.0% 15.0% 13.3% 43.4% 11.6% 12.0% 12.7% 12.9% 47.9% 46.8% Return on Equity, avg. -2.0% 12.4% 13.8% 13.5% -20.6% 19.4% 18.1% 17.5% 22.1% 19.6% 17.0% 16.8% 17.0% 18.3% 18.8% 17.7% 16.9% NOPAT/Capital* 1.9% 10.8% 13.0% 12.4% -18.3% 16.6% 15.3% 16.1% 20.3% 18.0% 14.6% 15.5% 15.7% 16.9% 17.4% 16.3% 15.4% Book Value, end $18.36 $13.07 $15.18 $15.78 $14.87 $14.33 $14.28 $14.74 $15.87 $16.42 $16.32 $16.88 $17.37 $17.94 $18.57 $18.36 $21.61 Some calculations may vary due to rounding. Source: Maximus, Inc. data and Stifel Nicolaus estimates George A. Price, Jr. (443) 224-1323 gaprice@stifel.com 8/6/2009 Shlomo H. Rosenbaum (443) 224-1322 shrosenbaum@stifel.com Richard M. Eskelsen (443) 224-1366 eskelsenr@stifel.com Maximus, Inc. (MMS) August 7, 2009


Page 8 Stifel, Nicolaus and Company, Inc. Maximus, Inc. Balance Sheet and Cash Flow ($ in thousands) FY ends September 30 Balance Sheet FY07 1Q08 2Q08 3Q08 4Q08 FY08 1Q09 2Q09 3Q09 4Q09E FY09E 1Q10E 2Q10E 3Q10E 4Q10E FY10E FY11E Cash and short-term investments 62,654 $ 63,747 $ 78,271 $ 120,957 $ 64,004 $ 87,539 $ 95,368 $ 95,719 $ 101,375 $ 108,146 $ 115,278 $ 117,568 $ Accounts receivable, net 119,267 122,692 126,793 128,819 101,876 96,350 116,884 124,829 108,892 114,348 124,452 128,730 Unbilled receivables 49,771 52,314 49,721 30,695 28,180 35,388 30,290 37,894 30,069 35,147 28,885 39,789 Prepaid and other current assets 7,688 15,719 11,649 10,215 12,321 35,730 27,547 27,547 27,547 27,547 27,547 27,547 Deferred taxes 11,267 9,490 10,255 25,750 40,029 8,735 12,695 12,695 12,695 12,695 12,695 12,695 Total current assets 250,647 263,962 276,689 316,436 246,410 263,742 282,784 298,684 280,578 297,883 308,857 326,329 Property, plant and equipment, net 35,580 34,333 33,799 33,994 33,392 33,549 37,845 41,044 43,028 45,062 47,353 49,799 Net Software Development Costs 29,306 29,183 29,714 14,125 14,362 16,681 17,201 17,201 17,201 17,201 17,201 17,201 Deferred contract costs 7,712 6,273 5,435 5,324 6,384 7,604 8,530 8,530 8,530 8,530 8,530 8,530 Deferred taxes - - - 10,933 3,217 1,440 - - - - - - Other assets 92,833 92,518 91,326 69,483 66,303 65,007 66,817 66,817 66,817 66,817 66,817 66,817 Total assets 416,078 426,269 436,963 450,295 370,068 388,023 413,177 432,276 416,154 435,493 448,758 468,676 Current liabilities: Accounts payable 52,441 53,391 51,802 48,950 36,799 53,218 49,971 53,042 37,855 50,572 51,135 55,694 Accrued compensation and benefits 25,771 28,390 29,417 26,684 22,681 24,932 26,830 33,397 24,504 24,469 28,097 35,067 Billings in excess of costs and estimated earnings 37,461 33,151 33,836 19,676 21,441 19,351 21,824 23,636 25,622 25,890 27,258 27,158 Notes payable & other (cap. lease obligations) 1,643 1,238 830 417 - - - - - - - - Income taxes payable - - - 4,011 - - - - - - - - Deferred taxes 2,675 998 1,237 64,919 24,202 19,435 20,262 20,262 20,262 20,262 20,262 20,262 S corporation distribution payable - - - - - - - - - - - - Total current liabilities 119,991 117,168 117,122 164,657 105,123 116,936 118,887 130,337 108,242 121,193 126,751 138,181 Long-term debt - - - - - - - - - - - - Deferred taxes 11,202 12,752 11,810 1,617 1,668 1,573 2,212 2,212 2,212 2,212 2,212 2,212 Other liabilities 12,319 11,470 10,996 8,315 6,861 7,884 8,972 8,972 8,972 8,972 8,972 8,972 Total liabilities 143,512 141,390 139,928 174,589 113,652 126,393 130,071 141,521 119,426 132,377 137,935 149,365 Redeemable common stock - - - - - - - - - - - - Common stock - - - - - - - - - - - - Additional paid-in capital 31,976 36,514 39,130 39,220 18,496 11,542 20,138 14,728 9,318 3,908 (1,502) (6,912) Retained earnings 240,590 248,365 257,905 236,486 237,920 250,088 262,968 276,026 287,410 299,208 312,325 326,223 Total stockholders' equity 272,566 284,879 297,035 275,706 256,416 261,630 283,106 290,754 296,728 303,116 310,823 319,311 Total liab & stockholders' equity 416,078 426,269 436,963 450,295 370,068 388,023 413,177 432,276 416,154 435,493 448,758 468,676 15.9% Cash Flow Statement FY07 1Q08 2Q08 3Q08 4Q08 FY08 1Q09 2Q09 3Q09 4Q09E FY09E 1Q10E 2Q10E 3Q10E 4Q10E FY10E FY11E Cash flows from operating activities Net income$ (8,255) $ 10,605 $ 9,627 $ 11,405 $ (24,960) $ 6,677 $ 11,963 $ 11,027 $ 14,983 $ 14,029 $ 52,002 $ 12,341 $ 12,744 $ 14,049 $ 14,817 $ 53,951 $ 58,633 Deferred taxes 4,195 3,327 (1,707) (26,015) 12,043 10,616 (309) - - - - - Depreciation and amortization 5,039 4,799 4,271 (1,581) 2,746 2,982 2,820 2,820 2,820 2,820 2,820 2,820 Other 3,600 2,154 (4,588) 33,370 2,051 2,472 1,834 800 800 800 800 800 Funds from operations 23,439 19,907 9,381 (19,186) 28,803 27,097 19,328 17,649 15,961 16,364 17,669 18,437 (Increase) decrease in A/R 13,695 (3,425) (4,101) (2,026) 26,943 5,526 (20,534) (7,945) 15,937 (5,456) (10,104) (4,278) (Increase) decrease in excess costs and earnings (7,571) (2,543) 2,593 19,026 2,515 (7,208) 5,098 (7,604) 7,826 (5,078) 6,261 (10,904) (Increase) decrease in prepaid other c/a 1,471 (8,031) 4,070 1,434 (2,106) (23,409) 8,183 - - - - - (Increase) decrease in other assets - - - - - - - - - - - - Increase (decrease) in compensation (3,678) 2,619 1,027 (2,733) (4,003) 2,251 1,898 6,567 (8,893) (34) 3,627 6,970 Increase (decrease) in A/P (1,984) 950 (1,589) (2,852) (12,151) 16,419 (3,247) 3,071 (15,188) 12,717 563 4,560 Increase (decrease) in income tax payable - - - 4,011 (4,011) - - - - - - - Increase (decrease) in excess billings (680) (2,871) 1,523 (14,049) 705 (3,310) 1,547 1,812 1,986 268 1,368 (100) Increase (decrease) in other liabilities 2,176 (849) (474) (2,681) (1,454) 1,023 1,088 - - - - - Other changes to working capital (plug) (6,079) (1,253) 369 37,537 (62,418) 20,472 (1,560) - - - - - Working capital changes (2,650) (15,403) 3,418 37,667 (55,980) 11,764 (7,527) (4,099) 1,668 2,417 1,716 (3,752) Net cash provided by operating activities 51,190 20,789 4,504 12,799 18,481 56,573 (27,177) 38,861 11,801 13,550 37,035 17,629 18,780 19,385 14,686 70,480 73,589 Capital expenditures, net (17,893) (4,083) (3,055) (6,730) (1,581) (15,449) (4,142) (5,448) (6,033) (6,019) (21,642) (4,804) (4,854) (5,111) (5,266) (20,036) (21,217) % of revenue 2.4% 2.0% 1.5% 3.3% 0.8% 1.9% 2.3% 3.0% 3.3% 3.0% 2.9% 2.5% 2.5% 2.5% 2.5% 2.5% 2.5% Acquisitions - - 10,572 29,885 - - - - - - - - Other investing activities (plug) - - 59 (2,815) (1,667) 282 3,710 - - - - - Net cash used by investing activities (4,083) (3,053) 3,901 25,489 (5,809) (5,166) (2,323) (6,019) (4,804) (4,854) (5,111) (5,266) Free Cash Flow (excluding acquisitions) 33,297 16,706 1,449 6,069 16,900 41,124 (31,319) 33,413 5,768 7,532 15,394 12,825 13,926 14,274 9,420 50,444 52,372 % of net income -403.4% 145.4% 29.3% 93.5% 89.3% Increase (decrease) in debt (401) (404) (408) (414) (417) - - - - - - - Increase (decrease) in equity (148,733) 2,195 97 990 (21,785) (8,071) 452 (5,410) (5,410) (5,410) (5,410) (5,410) Other financing activities (incl. dividend) (1,925) (2,149) (1,865) (1,860) (1,765) (2,089) (2,101) (1,771) (1,758) (1,745) (1,732) (1,719) Net cash provided from financing activities (151,059) (358) (2,176) (1,284) (23,967) (10,160) (1,649) (7,181) (7,168) (7,155) (7,142) (7,129) Net increase (decrease) in cash and cash equivalents 38,635 (134,353) 1,093 14,524 42,686 (76,050) (56,953) 23,535 7,829 351 (25,238) 5,657 6,771 7,132 2,290 21,849 45,444 Source: Maximus, Inc. and Stifel Nicolaus estimates George A. Price, Jr. (443) 224-1323 gaprice@stifel.com 8/6/2009 Shlomo H. Rosenbaum (443) 224-1322 shrosenbaum@stifel.com Richard M. Eskelsen (443) 224-1366 eskelsenr@stifel.com Maximus, Inc. (MMS) August 7, 2009


Page 9 Commercial IT Services Companies Stifel, Nicolaus & Company, Inc. Valuation Data: ($ in millions, except per share data) Equity PE/Growth (PEG) Enterprise Enterprise Value/ Cash Flow Price Annual Annual Market CY CY CY CY Market Trailing Twelve Months CY09 Enterprise Value/ CY09 FCF Ticker Company 8/6/2009 High Low Value 2009 2010 2009 2010 Value Revenue EBIT EBITDA EBITDA TTM FCF CY09 FCF Yield ACN Accenture, Ltd. (1) (3) (12) $35.15 $43.04 $24.76 $27,516 13.3 x 12.7 x Neg 2.8 $23,506 0.97 x 7.8 x 6.7 x 7.2 x 8.2 x 9.4 x 9.1 % ACS Affiliated Comp. Services, Inc. (1) (7) (12) 46.92 54.39 34.84 4,602 11.8 10.6 1.4 1.0 6,208 0.95 8.8 5.6 5.6 12.1 14.4 9.3 CBR CIBER, Inc. (1) (12) 3.15 8.97 2.03 220 10.6 8.8 Neg 0.4 299 0.27 8.3 5.5 5.8 4.6 7.5 18.6 CSC Computer Sciences Corp. (1) (5) (12) 48.65 49.37 23.93 7,434 9.7 9.2 0.4 2.0 9,751 0.60 8.2 4.2 4.0 8.0 9.5 13.7 DTPI Diamond Mgmt. & Tech. Consultants (1) (6) (12) 5.23 6.33 1.96 143 33.4 20.2 0.0 0.3 95 0.54 Neg Neg 9.8 6.4 Neg Neg HCKT The Hackett Group, Inc. 2.92 6.65 1.78 113 20.9 10.8 Neg 0.1 87 0.47 5.8 4.9 8.1 5.9 NE NE HEW Hewitt Associates Inc. (1) (4) 32.44 42.22 22.78 3,101 12.0 10.7 0.4 0.8 3,302 1.04 9.3 6.3 5.5 11.2 11.9 9.0 HURN Huron Consulting Group, Inc. (10) 14.45 66.45 11.30 293 6.1 4.4 0.6 0.1 605 0.87 6.3 4.4 4.6 5.3 4.9 42.3 MMS Maximus, Inc. (1) (9) (12) 41.86 43.68 25.94 747 14.8 13.2 Neg 1.1 651 0.88 8.4 7.7 6.6 32.7 10.9 8.0 NSTC Ness Technologies, Inc. 5.30 13.00 2.36 209 11.8 9.3 Neg 0.3 232 0.36 7.7 4.7 NE 9.1 NE NE PER Perot Systems Corp. (1) (8) (12) 16.00 18.82 10.58 1,943 16.3 15.8 9.1 4.9 1,799 0.68 9.9 6.0 5.8 11.5 12.8 7.2 PRFT Perficient, Inc. (12) 7.40 10.29 2.31 206 NM 31.0 NM NA 174 0.83 19.9 11.4 23.3 5.6 NE 10.7 SAPE Sapient 6.57 9.97 3.25 857 24.3 18.8 Neg NM 716 1.06 10.8 8.4 10.6 15.1 NE NE UIS Unisys Corp. (11) (12) 2.10 4.29 0.28 786 17.5 12.4 Neg 0.3 1,373 0.28 15.7 2.9 NE 8.3 NE NE WW Watson Wyatt (1) 37.63 62.00 32.56 1,610 11.9 11.2 Neg 1.9 1,531 0.88 7.3 5.4 5.9 9.2 9.6 9.8 Mean: Total 15.3 x 13.3 x 2.0 x 1.2 x Total 0.71 x 9.6 x 6.0 x 7.9 x 10.2 x 10.1 x 13.8 % Median: $49,779 12.7 11.2 0.5 0.8 $50,330 0.83 8.3 5.6 5.9 8.3 9.6 9.6 Mean: (Larger Caps) (2) 12.5 x 11.7 x 2.8 x 2.2 x 0.85 x 8.5 x 5.7 x 5.7 x 10.0 x 11.3 x 9.7 % Median: (Larger Caps) (2) 12.0 11.0 0.9 1.9 0.92 8.5 5.8 5.7 10.2 10.7 9.2 Financial Data: Balance Sheet Data ($ in millions) Trailing Twelve Months Goodwill Total TTM Capex/ Returns TTM Revenue/EPS Growth Gross Net Cash as % of Debt/ TTM Total LQA Rev. per TTM CY09 Ticker Company Revenue CY09 CY10 Margin EBIT EBITDA Income Balance Total Assets Total Capital Revenue Employees Employee DSO ROE/ROIC ROE/ROIC ACN Accenture, Ltd. (1) (3) (12) $24,226.6 -10.9 / -4.9 % 2.2 / 4.5 % 29.2 % 12.4 % 14.5 % 8.6 % $4,011.9 6.8 % 0.1 % 1.1 % 177,007 125,133 61 71.2 / 69.6 % 70.9 / 58.7 % ACS Affiliated Comp. Services, Inc. (1) (7) (12) 6,523.2 5.4 / 8.6 6.9 / 10.9 55.1 10.9 16.9 5.6 730.9 48.3 47.1 5.6 74,000 91,687 75 14.2 / 10.2 14.7 / 10.6 CBR CIBER, Inc. (1) (12) 1,098.6 -13.2 / -40.0 2.7 / 20.8 26.1 3.3 4.9 2.2 34.5 58.3 18.7 1.0 8,500 122,637 78 4.9 / 4.5 4.2 / 3.8 CSC Computer Sciences Corp. (1) (5) (12) 16,201.0 -5.7 / 26.6 4.2 / 4.7 20.9 7.4 14.4 3.9 1,920.0 24.4 41.1 3.3 92,000 169,478 92 10.9 / 9.3 12.6 / 10.9 DTPI Diamond Mgmt. & Tech. Consultants (1) (6) (12) 175.8 -2.8 / NM 10.3 / 65.1 27.8 Neg Neg 1.0 48.1 0.0 0.0 0.9 551 326,475 30 2.5 / 2.4 -9.7 / 24.8 HCKT The Hackett Group, Inc. 187.8 -24.0 / -57.6 21.3 / 92.9 39.3 8.0 9.5 8.0 25.7 52.1 0.0 1.4 723 218,622 49 15.9 / 15.3 NE HEW Hewitt Associates Inc. (1) (4) 3,174.9 -5.1 / 29.6 1.7 / 12.7 37.7 11.2 16.5 7.0 451.1 18.7 48.1 3.9 23,000 137,313 61 31.7 / 25.9 32.6 / 30.6 HURN Huron Consulting Group, Inc. (10) 698.4 9.9 / 10.8 14.6 / 40.7 36.7 13.8 19.7 6.1 9.6 69.3 48.8 2.6 1,551 457,122 69 13.0 / 8.6 NE MMS Maximus, Inc. (1) (9) (12) 738.6 0.8 / -3.8 3.4 / 12.2 26.1 10.5 11.5 6.4 95.4 15.6 0.0 2.3 6,000 123,493 72 17.9 / 22.6 19.1 / 24.1 NSTC Ness Technologies, Inc. 641.5 -10.4 / -49.4 7.2 / 26.7 27.9 4.7 7.6 2.1 58.0 44.0 17.8 2.4 8,000 68,217 145 3.6 / 5.6 NE PER Perot Systems Corp. (1) (8) (12) 2,643.0 -9.0 / 1.8 4.1 / 3.2 18.6 6.9 11.3 4.5 329.0 36.2 11.7 2.2 23,000 109,217 57 8.9 / 9.5 8.6 / 9.8 PRFT Perficient, Inc. (12) 211.3 -19.2 / -87.0 3.7 / 396.2 35.1 4.1 7.2 2.1 31.3 60.4 0.0 0.4 1,162 154,661 73 2.7 / 2.5 NE SAPE Sapient 676.3 -7.9 / -43.8 18.5 / 29.6 32.8 9.8 12.7 9.1 140.1 15.4 0.0 2.2 5,922 100,852 85 20.2 / 24.2 NE UIS Unisys Corp. (11) (12) 4,820.5 -13.6 / NM -0.3 / 41.7 21.2 1.8 10.0 (1.6) 475.0 7.2 NM 3.6 26,000 173,646 59 NM / -7.5 NE WW Watson Wyatt (1) 1,733.3 -9.4 / -13.4 5.9 / 6.0 38.0 12.1 16.4 9.1 118.3 45.4 4.7 3.7 7,700 216,620 71 18.0 / 17.9 16.3 / 17.7 Mean: Total 31.5 % 8.4 % 12.4 % 4.9 % 33.5 % 17.0 % 2.4 % 72 Median: $63,751 29.2 8.9 12.1 5.6 36.2 8.2 2.3 71 Mean (excl. negatives): 31.5 % 8.4 % 12.4 % 5.1 % Median (excl. negatives): 29.2 8.9 12.1 5.6 Notes: * Not included in mean and median calculations (1) Stifel Nicolaus Research estimates. (2) Includes ACN, ACS, CSC, HEW, PER, and WW. (3) Accenture (ACN) ROIC is GROSS of cash and investments. (4) Hewitt TTM EBIT and EBITDA exclude significant goodwill and asset impairment charges (5) CSC net income and FCF exclude restructuring and impairment charges. (6) DTPI FCF excludes ~$20M, based on management's estimate of cash needed to repurchase shares to offset dilutive equity comp. (7) Affiliated Comp. Services EBIT, EBITDA, and NI exclude one-time charges. (8) PER TTM EBIT and NI exclude the $46M TRIAD termination benefit and $18M restructuring charge (9) MMS financials are on continuing operations basis. (10) HURN covered by our colleage Jim Janesky; estimates from his model (11) Reflects C4Q08 financials. (12) Results reflect C2Q09 financials. Unless otherwise noted, all results reflect C1Q09 financials. Sources: Company data, Bloomberg Financial Markets, First Call estimates, FactSet Research Systems and Stifel Nicolaus Research estimates. Price/Earnings Ratio George A. Price, Jr. gaprice@stifel.com (443) 224-1323 Shlomo H. Rosenbaum shrosenbaum@stifel.com (443) 224-1322 Richard M. Eskelsen eskelsenr@stifel.com (443) 224-1366 Maximus, Inc. (MMS) August 7, 2009


Page 10 State and Local Companies Stifel, Nicolaus & Company, Inc. Valuation Data: ($ in millions, except per share data) Equity PE/Growth (PEG) Enterprise Enterprise Value/ Cash Flow Price Annual Annual Market CY CY CY CY Market Trailing Twelve Months CY09 Enterprise Value/ CY09 FCF Ticker Company 8/6/2009 High Low Value 2009 2010 2009 2010 Value Revenue EBIT EBITDA EBITDA TTM FCF CY09 FCF Yield ACS Affiliated Comp. Services, Inc. (1) (2) (4) 46.92 54.39 34.84 4,602 11.8 10.6 1.4 1.0 6,208 0.95 8.8 5.6 5.6 12.1 14.4 9.3 EGOV NIC Inc. 7.91 8.19 3.28 497 37.7 26.4 3.6 0.6 450 4.36 24.3 20.2 NE 23.0 NE NE HMSY HMS Holdings Corp. 36.05 43.00 18.91 981 34.0 27.3 1.0 1.1 943 4.83 23.1 17.7 14.9 30.0 NE NE MMS Maximus, Inc. (1) (3) (4) 41.86 43.68 25.94 747 14.8 13.2 Neg 1.1 651 0.88 8.4 7.7 6.6 32.7 10.9 8.0 TIER Tier Technologies Inc. 7.45 8.42 3.41 147 Neg NE Neg NE 107 0.85 Neg Neg NE Neg NE NE TYL Tyler Technologies, Inc. (4) 15.21 17.76 9.79 559 21.1 17.9 0.9 1.0 565 2.02 16.6 12.4 10.1 30.6 NE NE UIS Unisys Corp. (4) 2.10 4.29 0.28 786 17.5 12.4 Neg 0.0 1,373 0.28 15.7 2.9 * NE 8.3 NE NE Mean: Total 22.8 x 18.0 x 1.7 x 0.8 x Total 2.02 x 16.1 x 11.1 x 9.3 x 22.8 x 12.7 x 8.7 % Median: $8,319 19.3 15.5 1.2 1.0 $10,297 0.95 16.2 10.1 8.3 26.5 12.7 8.7 Financial Data: Balance Sheet Data ($ in millions) Trailing Twelve Months Goodwill Total TTM Capex/ Returns TTM Revenue/EPS Growth Gross Net Cash as % of Debt/ TTM Total LQA Rev. per TTM CY09 Ticker Company Revenue CY09 CY10 Margin EBIT EBITDA Income Balance Total Assets Total Capital Revenue Employees Employee DSO ROE/ROIC ROE/ROIC ACS Affiliated Comp. Services, Inc. (1) (2) (4) 6,523.2 5.4 / 8.6 6.9 / 10.9 55.1 10.9 16.9 5.6 730.9 48.3 47.1 5.6 74,000 91,687 75 14.2 / 10.2 14.7 / 10.6 EGOV NIC Inc. 103.3 10.1 / 10.5 12.5 / 42.9 43.7 18.0 21.6 11.3 46.7 0.0 0.0 3.0 473 231,797 116 19.7 / 141.9 NE HMSY HMS Holdings Corp. 195.5 21.0 / 32.5 19.3 / 24.5 32.8 20.9 27.3 12.2 53.1 8.3 7.6 3.6 874 228,563 84 12.9 / 15.8 NE MMS Maximus, Inc. (1) (3) (4) 738.6 0.8 / -3.8 3.4 / 12.2 26.1 10.5 11.5 6.4 95.4 15.6 0.0 2.3 6,000 123,493 72 17.9 / 22.6 19.1 / 24.1 TIER Tier Technologies Inc. 126.0 -1.0 / -38.6 NE / NE 23.3 Neg Neg Neg 39.8 24.6 0.0 1.8 412 277,748 29 -10.4 / -12.1 NE TYL Tyler Technologies, Inc. (4) 279.9 10.8 / 24.1 11.5 / 18.1 43.3 12.1 16.2 5.5 9.4 44.5 11.2 7.1 1,973 141,034 108 13.0 / 15.4 NE UIS Unisys Corp. (4) 4,820.5 -13.6 / NM -0.3 / 41.7 21.2 1.8 10.0 Neg 475.0 7.2 (374.7) 3.6 26,000 173,646 59 NM / -7.5 NE Mean: Total 35.1 % 12.4 % 17.2 % 8.2 % 21.2 % (44.1) % 3.9 % 78 Median: $12,787 32.8 11.5 16.6 6.4 15.6 0.0 3.6 75 Mean (excl. negatives): 35.1 % 12.4 % 17.2 % 8.2 % Median (excl. negatives): 32.8 11.5 16.6 6.4 Notes: * Not included in mean and median calculations (1) Stifel Nicolaus Research estimates. (2) Affiliated Comp. Services EBIT, EBITDA, and NI exclude one-time charges. (3) MMS financials are on continuing operations basis. (4) Results reflect C2Q09 financials. Unless otherwise noted, all results reflect C1Q09 financials. Sources: Company data, Bloomberg Financial Markets, First Call estimates, FactSet Research Systems and Stifel Nicolaus Research estimates. Price/Earnings Ratio George A. Price, Jr. (443) 224-1323 gaprice@stifel.com 8/7/2009 Shlomo H. Rosenbaum (443) 224-1322 shrosenbaum@stifel.com Richard M. Eskelsen (443) 224-1366 eskelsenr@stifel.com Maximus, Inc. (MMS) August 7, 2009


Page 11 Important Disclosures and Certifications I, George Price, certify that the views expressed in this research report accurately reflect my personal views about the subject securities or issuers; and I, George Price, certify that no part of my compensation was, is, or will be directly or indirectly related to the specific recommendation or views contained in this research report. I, Shlomo Rosenbaum, certify that the views expressed in this research report accurately reflect my personal views about the subject securities or issuers; and I, Shlomo Rosenbaum, certify that no part of my compensation was, is, or will be directly or indirectly related to the specific recommendation or views contained in this research report. Q3 Q1 Q2 Q3 Q1 Q2 Q3 Q1 Q2 16 24 32 40 48 2007 2008 2009 12/22/06 H:NA 03/13/07 B:$38 05/09/07 B:$43 05/23/07 H:NA Rating and Price Target History for: Maximus, Inc. (MMS) as of 08-06-2009 Created by BlueMatrix Rating Key B - Buy UR - Under Review H - Hold NR - No Rating S - Sell NA - Not Applicable I - Initiation RS - Rating Suspended D - Dropped For a price chart with our ratings and target price changes for MMS go to http://sf.bluematrix.com/bluematrix/Disclosure?ticker=MMS Maximus, Inc. is a client of Stifel, Nicolaus & Company, Inc. or an affiliate or was a client of Stifel Nicolaus or an affiliate within the past 12 months. Maximus, Inc. is provided with non-investment banking, securities related services by Stifel, Nicolaus & Company, Inc. or an affiliate or was provided with non-investment banking, securities related services by Stifel Nicolaus or an affiliate within the past 12 months. Stifel, Nicolaus & Company, Inc. expects to receive or intends to seek compensation for investment banking services from Maximus, Inc. in the next 3 months. Stifel, Nicolaus & Company, Inc. or an affiliate has received compensation for non-investment banking, securities related services from Maximus, Inc. in the past 12 months. Stifel, Nicolaus & Company, Inc.'s research analysts receive compensation that is based upon (among other factors) Stifel Nicolaus' overall investment banking revenues. Our investment rating system is three tiered, defined as follows: BUY -We expect this stock to outperform the S&P 500 by more than 10% over the next 12 months. For higher-yielding equities such as REITs and Utilities, we expect a total return in excess of 12% over the next 12 months. HOLD -We expect this stock to perform within 10% (plus or minus) of the S&P 500 over the next 12 months. A Hold rating is also used for those higher-yielding securities where we are comfortable with the safety of the dividend, but believe that upside in the share price is limited. Maximus, Inc. (MMS) August 7, 2009


Page 12 SELL -We expect this stock to underperform the S&P 500 by more than 10% over the next 12 months and believe the stock could decline in value. Of the securities we rate, 36% are rated Buy, 60% are rated Hold, and 4% are rated Sell. Within the last 12 months, Stifel, Nicolaus & Company, Inc. or an affiliate has provided investment banking services for 6%, 6% and 3% of the companies whose shares are rated Buy, Hold and Sell, respectively. Additional Disclosures STIFEL NICOLAUS ACTED AS FINANCIAL ADVISOR TO MAXIMUS, INC. IN CONNECTION WITH ITS SALE OF ITS CORRECTIONS SERVICES BUSINESS TO PROVIDENCE SERVICE CORPORATION. Please visit the Research Page at www.stifel.com for the current research disclosures applicable to the companies mentioned in this publication that are within Stifel Nicolaus' coverage universe. For a discussion of risks to target price please see our stand-alone company reports and notes for all Buy-rated stocks. The information contained herein has been prepared from sources believed to be reliable but is not guaranteed by us and is not a complete summary or statement of all available data, nor is it considered an offer to buy or sell any securities referred to herein. Opinions expressed are subject to change without notice and do not take into account the particular investment objectives, financial situation or needs of individual investors. Employees of Stifel, Nicolaus & Company, Inc. or its affiliates may, at times, release written or oral commentary, technical analysis or trading strategies that differ from the opinions expressed within. Past performance should not and cannot be viewed as an indicator of future performance. Stifel, Nicolaus & Company, Inc. is a multi-disciplined financial services firm that regularly seeks investment banking assignments and compensation from issuers for services including, but not limited to, acting as an underwriter in an offering or financial advisor in a merger or acquisition, or serving as a placement agent in private transactions. Moreover, Stifel Nicolaus and its affiliates and their respective shareholders, directors, officers and/or employees, may from time to time have long or short positions in such securities or in options or other derivative instruments based thereon. These materials have been approved by Stifel Nicolaus Limited, authorized and regulated by the Financial Services Authority (UK), in connection with its distribution to professional clients and eligible counterparties in the European Economic Area. (Stifel Nicolaus Limited home office: London +44 20 7557 6030.) No investments or services mentioned are available in the European Economic Area to retail clients or to anyone in Canada other than a Designated Institution. This investment research report is classified as objective for the purposes of the FSA rules. Please contact a Stifel Nicolaus entity in your jurisdiction if you require additional information. Additional Information Is Available Upon Request © 2009 Stifel, Nicolaus & Company, Inc. One South Street Baltimore, MD 21202. All rights reserved. Maximus, Inc. (MMS) August 7, 2009