Exhibit 99.1
|
|
Richard Montoni, President & Chief Executive Officer David Walker, Chief Financial Officer & Treasurer November 16, 2006 UBS Global Communications & Technology Conference |
Exhibit 99.1
|
|
Richard Montoni, President & Chief Executive Officer David Walker, Chief Financial Officer & Treasurer November 16, 2006 UBS Global Communications & Technology Conference |
|
|
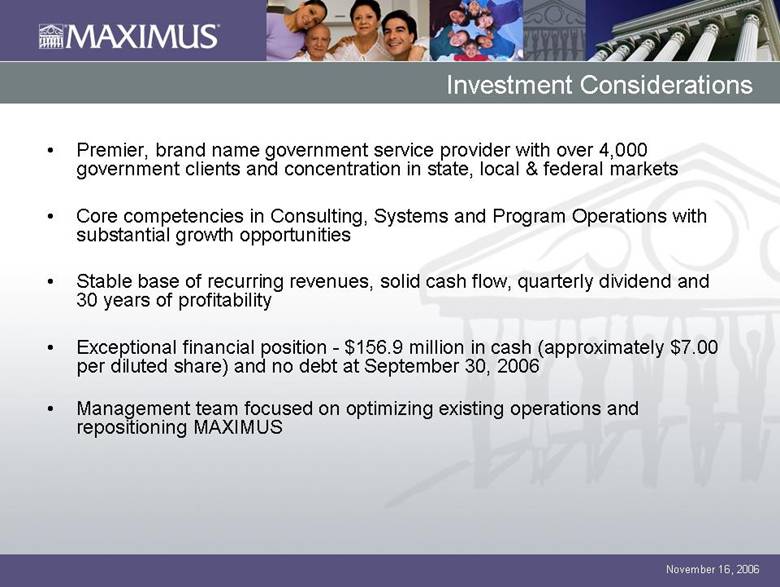
Premier, brand name government service provider with over 4,000 government clients and concentration in state, local & federal markets Core competencies in Consulting, Systems and Program Operations with substantial growth opportunities Stable base of recurring revenues, solid cash flow, quarterly dividend and 30 years of profitability Exceptional financial position - $156.9 million in cash (approximately $7.00 per diluted share) and no debt at September 30, 2006 Management team focused on optimizing existing operations and repositioning MAXIMUS Investment Considerations |
|
|
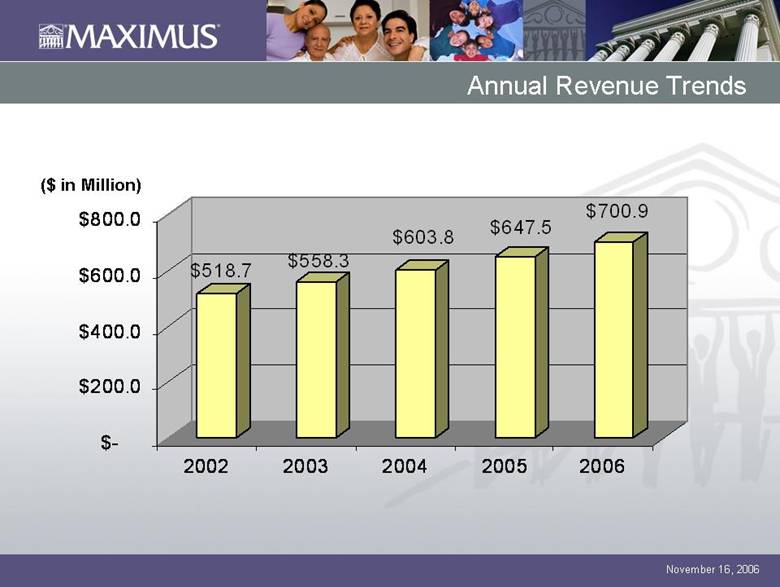
Annual Revenue Trends ($ in Million) $518.7 $558.3 $603.8 $647.5 $700.9 $- $200.0 $400.0 $600.0 $800.0 2002 2003 2004 2005 2006 |
|
|
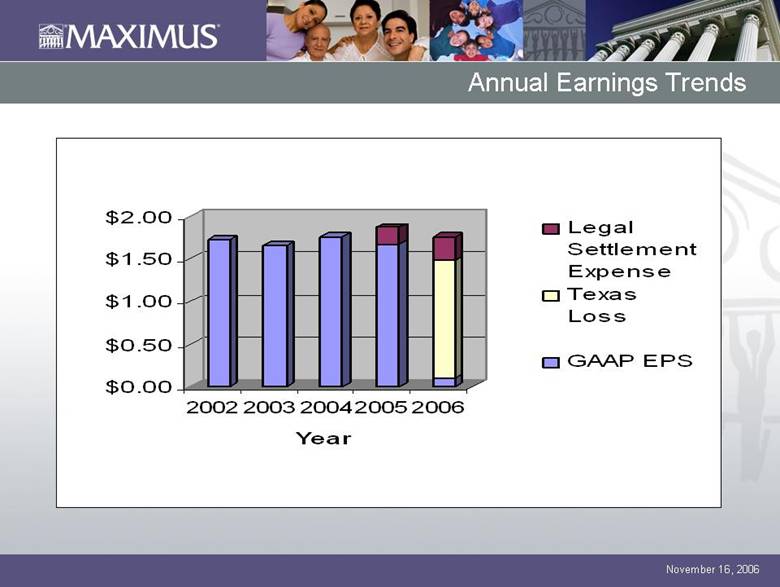
Annual Earnings Trends $0.00$0.50$1.00$1.50$2.0020022003200420052006Year LegalSettlementExpenseTexasLossGAAP EPS |
|
|
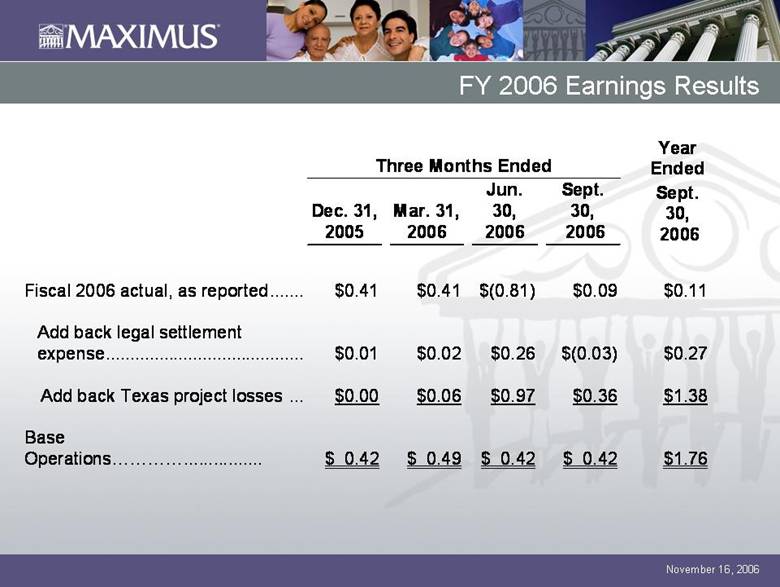
FY 2006 Earnings Results Three Months EndedYear EndedDec. 31, 2005Mar.31, 2006Jun.30, 2006Sept. 30,2006Sept. 30,2006Fiscal 2006 actual, as reported $0.41$0.41$(0.81)$0.09$0.11Add back legal settlementexpense $0.01$0.02$0.26$(0.03)$0.27Add back Texas project losses $0.00$0.06$0.97$0.36$1.38Base Operations $ 0.42$ 0.49$ 0.42$ 0.42$1.76 |
|
|
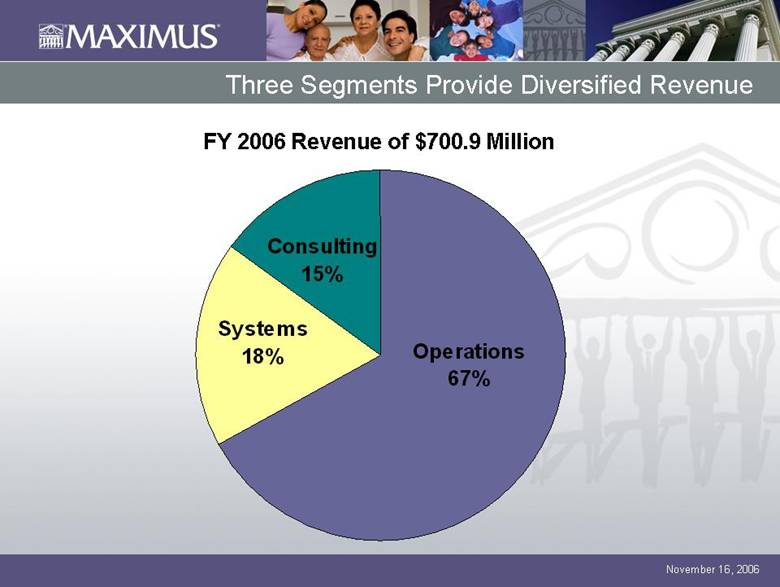
Three Segments Provide Diversified Revenue FY 2006 Revenue of $700.9 Million Operations 67%Consulting 15%Systems 18% |
|
|
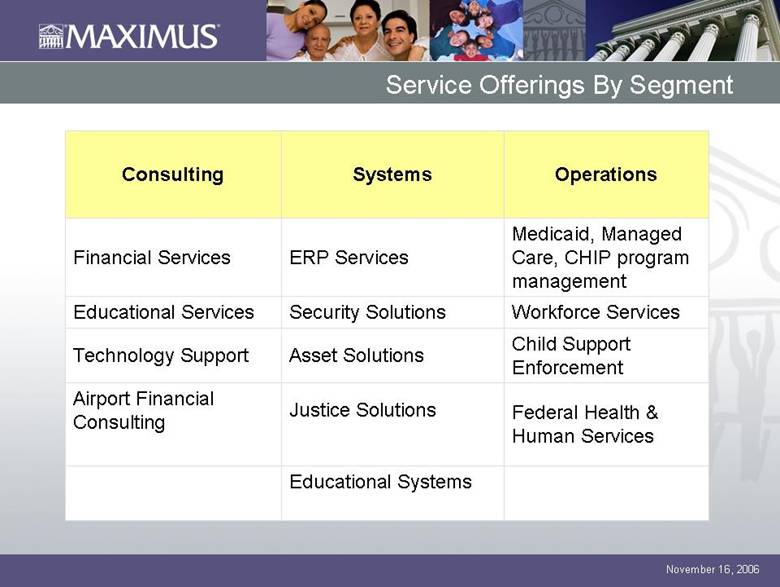
Federal Health & Human Services Justice Solutions Airport Financial Consulting Educational Systems Child Support Enforcement Asset Solutions Technology Support Workforce Services Security Solutions Educational Services Medicaid, Managed Care, CHIP program management ERP Services Financial Services Operations Systems Consulting Service Offerings By Segment |
|
|
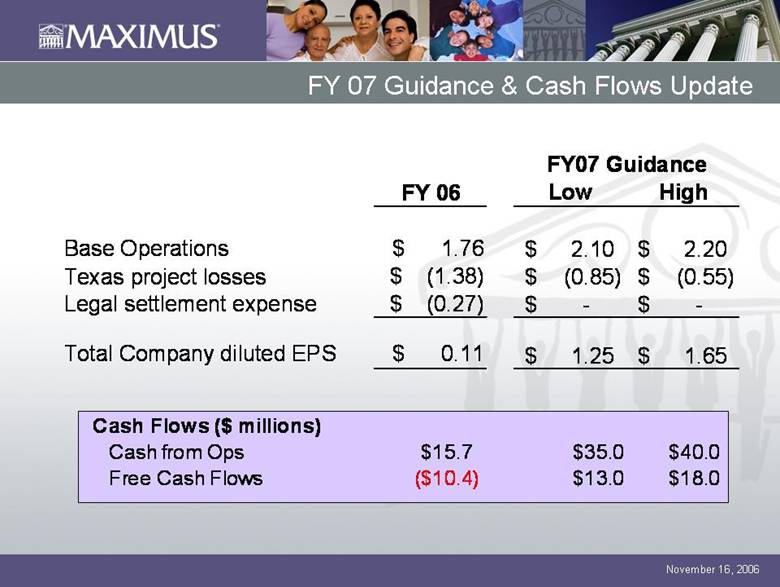
FY 07 Guidance & Cash Flows Update FY 06LowHighBase Operations$ 1.76 $2.10$ 2.20 Texas project losses $ (1.38)$ (0.85)$ (0.55)Legal settlement expense$ (0.27)$ -$ - Total Company diluted EPS$ 0.11 $1.25$ 1.65FY07 GuidanceCash Flows ($ millions)Cash from Ops$15.7$35.0$40.0Free Cash Flows($10.4)$13.0$18.0 |
|
|
Rich Montoni November 16, 2006 UBS Global Communications & Technology Conference |
|
|
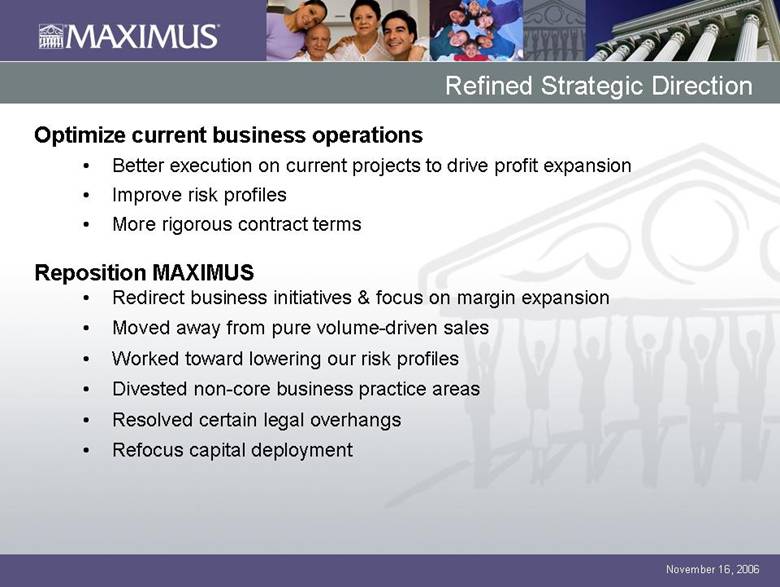
Refined Strategic Direction Optimize current business operations Better execution on current projects to drive profit expansion Improve risk profiles More rigorous contract terms Reposition MAXIMUSRedirect business initiatives & focus on margin expansion Moved away from pure volume-driven sales Worked toward lowering our risk profiles Divested non-core business practice areas Resolved certain legal overhangs Refocus capital deployment |
|
|
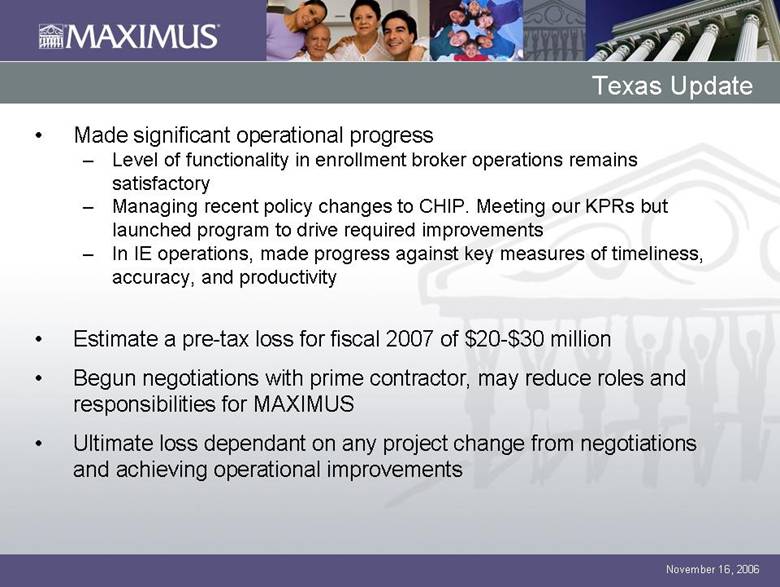
Texas Update Made significant operational progress Level of functionality in enrollment broker operations remains satisfactory Managing recent policy changes to CHIP. Meeting our KPRs but launched program to drive required improvements In IE operations, made progress against key measures of timeliness, accuracy, and productivity Estimate a pre-tax loss for fiscal 2007 of $20-$30 million Begun negotiations with prime contractor, may reduce roles and responsibilities for MAXIMUS Ultimate loss dependant on any project change from negotiations and achieving operational improvements |
|
|
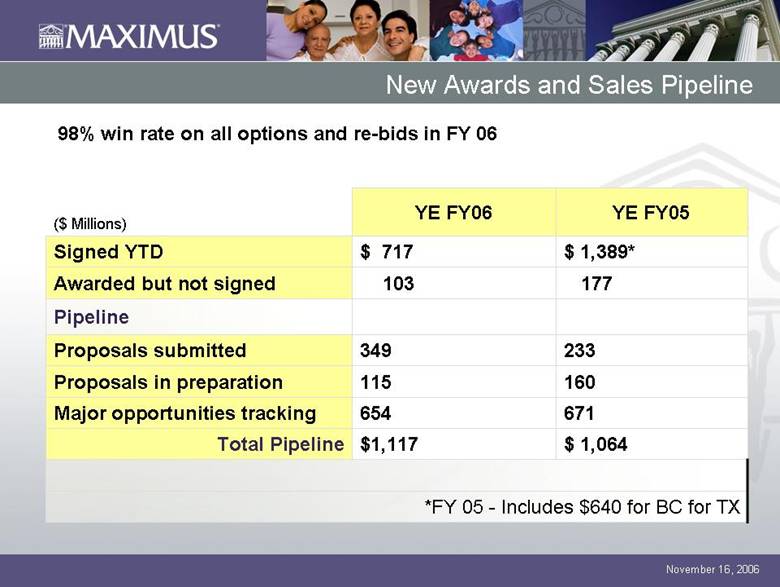
*FY 05 - Includes $640 for BC for TX $ 1,064 $1,117 Total Pipeline 671 654 Major opportunities tracking 160 115 Proposals in preparation 233 349 Proposals submitted Pipeline 177 103 Awarded but not signed $ 1,389* $ 717 Signed YTD YE FY05 YE FY06 ($ Millions) New Awards and Sales Pipeline 98% win rate on all options and re-bids in FY 06 |
|
|
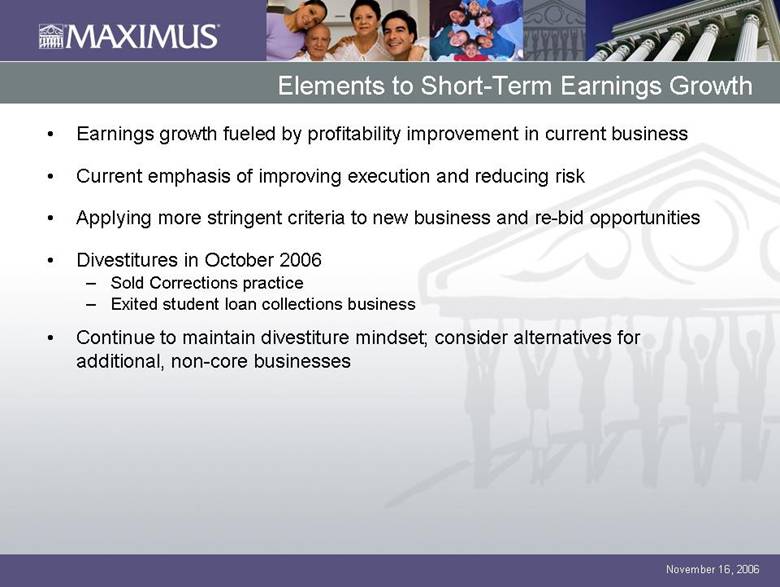
Earnings growth fueled by profitability improvement in current business Current emphasis of improving execution and reducing risk Applying more stringent criteria to new business and re-bid opportunities Divestitures in October 2006 Sold Corrections practice Exited student loan collections business Continue to maintain divestiture mindset; consider alternatives for additional, non-core businesses Elements to Short-Term Earnings Growth |
|
|
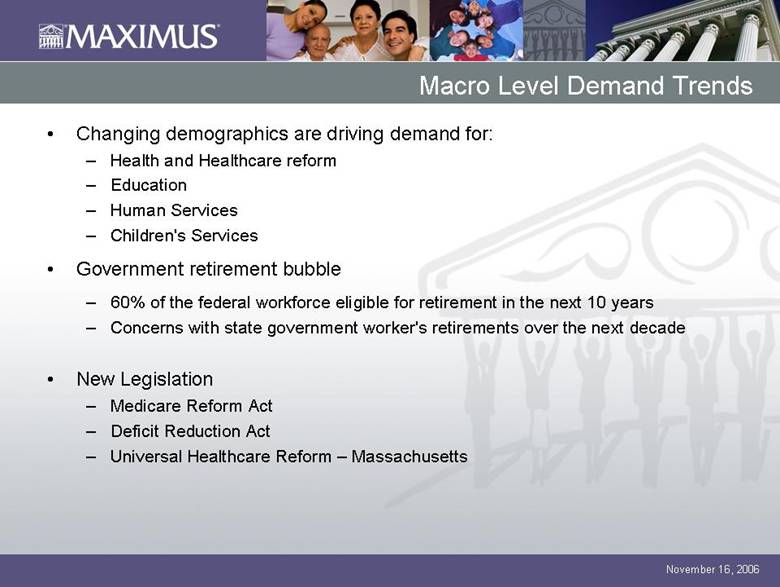
Changing demographics are driving demand for: Health and Healthcare reform Education Human Services Children's Services Government retirement bubble 60% of the federal workforce eligible for retirement in the next 10 years Concerns with state government worker's retirements over the next decade New Legislation Medicare Reform Act Deficit Reduction Act Universal Healthcare Reform – Massachusetts Macro Level Demand Trends |
|
|
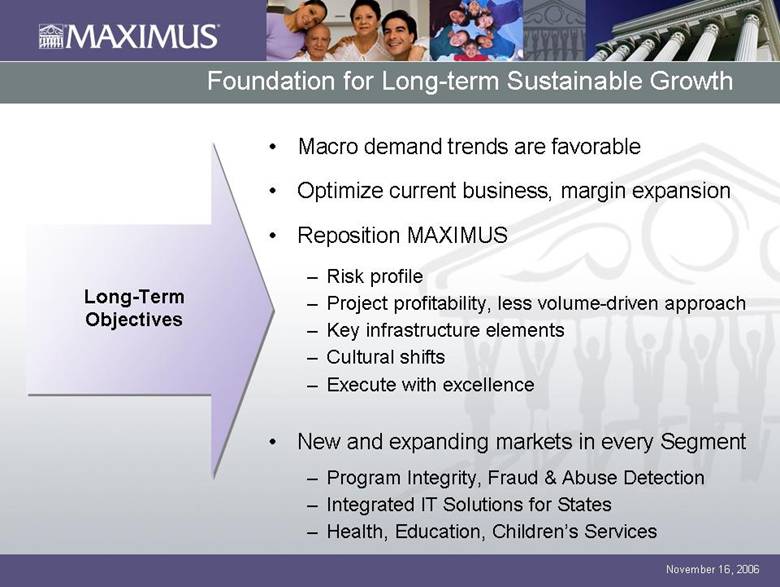
Macro demand trends are favorable Optimize current business, margin expansion Reposition MAXIMUS Risk profile Project profitability, less volume-driven approach Key infrastructure elements Cultural shifts Execute with excellence New and expanding markets in every Segment Program Integrity, Fraud & Abuse Detection Integrated IT Solutions for States Health, Education, Children’s Services Foundation for Long-term Sustainable Growth Long-Term Objectives |
|
|
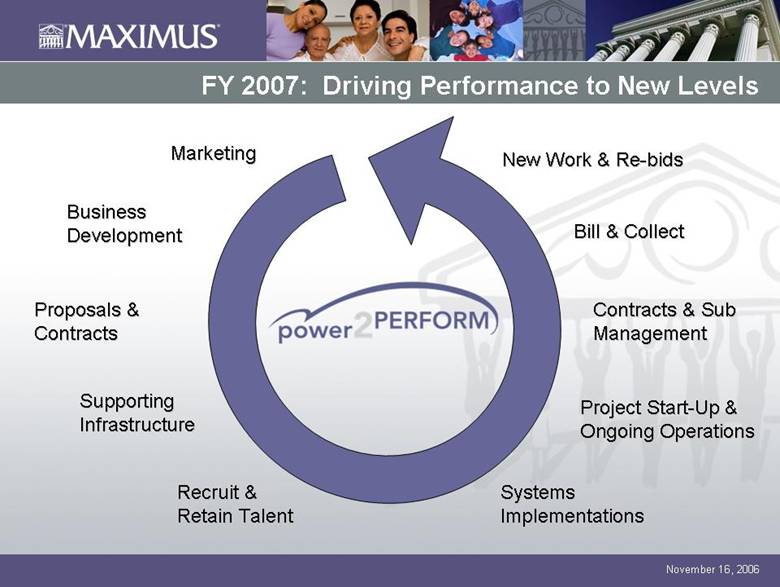
Marketing Supporting Infrastructure Business Development Recruit & Retain Talent Proposals & Contracts Contracts & Sub Management Systems Implementations Project Start-Up & Ongoing Operations New Work & Re-bids Bill & Collect FY 2007: Driving Performance to New Levels |
|
|
November 16, 2006 UBS Global Communications & Technology Conference |