|
Exhibit 99.2
|
David N. Walker Chief Financial Officer and Treasurer 4th Quarter Fiscal 2006 November 15, 2006 MAXIMUS QUARTERLY EARNINGS CALL |

|
Exhibit 99.2
|
David N. Walker Chief Financial Officer and Treasurer 4th Quarter Fiscal 2006 November 15, 2006 MAXIMUS QUARTERLY EARNINGS CALL |
|
|
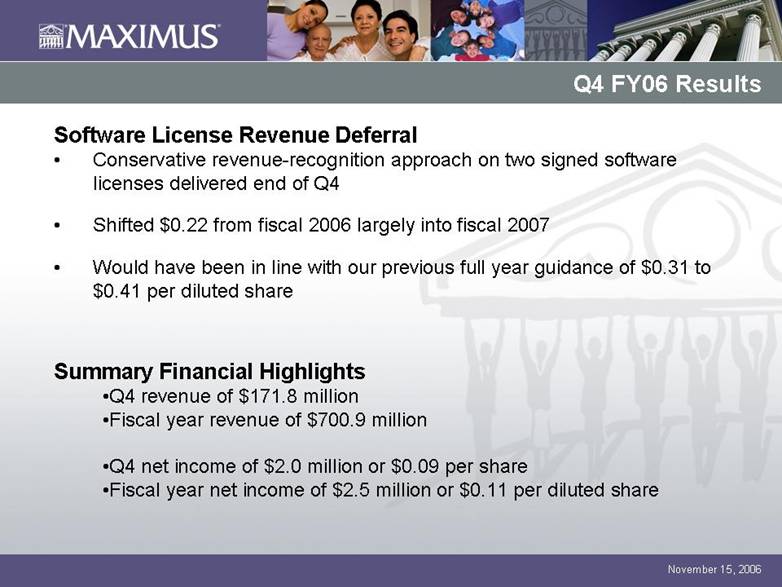
Q4 FY06 Results Software License Revenue Deferral Conservative revenue-recognition approach on two signed software licenses delivered end of Q4 Shifted $0.22 from fiscal 2006 largely into fiscal 2007 Would have been in line with our previous full year guidance of $0.31 to $0.41 per diluted share Summary Financial Highlights Q4 revenue of $171.8 million Fiscal year revenue of $700.9 million Q4 net income of $2.0 million or $0.09 per share Fiscal year net income of $2.5 million or $0.11 per diluted share |
|
|
Base Operations Results Three Months EndedYear EndedDec. 31, 2005Mar.31, 2006Jun.30, 2006Sept. 30,2006Sept. 30,2006Fiscal 2006 actual, as reported $0.41$0.41$(0.81)$0.09$0.11Add back legal settlement expense e$0.01$0.02$0.26$(0.03)$0.27Add back Texas project losses $0.00$0.06$0.97$0.36$1.38Base Operations $ 0.42$ 0.49$ 0.43$ 0.42$1.76 |
|
|
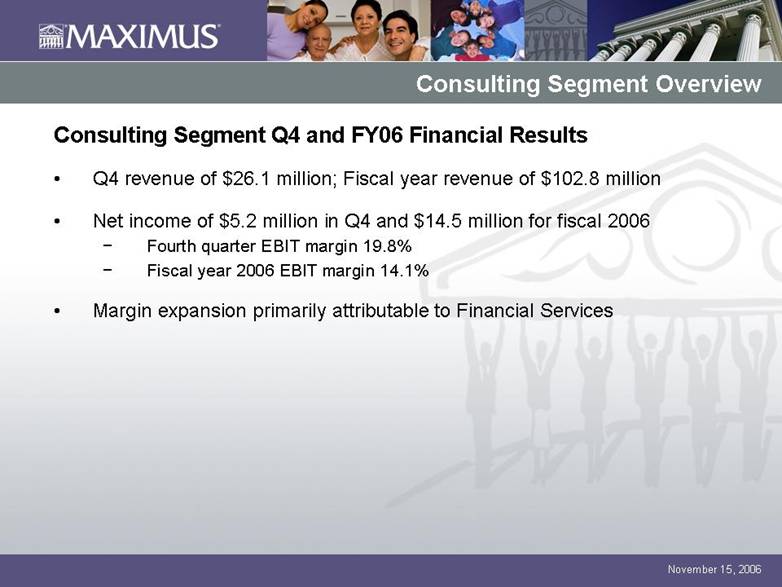
Consulting Segment Overview Consulting Segment Q4 and FY06 Financial Results Q4 revenue of $26.1 million; Fiscal year revenue of $102.8 million Net income of $5.2 million in Q4 and $14.5 million for fiscal 2006 Fourth quarter EBIT margin 19.8% Fiscal year 2006 EBIT margin 14.1% Margin expansion primarily attributable to Financial Services |
|
|
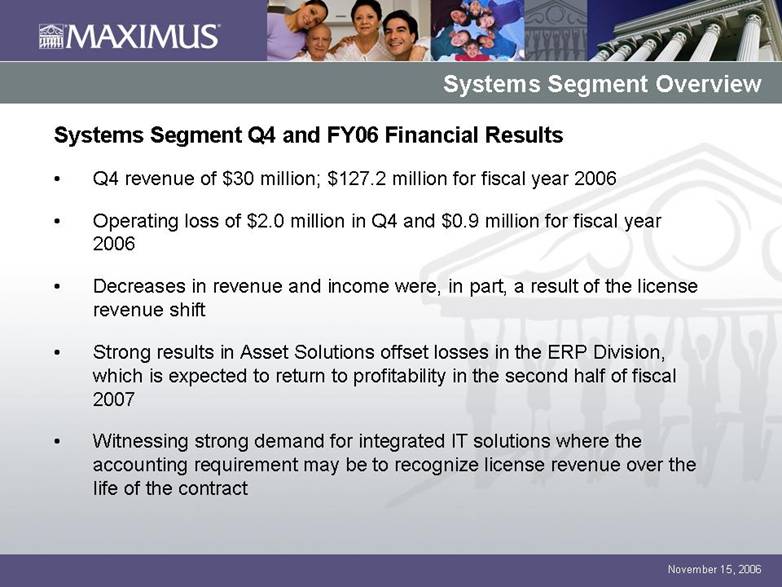
Systems Segment Overview Systems Segment Q4 and FY06 Financial Results Q4 revenue of $30 million; $127.2 million for fiscal year 2006 Operating loss of $2.0 million in Q4 and $0.9 million for fiscal year 2006 Decreases in revenue and income were, in part, a result of the license revenue shift Strong results in Asset Solutions offset losses in the ERP Division, which is expected to return to profitability in the second half of fiscal 2007 Witnessing strong demand for integrated IT solutions where the accounting requirement may be to recognize license revenue over the life of the contract |
|
|
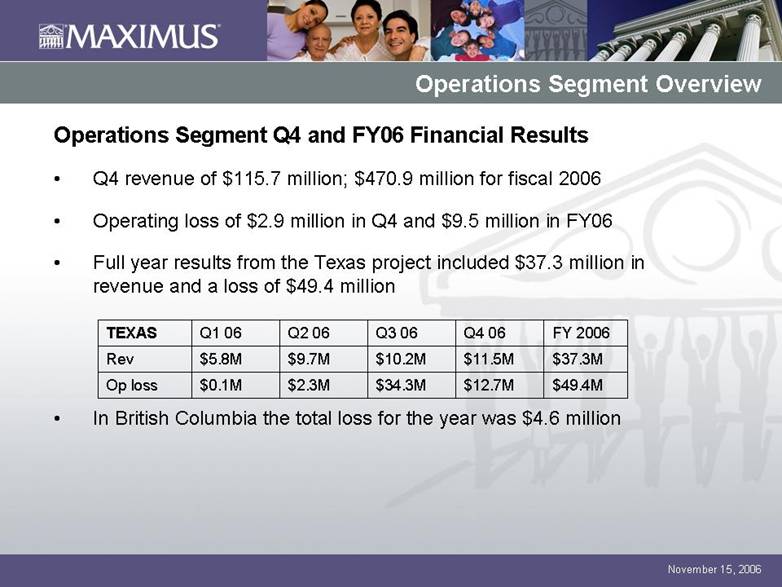
Operations Segment Overview Operations Segment Q4 and FY06 Financial Results Q4 revenue of $115.7 million; $470.9 million for fiscal 2006 Operating loss of $2.9 million in Q4 and $9.5 million in FY06 Full year results from the Texas project included $37.3 million in revenue and a loss of $49.4 million In British Columbia the total loss for the year was $4.6 million $49.4M$12.7M$34.3M$2.3M$0.1MOp loss$37.3M$11.5M$10.2M$9.7M$5.8MRevFY 2006Q4 06Q3 06Q2 06Q1 06TEXAS |
|
|
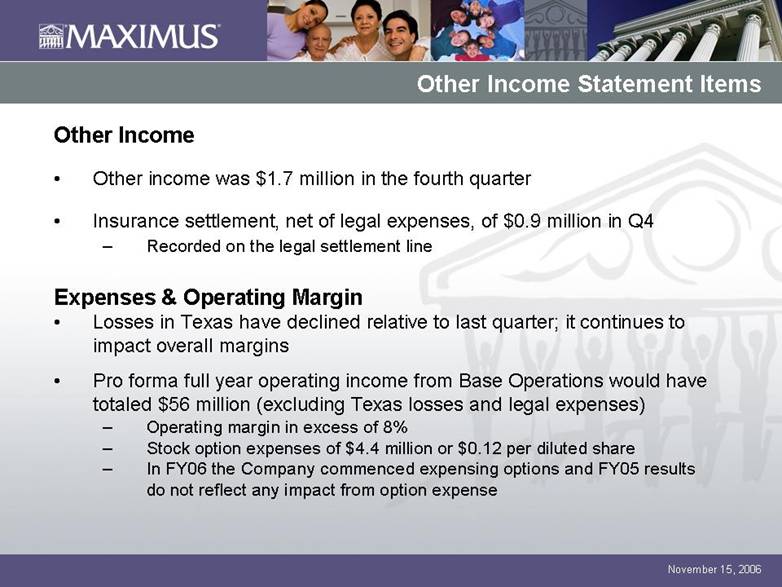
Other Income Statement Items Other Income Other income was $1.7 million in the fourth quarter Insurance settlement, net of legal expenses, of $0.9 million in Q4 Recorded on the legal settlement line Expenses & Operating Margin Losses in Texas have declined relative to last quarter; it continues to impact overall margins Pro forma full year operating income from Base Operations would have totaled $56 million (excluding Texas losses and legal expenses) Operating margin in excess of 8% Stock option expenses of $4.4 million or $0.12 per diluted share In FY06 the Company commenced expensing options and FY05 results do not reflect any impact from option expense |
|
|
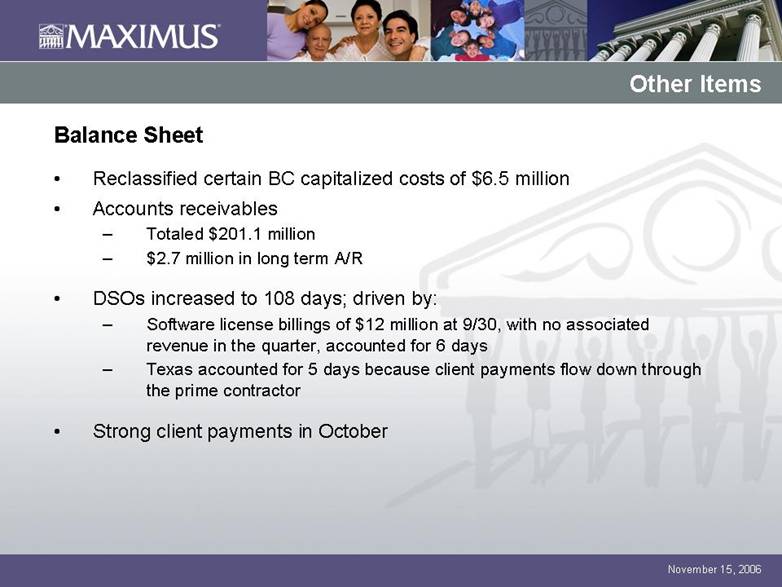
Other Items Balance Sheet Reclassified certain BC capitalized costs of $6.5 million Accounts receivablesTotaled $201.1 million $2.7 million in long term A/R DSOs increased to 108 days; driven by: Software license billings of $12 million at 9/30, with no associated revenue in the quarter, accounted for 6 days Texas accounted for 5 days because client payments flow down through the prime contractor Strong client payments in October |
|
|
Cash and Cash Flow Net cash from operating activities for the full fiscal year totaled $15.7 million Cash used from Operations in the fourth quarter was $4.9 million At 9/30/2006, cash, cash equivalents, and marketable securities totaled $156.9 million |
|
|
Richard A. Montoni President and Chief Executive Officer 4th Quarter Fiscal 2006 November 15, 2006 MAXIMUS QUARTERLY EARNINGS CALL |
|
|
Fiscal 2006 Overview In April, MAXIMUS launched a plan to optimize current business operations Progress to improve internal practices Directed our focus towards profit margin expansion Moved away from pure volume-driven sales Worked toward lowering our risk profiles Divested non-core business practice areas Resolved certain legal overhangs |
|
|
Texas Update Texas project financial results in line with expectations with a total pre-tax loss for fiscal 2006 of $49.4 million Made significant operational progress Level of functionality in enrollment broker operations remains satisfactory Managing recent policy changes to CHIP. Meeting our KPRs but launched program to drive required improvements In IE operations, made progress against key measures of timeliness, accuracy, and productivity Entered into negotiations with prime contractor which could result in a diminished role in certain elements of the program Estimate a pre-tax loss for fiscal 2007 in the range of $20 million to $30 million based upon latest results in planned improvements Ultimate loss dependant on any project change from negotiations and achieving operational improvements |
|
|
Dramatic changes to political landscape with the mid-term election cycle Republicans favor outsourcing, but democrats typically create the programs MAXIMUS administers Today governments have more compelling needs to utilize technology and new processes to serve their constituents Mid-Term Election Cycles |
|
|
Earnings growth fueled by profitability improvement in current business Current emphasis of improving execution and reducing risk Applying more stringent criteria to new business and rebid opportunities Divestitures in October 2006 Sold Corrections practice Shut down student loan collections business Combined operating losses of just over $1 million Free up important management resources Continue to maintain divestiture mindset; consider alternatives for additional, non-core businesses Elements to Short-Term Earnings Growth |
|
|
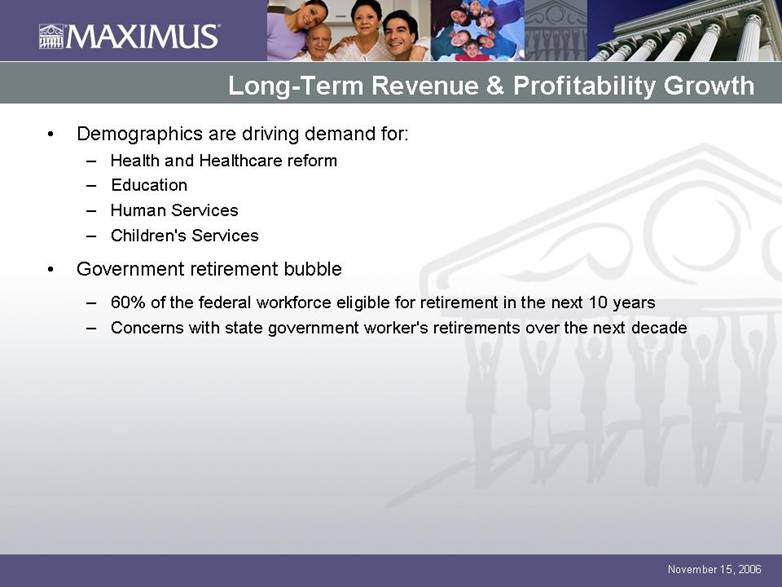
Demographics are driving demand for: Health and Healthcare reform Education Human Services Children's Services Government retirement bubble 60% of the federal workforce eligible for retirement in the next 10 years Concerns with state government worker's retirements over the next decade Long-Term Revenue & Profitability Growth |
|
|
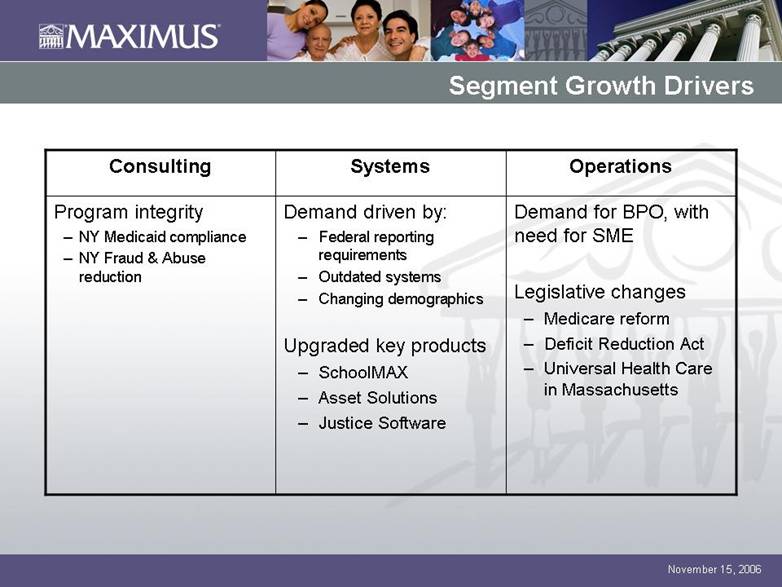
Segment Growth Drivers Program integrity NY Medicaid compliance NY Fraud & Abuse reduction Consulting Demand for BPO, with need for SME Legislative changes Medicare reform Deficit Reduction Act Universal Health Care in Massachusetts Demand driven by: Federal reporting requirements Outdated systems Changing demographics Upgraded key products SchoolMAX Asset Solutions Justice Software Operations Systems |
|
|
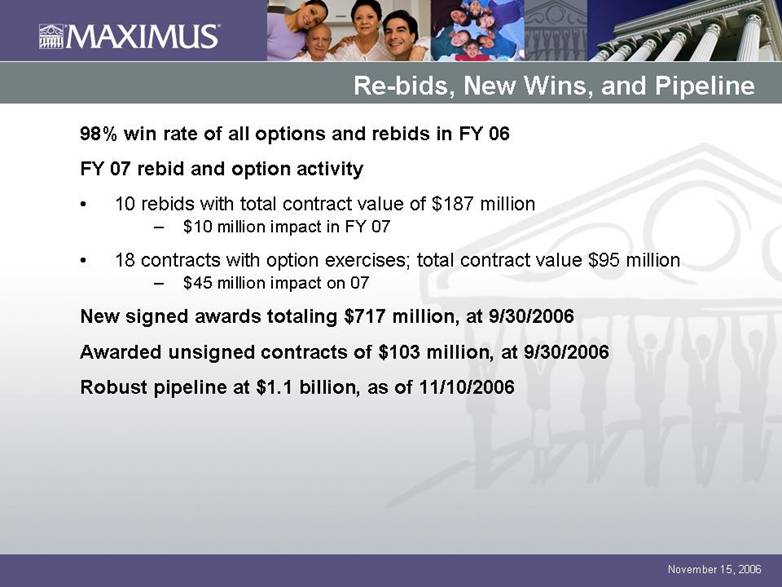
Re-bids, New Wins, and Pipeline 98% win rate of all options and rebids in FY 06 FY 07 rebid and option activity 10 rebids with total contract value of $187 million $10 million impact in FY 07 18 contracts with option exercises; total contract value $95 million $45 million impact on 07 New signed awards totaling $717 million, at 9/30/2006 Awarded unsigned contracts of $103 million, at 9/30/2006 Robust pipeline at $1.1 billion, as of 11/10/2006 |
|
|
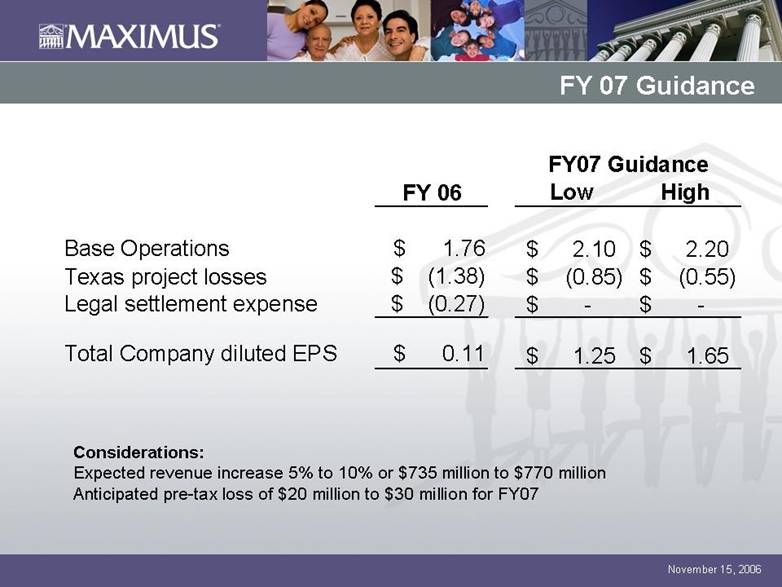
FY 07 Guidance Considerations: Expected revenue increase 5% to 10% or $735 million to $770 million Anticipated pre-tax loss of $20 million to $30 million for FY07 FY 06LowHighBase Operations$ 1.76 2.10$ 2.20$ Texas project losses $ (1.38)(0.85)$ (0.55)$ Legal settlement expense$ (0.27)-$ -$ Total Company diluted EPS$ 0.11 1.25$ 1.65$ FY07 Guidance |
|
|
Fiscal 2007 Outlook Moving forward to improve performance and capitalize on strengths Fuel earnings by better execution on current projects Base operations are posed to deliver much improved results Eliminate legacy overhangs Conclusion |