Use these links to rapidly review the document
TABLE OF CONTENTS
FINANCIAL STATEMENTS
UNITED STATES
SECURITIES AND EXCHANGE COMMISSION
Washington, D.C. 20549
FORM 10-K
ANNUAL REPORT PURSUANT TO SECTION 13 OR 15(d) OF
THE SECURITIES EXCHANGE ACT OF 1934
For the fiscal year ended September 30, 2013
Commission file number: 1-12997
MAXIMUS, INC.
(Exact name of registrant as specified in its charter)
| Virginia (State or other jurisdiction of incorporation or organization) |
54-1000588 (I.R.S. Employer Identification No.) |
|
1891 Metro Center Drive, Reston, Virginia (Address of principal executive offices) |
20190 (Zip Code) |
Registrant's telephone number, including area code: (703) 251-8500
Securities registered pursuant to Section 12(b) of the Act:
| Title of each class | Name of each exchange on which registered | |
|---|---|---|
| Common Stock, no par value | New York Stock Exchange |
Securities registered pursuant to Section 12(g) of the Act: None
Indicate by check mark if the registrant is a well-known seasoned issuer, as defined in Rule 405 of the Securities Act. Yes ý No o
Indicate by check mark if the registrant is not required to file reports pursuant to Section 13 or Section 15(d) of the Act. Yes o No ý
Indicate by check mark whether the registrant (1) has filed all reports required to be filed by Section 13 or 15(d) of the Securities Exchange Act of 1934 during the preceding 12 months (or for such shorter period that the registrant was required to file such reports), and (2) has been subject to such filing requirements for the past 90 days. Yes ý No o
Indicate by check mark whether the registrant has submitted electronically and posted on its corporate Website, if any, every Interactive Data File required to be submitted and posted pursuant to Rule 405 of Regulation S-T (§232.405 of this chapter) during the preceding 12 months (or for such shorter period that the registrant was required to submit and post such files). Yes ý No o
Indicate by check mark if disclosure of delinquent filers pursuant to Item 405 of Regulation S-K is not contained herein, and will not be contained, to the best of registrant's knowledge, in definitive proxy or information statements incorporated by reference in Part III of this Form 10-K or any amendment to this Form 10-K. o
Indicate by check mark whether the registrant is a large accelerated filer, an accelerated filer, or a non-accelerated filer. See definition of "accelerated filer and large accelerated filer" in Rule 12b-2 of the Exchange Act. (Check one):
| Large accelerated filer ý | Accelerated filer o | Non-accelerated filer o (Do not check if a smaller reporting company) |
Smaller reporting company o |
Indicate by check mark whether the registrant is a shell company (as defined in Rule 12b-2 of the Act). Yes o No ý
The aggregate market value of outstanding voting stock held by non-affiliates of the registrant as of March 31, 2013 was $2,639,737,871 based on the last reported sale price of the registrant's Common Stock on The New York Stock Exchange as of the close of business on that day.
There were 68,538,100 shares of the registrant's Common Stock outstanding as of November 1, 2013.
DOCUMENTS INCORPORATED BY REFERENCE
Portions of the registrant's definitive Proxy Statement for its 2014 Annual Meeting of Shareholders to be held on March 19, 2014, which definitive Proxy Statement will be filed with the Securities and Exchange Commission not later than 120 days after the end of the registrant's fiscal year, are incorporated by reference into Part III of this Form 10-K.
MAXIMUS, Inc.
Form 10-K
September 30, 2013
Table of Contents
2
SPECIAL NOTE REGARDING FORWARD LOOKING STATEMENTS
Included in this Annual Report on Form 10-K are forward-looking statements within the meaning of the Private Securities Litigation Reform Act of 1995. These forward-looking statements are based on current expectations, estimates, forecasts and projections about our company, the industry in which we operate and other matters, as well as management's beliefs and assumptions and other statements that are not historical facts. Words such as "anticipate," "believe," "could," "expect," "estimate," "intend," "may," "opportunity," "plan," "potential," "project," "should," "will" and similar expressions are intended to identify forward-looking statements and convey uncertainty of future events or outcomes. These statements are not guarantees and involve risks, uncertainties and assumptions that are difficult to predict. Actual outcomes and results may differ materially from such forward- looking statements due to a number of factors, including without limitation:
As a result of these and other factors, our past financial performance should not be relied on as an indication of future performance. Additionally, we caution investors not to place undue reliance on any forward-looking statements as these statements speak only as of the date when made. Except as otherwise required by law, we undertake no obligation to publicly update or revise any forward-looking statements, whether resulting from new information, future events or otherwise.
3
Throughout this annual report, the terms "MAXIMUS," "Company," "we," "our" and "us" refer to MAXIMUS, Inc. and its subsidiaries. A list of key terms is included in a glossary at the end of this section.
General
We provide business process services ("BPS") to government health and human services agencies under our mission of Helping Government Serve the People.® We are one of the largest pure-play health and human services administrative providers to governments in the United States, Australia, Canada, the United Kingdom and Saudi Arabia. We use our expertise, experience and advanced technological solutions to help government agencies run efficient, cost-effective programs and to improve program accountability and outcomes, while enhancing the quality of services provided to program beneficiaries.
Over the course of the past five years, our revenue and earnings have grown primarily as a result of economic, demographic and legislative trends, which are driving demand for services from providers, such as MAXIMUS, who can provide efficient, cost-effective solutions to problems, such as:
With our proven track record and expertise, we are in a superior position to provide these services. We believe that we can bring the right combination of people, business process and technology to deliver the best value solution to governments. This has allowed us to gain market share in an area that has significant barriers to entry. As a result, we are:
We pursue selective acquisitions to enhance and expand our offerings or geographic presence. In 2013, we acquired Health Management Limited, the leading provider of independent medical assessments in the United Kingdom; in 2012, we acquired Policy Studies, Inc., a provider of health and human services operations in the United States; and in 2010, we acquired DeltaWare Services, Inc., a provider of software in Canada.
Much of our revenues are derived from long-term contractual arrangements with governments. Base contracts are typically three to five years and often have additional option periods, which provide good visibility in terms of predicting revenues. Most of our contracts are related to programs that are long-term in nature, such as Medicaid and Medicare. Our client relationships are frequently decades long.
4
Our business segments
Our reportable segments are Health Services and Human Services. For more information concerning our segment presentation, including comparative revenue, gross profit, operating profit, identifiable assets and related financial information for the 2013, 2012 and 2011 fiscal years, see "Note 2. Business segments" within Item 8 of this Form 10-K, which we incorporate by reference here.
Health Services Segment
Our Health Services Segment generated 65% of our total revenue in fiscal year 2013. This segment provides a variety of business process services, as well as related consulting services, for state, provincial and federal government programs, including Medicaid, CHIP, SNAP (Supplemental Nutrition Assistance Program), Medicare, the Affordable Care Act and Health Insurance BC (British Columbia). The segment's services help improve the efficiency, cost effectiveness, quality and accountability of government-sponsored health benefit programs. In this segment, our BPS and consulting services can be described as follows:
Historically, the Health Services business has not been subject to significant effects from seasonality; however it experiences revenue and margin fluctuations due to transaction-based work, such as periodic program open enrollment and activity related to contract life cycles. During the first quarter of our fiscal year, reductions in working days due to holidays and vacations may impact our sales and accounts receivable, but the effect is generally not significant. In the future, the segment may experience more seasonality related to ACA which provides for a six month open enrollment in the first year and a three month open enrollment in subsequent years.
Human Services Segment
Our Human Services Segment generated 35% of our total revenue in fiscal year 2013. This segment provides federal, national, state and county human services agencies with a variety of business process services, as well as related consulting services for welfare-to-work, child support, higher education and K-12 special education programs. Our services can be described as follows:
5
transition from government assistance programs to sustainable employment and economic independence;
The Human Services Segment may experience some seasonality due to holidays and vacations. In addition, the segment typically derives revenue and associated higher margins from our tax credit business in the second half of the year, principally in the fourth quarter.
Geographic Information
We operate in the United States, Australia, Canada, the United Kingdom and Saudi Arabia. The distribution of revenues and assets among the United States, Australia and the rest of the world are included in "Note 2. Business Segments" within Item 8 of this Form 10-K.
Market overview
We expect that demand for our core health and human services offerings will continue to increase over the next few years, driven by new legislation, austerity measures and increasing caseloads, as governments strive to deliver more services with fewer resources. Legislation, such as the Affordable Care Act (ACA) in the United States as well as other health and welfare reform initiatives abroad, has created increased demand for our services, a trend we expect to continue over the next several years. We believe that we remain well-positioned to benefit from this increasing demand as governments look for ways to improve overall program efficiency and achieve value for funds spent on social benefits programs.
Demand for our services is contingent upon factors that affect governments, including:
As a result, governments utilize BPS companies, such as MAXIMUS, to help them deliver innovative, efficient and cost-effective services to beneficiaries on their behalf. We possess the knowledge and resources to operate government health and human programs efficiently, while maintaining the service levels demanded by our government clients. With the ability to tightly balance resources with demand, we also offer the flexibility and scalability that governments do not always possess.
6
Health Services Market Environment
Over the past decade, health care costs have risen substantially in the United States, a trend that is expected to continue. U.S. health care spending, among the highest of all industrialized countries, is increasing at a rate that outpaces inflation and national income growth. Stemming these costs, as well as improving quality and access to health care, is a major policy priority for governments.
In recent years, state fiscal realities have prompted states to reexamine their Medicaid programs. Many states have made program changes, most notably through benefit changes and the expansion of managed care to new populations—including the aged, blind and disabled (ABD) populations—that have historically been served through fee-for-service Medicaid. Although ABD populations represent only a quarter of the total Medicaid population, they are responsible for approximately 70% of the costs. We have seen growth in our current programs from Medicaid managed care expansion. We believe that we remain well-positioned to benefit from future Medicaid managed care expansion due to our role as the administrative enrollment vendor for 19 Medicaid managed care programs.
In March 2010, Congress passed ACA, a comprehensive overhaul of the U.S. health insurance system that initially seeks to expand access to health care, while ultimately improving quality and reducing overall delivery costs. Most notably, ACA aims to expand health insurance coverage to more than 30 million Americans through Medicaid expansion and subsidized insurance coverage purchased through health insurance exchanges. In June 2012, the U.S. Supreme Court ruled that Medicaid expansion under ACA was optional for states. Nevertheless, the Congressional Budget Office estimates that most states will expand Medicaid coverage over the next several years. The ACA also extends CHIP through 2019, provides increased matching federal funds, and guarantees funding through 2015. We currently serve as the administrative vendor for CHIP in nine states.
The law also promotes the integration of new health insurance exchanges with existing state Medicaid and CHIP programs to provide a "no wrong door" entry for program beneficiaries. A health insurance exchange is designed to be an insurance marketplace where individuals and small businesses can shop, compare and buy affordable and qualified health benefit plans. Under the ACA, states were able to determine how they wanted to create their health insurance exchanges by either relying upon the federal exchange or creating their own exchange. In 2013, approximately 35 states opted to use the federal exchange and the remaining states, plus the District of Columbia, chose to operate their own state-based exchanges. States currently on the federal exchange may transition to their own state-based exchanges in the future. Many of the core functions of a health insurance marketplace are similar to Medicaid and CHIP, including consumer outreach and education, eligibility and enrollment, customer contact centers, web portals, and comprehensive business process managed services to help beneficiaries navigate the new exchanges and enroll in health insurance plans. As a result, we are operating customer contact centers for the District of Columbia, five state-based exchanges and two customer contact centers as a subcontractor for the federal exchange.
ACA also includes enhanced consumer protections for health insurance appeals. The law requires an independent, evidence-based external review process and the option for individuals to appeal coverage determinations or claims to insurance companies. This expands the requirement to states that do not have an existing compliant external review process and non-governmental, self-insured plans which previously were not required to have an objective independent health appeals process. We are one of the largest providers of evidence-based health insurance appeals to Medicare and more than 30 state agencies.
We believe the current health environment positions us to benefit from continued demand under the ACA. Overall, we expect the underlying demand for our services to increase over the next several years as states consider transitioning from the federal exchange to their own state-based exchanges and as additional states contemplate Medicaid expansion. In September 2013, the Centers for Medicaid and Medicare awarded MAXIMUS a contract to provide the overall management of the eligibility appeals
7
process for the federal exchange. This one year, $43.2 million contract has four one-year option periods that would bring the total contract value to $383.2 million if all option periods and optional tasks are exercised.
Human Services Market Environment
The Human Services market has experienced increased demand driven by the need for governments to reduce costs and improve efficiency of social benefits programs. The most dynamic portion of the market is in the welfare-to-work arena where governments worldwide are seeking to reform their programs as an important component of comprehensive fiscal austerity measures. Certain governments are modeling new welfare reforms after established programs in Australia and the United States. Variations of these models, with which we have a substantial amount of experience, knowledge and expertise, are being emulated around the world through privatized efforts, with MAXIMUS being a leading provider.
We believe we are well-positioned to compete for these global welfare-to-work opportunities because of our established presence, strong brand recognition, and ability to achieve the requisite performance requirements and outcomes outlined in the new reform measures. We offer clients demonstrated results and more than 20 years of proven experience in administering welfare-to-work programs in several states and countries.
Since 1997, we have provided comprehensive welfare-to-work case management services throughout the United States. In Australia, we are one of the largest and highest rated welfare-to-work providers where we operate more than 80 sites and 65 outreach locations. We also have an established presence in the United Kingdom's welfare-to-work market and presently provide employment and job training services under the country's ambitious reform effort called the Work Programme. This program is a key component of the coalition government's austerity plan to rein in costly benefits programs and reduce mounting debt. The Work Programme consolidates many of the U.K.'s disparate welfare-to-work programs into a single, back-to-work effort. In fiscal 2012, we expanded our geographic reach in the welfare-to-work market with new programs in Canada and Saudi Arabia.
In addition to welfare reform, we have seen an increase in initiatives to use private firms for children's services, such as family maintenance and child support. We currently provide services to the Family Maintenance Enforcement Program in British Columbia as well as several jurisdictions throughout the United States, including Shelby County, Tennessee and Baltimore, Maryland, two of the largest child support privatization efforts in the nation.
We believe ongoing reform initiatives, as well as measures to reduce costs and improve efficiencies, combined with our outstanding performance, expertise and proven solutions will continue to drive demand for our core human services business across multiple geographies.
Our growth strategy
Our goal is to enable future growth by remaining a leading provider of operations program management and consulting services to government agencies. The key components of our business growth strategy include the following:
Pursue new domestic and international business opportunities and expand our customer base. With more than 35 years of business expertise in the government market, we continue to be a leader in developing innovative solutions to meet the evolving needs of government agencies. We seek to grow our domestic and international businesses by leveraging our existing core capabilities, consistently delivering the required outcomes for governments to achieve program goals, and pursuing opportunities with new and current clients.
8
Grow long-term, recurring revenue streams. We seek to enter into long-term relationships with clients to meet their ongoing objectives. As a result, long-term contracts (three to five years with additional option years) are often the preferred method of delivery for customers and are also beneficial to us. We believe an incumbent has a considerable advantage in recompetes and that customer relationships can last decades.
Pursue strategic acquisitions. We will selectively identify and pursue strategic acquisitions. Acquisitions can provide us with a rapid, cost-effective method to enhance our services, obtain additional skill sets, expand our customer base, cross-sell additional services, enhance our technical capabilities, and establish or expand our geographic presence.
Continue to optimize our current operations to drive innovation and quality to customers. We continue to seek efficiencies and optimize operations in order to achieve sustainable, profitable growth. We will continue to deliver quality business process services to clients to improve cost effectiveness, program efficiency and overall program scalability as governments deal with rising demand and increasing caseloads.
Recruit and retain highly skilled professionals. We continually strive to recruit motivated individuals, including top managers from larger organizations, former government officials, consultants experienced in our service areas and recent college graduates with degrees aligned with our mission, such as degrees in government policy and administration. We believe we can continue to attract and retain experienced and educated personnel by capitalizing on our focused market approach and our reputation as a premier government services provider.
Focus on core health and human services business lines. We have centered our core business offerings on delivering business process managed services to government health and human services agencies. Our market focus and established presence positions us to benefit from health care reform in the United States and welfare reform initiatives abroad.
See Exhibit 99.1 of this Annual Report on Form 10-K under the caption "Special Considerations and Risk Factors" for information on risks and uncertainties that could affect our business growth strategy.
Competitive advantages
We offer a private sector alternative for the operation and management of critical government-funded health and human services programs. Our reputation and extensive experience over the last 38 years give us a competitive advantage as governments value the level of expertise, proven delivery and brand recognition that we bring our customers. The following are the competitive advantages that allow us to capitalize on various market opportunities:
Proven track record, ability to deliver outcomes and exceptional brand recognition. Since 1975, we have successfully assisted governments in delivering cost-effective services to beneficiaries of government programs. We operate large-scale program management operations on behalf of government agencies, improving the quality of services provided to beneficiaries, and achieving the necessary outcomes to help these governments cost-effectively meet their program goals. This has further enhanced our brand recognition as a proven partner with government agencies.
Subject matter expertise. Our workforce includes many individuals who possess substantial subject matter expertise in areas critical to the successful design, implementation, administration and operation of government health and human services programs. Many of our employees have worked for governments in management positions and can offer insights into how we can best provide valuable, practical and effective services to our clients.
9
Intellectual property that supports the administration of government programs. We have proprietary solutions to address client requirements in our market that are configurable or provide a platform that can be transferred to meet contractual needs. We also leverage commercial off-the-shelf platforms across multiple contracts in which we have considerable expertise to ensure we can deploy repeatable proven solutions. The Company also leverages software development methodology to shorten software development cycles. Extensive use of shared infrastructure and standard solutions provides considerable price and quality advantages. Management believes our extensive industry focus and expertise embedded in our systems and process provide us with a competitive advantage.
Flexibility and Scalability. We are experienced in launching large scale operations under compressed time frames. We offer clients the flexibility and scalability to deliver the people, processes and technology to complete short- and long-term contractual assignments in the most efficient and cost-effective manner.
Financial strength. We maintain a strong balance sheet, generate consistent annual cash flow, and have minimal long-term debt. We possess the financial strength to ensure clients can confidently trust MAXIMUS to safely operate their high-profile public health and human services programs.
Focused portfolio of services. We are one of the largest publicly traded companies that provide a portfolio of BPS health and human services specifically to government customers. Our government program expertise and proven ability to deliver defined, measurable outcomes differentiate us from other firms and non-profit organizations with limited resources and skill sets, as well as from large consulting firms that serve multiple industries and lack the focus necessary to manage the complexities of serving health and human services government agencies efficiently.
Established international presence. International governments are seeking to improve government-sponsored health and human services programs and contain costs. We have an established presence in Australia, Canada, the United Kingdom and Saudi Arabia. Our international efforts are focused on delivering cost effective welfare-to-work and health insurance eligibility and enrollment services to beneficiaries on behalf of governments.
Expertise in competitive bidding. Government agencies typically award contracts through a comprehensive, complex and competitive requests for proposals (RFPs) and bidding process. Although the bidding criteria varies from contract to contract, we believe that typical contracts are awarded based upon a mix of technical solution and price. In some cases, governments award points for past performance tied to program outcomes. With more than 35 years of experience in responding to RFPs, we have the necessary experience and resources to navigate government procurement processes. We possess the expertise and experience to assess and allocate the appropriate resources necessary for successful project completion in accordance with contractual terms.
Our clients
Our primary customers are government agencies, with the majority at the federal, provincial and state level and, to a lesser extent, some at the county and municipal level. In the United States, even when our direct customers are state governments, a significant amount of our revenue is ultimately provided by the United States Federal Government in the form of cost sharing arrangements with the states, such as is the case with Medicaid. In the year ended September 30, 2013, approximately 56% of our total revenue was derived from state government agencies whose programs received significant federal funding, 24% from foreign government agencies, 12% from U.S. federal government agencies, and 8% from other sources including local municipalities and commercial customers. We were not significantly affected by the recent shut-down of the United States Federal Government in October 2013. The nature of our programs is such that they are typically deemed essential, which means that a short-term shut-down would not be expected to cause significant disruption to our operations. However,
10
an extended delay may affect certain government programs that rely upon federal funding and may also have an effect on our cash flows from operations if payments are delayed.
For the year ended September 30, 2013, we derived approximately 14% of our consolidated revenue from contracts with the State of Texas, 12% of our consolidated revenue from the United States Federal Government and 12% of our consolidated revenue from the Commonwealth of Australia. Revenue from Texas and the United States Federal Government was principally in our Health Services Segment; revenue from Australia was exclusively within our Human Services Segment.
We typically contract with government clients under four primary contract types: performance based, fixed-price, cost-plus, and time and materials. For the year ended September 30, 2013, 48% of our contracts were performance based, 29% were fixed-price, 20% were cost plus and 3% were time and materials.
Generally, the relationships with our clients are long-term, multi-year contracts, subject to option years and periodic rebids. See the "Backlog" section below for more details.
Competition
The market for providing our services to government agencies is competitive and subject to rapid change. However, given the specialized nature of our services and the programs we serve, market entry can be difficult for new or inexperienced firms. The complex nature of competitive bidding and required investment in subject-matter expertise, repeatable processes and support infrastructure creates barriers to entry for potential new competitors unfamiliar with the nature of government procurement.
Our primary competitors in the Health Services Segment market in the United States are Affiliated Computer Services, a Xerox Company; Electronic Data Systems, an HP Company; and specialized private service providers. Our primary competitors in the Human Services Segment market include Serco, Atos Origin, other specialized consulting companies and non-profit organizations.
Legislative initiatives
We actively monitor legislative initiatives and respond to opportunities as they develop. Over the past several years, legislative initiatives created new growth opportunities and potential markets for us. Legislation passed in all the geographies in which we operate has significant public policy implications for all levels of government and presents viable business opportunities in the health and human services arena. We are well-positioned to meet the operations program management and consulting needs resulting from that legislation and subsequent regulatory and program implementation efforts.
Some recent legislative initiatives that have created new growth opportunities for us in the government market include the following:
ACA. In March 2010, the United States enacted comprehensive health care reform, known as the Affordable Care Act (ACA). This law is designed to expand access to health coverage to more than 30 million Americans, protects consumer rights, control health care costs, and improves the overall health care delivery system over the course of the next four years and beyond. On June 28, 2012, the Supreme Court of the United States upheld ACA while allowing states to opt out of the previously mandated Medicaid expansion. The law presents several business opportunities for us to offer our expertise in the administration of public programs, including:
11
insurance exchanges offer new avenues to enrollment; states may also see an increase in participation rates among Medicaid-eligible individuals;
Numerous legislative attempts to repeal the ACA have failed thus preserving ACA and the related business opportunities. In addition, the President has repeatedly stated that he would veto such legislation. As a continued sign of support, the administration transferred monies from other programs to support the implementation of the ACA. Further, the federal exchange was designed to be a temporary function thereby providing additional time for the implementation of state based insurance exchanges. Additional monies may become available to promote state based insurance exchanges.
Shift to Medicaid Managed Care. As Medicaid programs become larger, more complex and costly, states look to new models. Estimates from the Centers for Medicare and Medicaid Services (CMS) indicate that although the fee-for-service system covers less than half of the total Medicaid population, it accounts for more than 80% of all Medicaid spending. In response, several states have initiatives to reduce the current costs of Medicaid by moving different populations of beneficiaries from fixed-fee-for-service models to managed care, which represents new growth opportunities for us.
CHIPRA. CHIPRA was signed into law on February 2, 2009, extending the previous SCHIP program. As part of the ACA, CHIP has been extended through 2019 and funding has been extended through 2015, which is two additional years beyond the original CHIPRA Act. By expanding state options to find and enroll eligible children through "express lane eligibility" and "auto enrollment," CHIPRA has presented us with an opportunity to expand our partnerships with states for the administration of CHIP programs. The advent of state and federal exchanges at the beginning of 2014 will increase participation of eligible children in CHIP.
Work Programme in the United Kingdom. The Work Programme, part of the Coalition government's debt reduction measures, is a government-sponsored welfare-to-work model that consolidates several existing employment programs into a single comprehensive back-to-work program in an effort to achieve higher quality, longer-term and sustainable employment outcomes for job seekers in the United Kingdom. The Work Programme presented new opportunities for MAXIMUS and we have been delivering employment services throughout Thames Valley, Hampshire and the Isle of Wight and West London since June 2011.
12
Employment Program of British Columbia. In 2009, the Province of British Columbia (BC) and the Government of Canada signed a Labour Market Development Agreement that delegates responsibility for delivery of employment and training programs from the federal to the provincial level. In response, the new Employment Program of BC was created to provide all British Columbians eligible for work a single point of entry to employment and labor market services. This program represents a shift in policy to a consolidation and integration of programs into a "one-stop" and "employment first" model with required contracted services that are responsive, inclusive, accessible and client-centered. This program presented an opportunity for us to expand its workforce services offerings to new jurisdictions.
Backlog
At September 30, 2013, we estimate that we had approximately $3.4 billion of revenue in backlog. Backlog represents an estimate of the remaining future revenue from existing signed contracts and revenue from contracts that have been awarded, but not yet signed. Our backlog estimate includes revenue expected under the current terms of executed contracts and revenue from contracts in which the scope and duration of the services required are not definite but estimable (such as performance-based contracts). Our backlog estimate does not assume any contract renewals.
Increases in backlog result from the awarding of new contracts or the extension or renewal of existing contracts and option periods. Reductions come from fulfilling contracts and early termination of contracts. Increases and decreases can follow from changes in management's estimates, particularly for performance-related contracts.
Our contracts typically contain provisions permitting government customers to terminate the contract on short notice, with or without cause. The backlog associated with our performance-based contracts is an estimate based upon management's experience of case loads and similar transaction volume from which actual results may vary.
We believe that period-to-period backlog comparisons are difficult and may not necessarily accurately reflect future revenue we may receive. The actual timing of revenue receipts, if any, on projects included in backlog could change for any of the aforementioned reasons. The dollar amount by segment of our backlog as of September 30, 2013 and 2012 was as follows:
| |
As of September 30, |
||||||
|---|---|---|---|---|---|---|---|
| |
2013 | 2012 | |||||
| |
(In millions) |
||||||
Health Services |
$ | 2,379 | 1,412 | ||||
Human Services |
1,021 | 1,488 | |||||
Total |
$ | 3,400 | 2,900 | ||||
Our BPS businesses typically involve contracts covering a number of years. Once contracts are signed, they typically take three to six months to begin generating revenue. At September 30, 2013, the average weighted life of these contracts was in excess of 5.5 years, including options. Although the exercise of options is uncertain, we believe the incumbent contractor enjoys significant advantages. The longevity of these contracts assists management in predicting revenues, operating income and cash flows. We expect approximately 43% of the backlog balance to be realized as revenue in fiscal 2014 and, with the inclusion of anticipated option period renewals, to represent approximately 95% of current estimated 2014 revenues.
Employees
As of September 30, 2013, we had approximately 12,000 employees, consisting of 9,000 employees in the Health Services Segment, 2,800 employees in the Human Services Segment and 200 corporate
13
administrative employees. Our success depends in large part on attracting, retaining and motivating talented, innovative, experienced and educated professionals at all levels.
As of September 30, 2013, 450 of our employees in Canada were covered under three different collective bargaining agreements, each of which has different components and requirements. There are 438 employees covered by two collective bargaining agreements with the British Columbia Government and Services Employees' Union and 12 employees covered by a collective bargaining agreement with the Professional Employees Association. These collective bargaining agreements expire in 2015.
As of September 30, 2013, 938 of our employees in Australia were covered under a Collective Agreement, which is similar in form to a collective bargaining agreement. The Collective Agreement is renewed annually.
None of our other employees are covered under any such agreement. We consider our relations with our employees to be good.
Other information
MAXIMUS is a Virginia Corporation, founded in 1975.
Our principal executive offices are located at 1891 Metro Center Drive, Reston, Virginia, 20190. Our telephone number is 703-251-8500.
Our Internet address is http://www.maximus.com. We make our website information available for information purposes only. It should not be relied upon for investment purposes, nor is it incorporated by reference into this Form 10-K.
We make our Annual Report on Form 10-K, quarterly reports on Form 10-Q, current reports on Form 8-K, and the proxy statement for our annual shareholders' meeting, as well as any amendments to those reports, available free of charge through our website as soon as reasonably practical after we file that material with, or furnish it to, the SEC. Our SEC filings may be accessed through the Investor Relations page of our website. These materials, as well as similar materials for other SEC registrants, may be obtained directly from the SEC through their website at http://www.sec.gov. This information may also be read and copied at the SEC's Public Reference Room at 100 F Street NE, Washington, DC 20549. Information on the operation of the Public Reference Room may be obtained by calling the SEC at 1-800-SEC-0330.
Glossary
Key terms included in this section of our Annual Report on Form 10-K include the following:
ACA—The Affordable Care Act, also known as Health Reform or Health Care Reform
CHIP—Children's Health Insurance Program
CHIPRA—Children's Health Insurance Program Reauthorization Act
Our operations are subject to many risks that could adversely affect our future financial condition and performance and, therefore, the market value of our securities. See Exhibit 99.1 of this Annual Report on Form 10-K under the caption "Special Considerations and Risk Factors" for information on risks and uncertainties that could affect our future financial condition and performance. The information in Exhibit 99.1 is incorporated by reference into this Item 1A.
14
We own a 60,000 square foot office building in Reston, Virginia. We also lease offices for operations, management and administrative functions in connection with the performance of our services. At September 30, 2013, we leased 114 offices in the United States totaling approximately 2.0 million square feet. In four countries outside the United States, we leased 174 offices containing approximately 0.6 million square feet. The lease terms vary from month-to-month to ten-year leases and are generally at market rates. In the event that a property is used for our services in the United States, we typically negotiate clauses to allow termination of the lease if the service contract is terminated by our customer. Such clauses are not standard in overseas leases.
We believe that our properties are maintained in good operating condition and are suitable and adequate for our purposes.
The Company is involved in various legal proceedings, including contract and employment claims, in the ordinary course of its business. The matters reported on below involve significant pending or potential claims against us.
In March 2009, a state Medicaid agency asserted a claim against MAXIMUS, related to a discontinued business line, in the amount of $2.3 million in connection with a contract MAXIMUS had through February 1, 2009 to provide Medicaid administrative claiming services to school districts in the state. MAXIMUS entered into separate agreements with the school districts under which MAXIMUS helped the districts prepare and submit claims to the state Medicaid agency which, in turn, submitted claims for reimbursement to the United States Federal Government. No legal action has been initiated. The state has asserted that its agreement with MAXIMUS requires the Company to reimburse the state for the amounts owed to the Federal Government. However, the Company's agreements with the school districts require them to reimburse MAXIMUS for such payments and therefore MAXIMUS believes the school districts are responsible for any amounts disallowed by the state Medicaid agency or the Federal Government. Accordingly, the Company believes its exposure in this matter is limited to its fees associated with this work and that the school districts will be responsible for the remainder. MAXIMUS has exited the federal health care claiming business and no longer provides the services at issue in this matter.
In 2008 MAXIMUS sold the SchoolMAX student information system business line as part of the divestiture of the MAXIMUS Education Systems division. In 2012, a school district ("District") which was a SchoolMAX client filed a formal arbitration notice alleging that MAXIMUS and the buyer failed to (i) use best practices in developing the software and (ii) deliver and test product releases as required by the contract. The District contended that those failures resulted in damages of at least $10 million. In December 2012, the arbitration panel denied the District's claims in their entirety. Costs related to the arbitration proceeding have been included within discontinued operations. The District subsequently filed a motion to vacate the decision of the arbitration panel which was denied by the court in July 2013. The District has appealed that ruling. Separately, in late 2012, the District asserted that MAXIMUS had defrauded the District in 2007 or 2008 by misrepresenting its intentions regarding the sale of the Education Systems division. That allegation was not part of the arbitration, and no formal claim or lawsuit has been filed. The company believes it has a number of defenses to that allegation and would contest it vigorously if it were asserted.
ITEM 4. Mine Safety Disclosures
Not applicable
15
ITEM 5. Market for Registrant's Common Equity, Related Stockholder Matters and Issuer Purchases of Equity Securities.
Our common stock trades on the New York Stock Exchange under the symbol "MMS." The following table sets forth, for the fiscal periods indicated, the range of high and low sales prices for our common stock and the cash dividends per share declared on the common stock. All common stock and per share amounts have been adjusted for the stock split.
| |
Price Range | |
||||||||
|---|---|---|---|---|---|---|---|---|---|---|
| |
High | Low | Dividends | |||||||
Year Ended September 30, 2013: |
||||||||||
First Quarter |
$ | 32.58 | $ | 27.20 | $ | 0.045 | ||||
Second Quarter |
40.50 | 31.76 | 0.045 | |||||||
Third Quarter |
40.69 | 35.32 | 0.045 | |||||||
Fourth Quarter |
45.35 | 34.65 | 0.045 | |||||||
Year Ended September 30, 2012: |
||||||||||
First Quarter |
$ | 21.37 | $ | 16.74 | $ | 0.045 | ||||
Second Quarter |
23.40 | 20.13 | 0.045 | |||||||
Third Quarter |
25.97 | 19.97 | 0.045 | |||||||
Fourth Quarter |
30.03 | 24.24 | 0.045 | |||||||
As of October 31, 2013, there were 63 holders of record of our outstanding common stock. The number of holders of record is not representative of the number of beneficial owners due to the fact that many shares are held by depositories, brokers, or nominees. We estimate there are approximately 22,600 beneficial owners of our common stock.
We expect to continue our policy of paying regular cash dividends, although there is no assurance as to future dividends. Future cash dividends, if any, will be paid at the discretion of our Board of Directors and will depend, among other things, upon our future operations and earnings, capital requirements and surplus, general financial condition, contractual restrictions and other factors our Board of Directors may deem relevant.
As partial consideration for the acquisition of Health Management Limited (HML) on July 1, 2013, we issued 202,972 unregistered shares of our common stock to the former owners of HML. The recipients have agreed to hold these shares for a period of at least two years. The shares were issued pursuant to Section 4(a)(2) of the Securities Act and Regulation S promulgated under the Securities Act.
16
The following table sets forth information regarding repurchases of common stock that we made during the three months ended September 30, 2013:
Period
|
Total Number of Shares Purchased |
Average Price Paid per Share |
Total Number of Shares Purchased as Part of Publicly Announced Plans(1) |
Approximate Dollar Value of Shares that May Yet Be Purchased Under the Plan (in thousands) |
|||||||||
|---|---|---|---|---|---|---|---|---|---|---|---|---|---|
Jul. 1, 2013 - Jul. 31, 2013 |
4,000 | $ | 34.95 | 4,000 | $ | 102,177 | |||||||
Aug. 1, 2013 - Aug. 31, 2013 |
138,100 | 37.61 | 138,100 | $ | 97,093 | ||||||||
Sep. 1, 2013 - Sep. 30, 2013 |
3,500 | 38.86 | 3,500 | $ | 97,065 | ||||||||
Total |
145,600 | $ | 37.56 | 145,600 | |||||||||
17
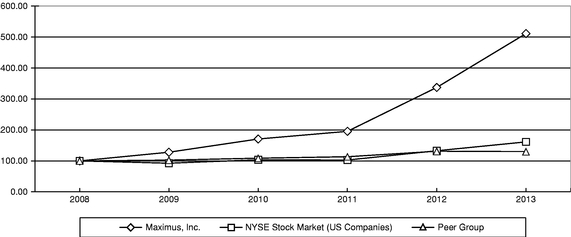
The following graph compares the cumulative total shareholder return on our common stock for the five-year period from September 30, 2008 to September 30, 2013, with the cumulative total return for the NYSE Stock Market (U.S. Companies) Index and a peer group comprising Accenture, CGI, Hewlett Packard, IBM and Xerox. The peer group companies represent a mix of information technology, BPS and management consultancy businesses and reflect a cross section of businesses against whom the Company competes for business and executive talent. The peer group is weighted by market capitalization. This graph assumes the investment of $100 on September 30, 2008 in our common stock, the NYSE Stock Market (U.S. Companies) Index, and our peer group and assumes dividends are reinvested.
Comparison of 5 Year Cumulative Total Return
Assumes Initial Investment of $100
September 2013
Comparison of Five—Year Cumulative Total Returns
Performance Graph for
MAXIMUS, INC.
Notes:
18
ITEM 6. Selected Financial Data.
We have derived the selected consolidated financial data presented below, as adjusted for discontinued operations, from our consolidated financial statements and the related notes. The revenue and operating results related to the acquisition of companies using the purchase accounting method are included from the respective acquisition dates. The selected financial data should be read in conjunction with "Management's Discussion and Analysis of Financial Condition and Results of Operations" included as Item 7 of this Annual Report on Form 10-K and with the Consolidated Financial Statements and related Notes included as Item 8 of this Annual Report on Form 10-K. The historical results set forth in this Item 6 are not necessarily indicative of the results of operations to be expected in the future. All common stock and per share amounts have been adjusted for the stock split.
| |
Year Ended September 30, | |||||||||||||||
|---|---|---|---|---|---|---|---|---|---|---|---|---|---|---|---|---|
| |
2013 | 2012 | 2011 | 2010 | 2009 | |||||||||||
| |
(In thousands, except per share data) |
|||||||||||||||
Statement of operations data: |
||||||||||||||||
Revenue |
$ | 1,331,279 | $ | 1,050,145 | $ | 929,633 | $ | 831,749 | $ | 720,108 | ||||||
Acquisition-related expenses(1) |
2,168 | 2,876 | — | 254 | — | |||||||||||
Legal and settlement expense (recovery), net(2) |
(202 | ) | 90 | (808 | ) | (5,605 | ) | (4,271 | ) | |||||||
Operating income from continuing operations |
186,208 | 127,575 | 122,401 | 107,406 | 88,589 | |||||||||||
Income from continuing operations |
117,125 | 76,099 | 82,142 | 69,397 | 53,841 | |||||||||||
Income (loss) from discontinued operations(3) |
(394 | ) | 34 | (974 | ) | 1,012 | (7,301 | ) | ||||||||
Net income |
$ | 116,731 | $ | 76,133 | $ | 81,168 | $ | 70,409 | $ | 46,540 | ||||||
Basic earnings per share: |
||||||||||||||||
Income from continuing operations |
$ | 1.72 | $ | 1.12 | $ | 1.19 | $ | 1.00 | $ | 0.77 | ||||||
Income (loss) from discontinued operations |
(0.01 | ) | — | (0.01 | ) | 0.01 | (0.11 | ) | ||||||||
Basic earnings per share |
$ | 1.71 | $ | 1.12 | $ | 1.18 | $ | 1.01 | $ | 0.66 | ||||||
Diluted earnings per share: |
||||||||||||||||
Income from continuing operations |
$ | 1.68 | $ | 1.09 | $ | 1.16 | $ | 0.97 | $ | 0.75 | ||||||
Income (loss) from discontinued operations |
(0.01 | ) | — | (0.02 | ) | 0.01 | (0.10 | ) | ||||||||
Diluted earnings per share |
$ | 1.67 | $ | 1.09 | $ | 1.14 | $ | 0.98 | $ | 0.65 | ||||||
Weighted average shares outstanding: |
||||||||||||||||
Basic |
68,165 | 67,734 | 68,834 | 69,653 | 70,282 | |||||||||||
Diluted |
69,893 | 69,611 | 71,062 | 71,860 | 71,545 | |||||||||||
Cash dividends per share of common stock |
$ | 0.18 | $ | 0.18 | $ | 0.15 | $ | 0.12 | $ | 0.12 | ||||||
| |
At September 30, | |||||||||||||||
|---|---|---|---|---|---|---|---|---|---|---|---|---|---|---|---|---|
| |
2013 | 2012 | 2011 | 2010 | 2009 | |||||||||||
| |
(In thousands) |
|||||||||||||||
Balance Sheet Data: |
||||||||||||||||
Cash and cash equivalents |
$ | 125,617 | $ | 189,312 | $ | 172,950 | $ | 155,321 | $ | 87,815 | ||||||
Working capital |
227,292 | 258,606 | 227,383 | 191,461 | 164,646 | |||||||||||
Total assets |
857,978 | 695,293 | 565,279 | 527,741 | 433,234 | |||||||||||
Long-term debt |
1,489 | 1,736 | 1,696 | 1,411 | — | |||||||||||
Total shareholders' equity |
529,508 | 451,106 | 374,457 | 338,789 | 297,128 | |||||||||||
19
During the year ended September 30, 2010, the Company sold its Enterprise Resource Planning (ERP) division. The operating results of that division are shown as discontinued operations for all periods presented. The Company recorded an additional loss on the sale of the ERP division in the year ended September 30, 2011 as the final sales price was resolved. During the year ended September 30, 2013, the Company incurred additional costs related to legal matters pertaining to discontinued operations and also received funds related to the sale of a business in fiscal year 2008.
20
ITEM 7. Management's Discussion and Analysis of Financial Condition and Results of Operation.
The following discussion and analysis of financial condition and results of operations is provided to enhance the understanding of, and should be read in conjunction with, our Consolidated Financial Statements and the related Notes.
Business overview
We provide business process services (BPS) to government health and human services agencies under our mission of Helping Government Serve the People.® Our business is focused almost exclusively on administering government-sponsored programs such as Medicaid, CHIP, health care reform, welfare-to-work, Medicare, child support and other government programs. We are one of the largest pure-play health and human services administrative providers to governments in the United States, Australia, Canada, the United Kingdom and Saudi Arabia. We use our deep domain expertise, repeatable processes and technology solutions to help government agencies run efficient, cost-effective programs and to improve program accountability and outcomes, while enhancing the quality of services provided to program beneficiaries.
During the past five years, the Company has focused on its core health and human services businesses. Prior to this point, a number of non-core businesses were divested or discontinued while operations were expanded in the United States and internationally through a combination of organic growth and the acquisition of companies with complementary capabilities. We believe that this focus, balanced by a risk-management structure, has enabled the Company to attain profitable growth in recent years.
The Company believes that a combination of its record of results, robust financial performance and global experience makes it well-positioned to capitalize on opportunities in its existing markets and elsewhere. Both within the United States and internationally, governments are being challenged by factors that increase social burdens, including ageing populations and demands for health care reform, offset by reduced funds with which to deal with these demands. We believe that these trends will provide a demand for services that can be met by companies such as MAXIMUS.
Acquisitions
On July 1, 2013, the Company acquired Health Management Limited (HML), a leading provider of independent health assessments within the United Kingdom. MAXIMUS acquired HML in order to expand the Company's independent medical assessment business and to strengthen the presence of the Company's Health Services Segment in the United Kingdom. HML provided $14.1 million of revenue and $0.5 million of operating income during the fourth fiscal quarter of fiscal year 2013.
On April 30, 2012, the Company acquired Policy Studies, Inc. (PSI). PSI supports government clients in the administration of a number of health and human services programs exclusively within the United States. MAXIMUS acquired PSI, among other reasons, to strengthen its leadership in the administration of public health and human services programs. The acquired assets and business have been integrated into the Company's Health Services and Human Services Segments.
In assessing the performance of our business, we believe that it is helpful to our investors to show organic revenue growth, which represents the increase in revenue from contracts excluding those provided by our acquired businesses. Organic growth is a non-GAAP number that we believe provides a useful basis for assessing the performance of the business excluding the results of PSI and HML. In order to calculate organic growth, we remove the revenue from the acquired businesses from all periods being compared. Organic growth is not meant to be used in isolation, nor as an alternative to revenue growth as a measure of performance.
21
Financial overview
The Company has experienced strong year-over-year growth in both revenue and operating profit across both segments. There are a number of drivers of this growth.
The Company continues to see opportunities to further expand the business. In particular, the implementation of the Affordable Care Act (ACA) and Medicaid expansion in the United States has provided opportunities for MAXIMUS related to the federal and state-based health insurance exchanges. MAXIMUS estimates that ACA has added more than $150 million in new annual contract revenue for the Company from the operation of customer contact centers for five states, the District of Columbia and the United States Federal Government. In addition, MAXIMUS is providing eligibility appeals services for the federal exchange and expertise and experience to other states in their preparations for the implementation of ACA.
Although the Company's operations have expanded, cash flows from operations have been constrained through the additional requirements for working capital necessitated by the Company's growth, as well as increases in the time taken by our customers to pay us. The Company's free cash flow, which includes cash outflows related to capital expenditures, has also been tempered by the need to invest in the necessary infrastructure primarily associated with new contract awards, particularly in the United States. Overall, the Company's cash balance has declined by $63.7 million during fiscal 2013, which includes a cash payment of $71.4 million related to the acquisition of HML.
Sales pipeline at September 30, 2013 was $2.4 billion, compared to $2.6 billion at September 30, 2012. At the start of the current year, the Company had a significant number of new contracts in start-up and these converted opportunities were the principal driver behind the current fiscal year's growth in revenue. The sales pipeline only reflects opportunities where the request for proposal (RFP) is expected to be released within the next six months. Under most circumstances, contract opportunities that are carried within the pipeline reflect the base contract value and do not include future option periods. Option periods are typically reported in the pipeline six months before they are eligible to be exercised. For contracts with the United States Federal Government, it is common to see a single year base contract with multiple options, whereas state, local and international contracts typically have longer base periods. Our assessment of pipeline reflects only opportunities that the Company is pursuing or planning to pursue and should not be considered as indicative of guaranteed future revenues.
International businesses
The Company operates in international locations and, accordingly, transacts business in currencies other than the United States Dollar, principally the Australian Dollar, the Canadian Dollar, the British Pound and the Saudi Arabian Riyal. During the year ended September 30, 2013, the Company earned approximately 25% of revenues and operating income from foreign subsidiaries. At September 30,
22
2013, approximately 34% of the Company's assets are held by foreign subsidiaries. International business exposes the Company to certain risks.
The Company's revenues, profits and asset balances, including cash balances, are affected by fluctuations in the currencies noted above. When the United States Dollar is strengthening, as it was during fiscal year 2013, our international operations will contribute less revenue and profit than would have been the case had the currencies remained consistent. In assessing the performance of our business, we believe that it is helpful to our investors to show constant currency revenue growth, which represents the increase in revenue from contracts excluding the effects of year-over-year currency fluctuations. Constant currency growth is a non-GAAP number that we believe provides a useful basis for assessing the performance of the business excluding the unpredictable effects of foreign exchange movements. In order to calculate constant currency, we calculate revenue for all international businesses using the exchange rates used in the prior year. Constant currency growth is not meant to be used in isolation, nor as an alternative to revenue growth as a measure of performance.
23
Summary of consolidated results
The following table sets forth, for the fiscal year ends indicated, selected statements of operations data:
| |
Year ended September 30, | |||||||||
|---|---|---|---|---|---|---|---|---|---|---|
| |
2013 | 2012 | 2011 | |||||||
| |
(dollars in thousands, except per share data) |
|||||||||
Revenue |
$ | 1,331,279 | $ | 1,050,145 | $ | 929,633 | ||||
Gross profit |
386,033 |
287,943 |
253,651 |
|||||||
Gross profit margin |
29.0 | % | 27.4 | % | 27.3 | % | ||||
Selling, general and administrative expense |
197,859 |
157,402 |
132,058 |
|||||||
Selling, general and administrative expense as a percentage of revenue |
14.9 | % | 15.0 | % | 14.2 | % | ||||
Operating income excluding acquisition-related expenses and legal and settlement expenses and recoveries |
188,174 |
130,541 |
121,593 |
|||||||
Operating income excluding legal and settlement expense as a percentage of revenue |
14.1 | % | 12.4 | % | 13.1 | % | ||||
Acquisition-related expenses |
2,168 |
2,876 |
— |
|||||||
Legal and settlement expense (recovery) |
(202 | ) | 90 | (808 | ) | |||||
Operating income from continuing operations |
186,208 |
127,575 |
122,401 |
|||||||
Operating margin from continuing operations |
14.0 | % | 12.1 | % | 13.2 | % | ||||
Interest and other income, net |
2,851 |
4,176 |
3,495 |
|||||||
Income from continuing operations before income taxes |
189,059 |
131,751 |
125,896 |
|||||||
Provision for income taxes |
71,934 | 55,652 | 43,754 | |||||||
Tax rate |
38.0 | % | 42.2 | % | 34.8 | % | ||||
Income from continuing operations, net of income taxes |
117,125 |
76,099 |
82,142 |
|||||||
Income (loss) from discontinued operations, net of income taxes |
(394 | ) | 34 | (974 | ) | |||||
Net income |
$ | 116,731 | $ | 76,133 | $ | 81,168 | ||||
Basic Earnings per share: |
||||||||||
Income from continuing operations |
$ | 1.72 | $ | 1.12 | $ | 1.19 | ||||
Income (loss) from discontinued operations |
(0.01 | ) | — | (0.01 | ) | |||||
Basic earnings per share |
$ | 1.71 | $ | 1.12 | $ | 1.18 | ||||
Diluted Earnings per share: |
||||||||||
Income from continuing operations |
$ | 1.68 | $ | 1.09 | $ | 1.16 | ||||
Income (loss) from discontinued operations |
(0.01 | ) | — | (0.02 | ) | |||||
Diluted earnings per share |
$ | 1.67 | $ | 1.09 | $ | 1.14 | ||||
The Company's common stock was split two-for-one during the 2013 fiscal year. All results presented in these financial statements have been adjusted for this stock split.
The following provides an overview of the significant elements of our Consolidated Statements of Operations. As our business segments have different factors driving revenue growth and profitability, the sections that follow cover these segments in greater detail.
24
Fiscal year 2013 compared to fiscal year 2012
Revenue increased 26.8% to $1,331.3 million. On a constant currency basis, growth would have been 27.5%. Organic growth was 19.4%. Much of the growth came from our Health Services Segment, driven by new work, the expansion of existing contracts and the acquisitions of PSI and HML.
Gross profit increased 34.1% to $386.0 million, representing a profit margin of 29.0% compared to 27.4% in the prior year. Gross profit margins within the Health Services Segment was driven principally by the accretive nature of the higher volumes in our federal Medicare appeals business. Gross profit margins declined within our Human Services Segment, driven in part by additional costs within our Australian business.
Selling, general and administrative expense (SG&A) consists of costs related to general management, marketing and administration. These costs include salaries, benefits, bid and proposal efforts, travel, recruiting, continuing education, employee training, non-chargeable labor costs, facilities costs, printing, reproduction, communications, equipment depreciation, intangible amortization and legal expenses incurred in the ordinary course of business. Our SG&A as a percentage of revenue has remained broadly consistent between fiscal year 2013 and 2012.
Operating income from continuing operations increased 46.0% to $186.2 million for the year ended September 30, 2013, compared to the prior year. Excluding the acquisition-related expenses and legal and settlement expense, growth would have been 44.1%. This growth was driven by the acquisitions of PSI and HML, new work in our Health Services Segment and $10.9 million of income related to a terminated contract.
Interest and other income declined due to decreases in our international cash balances, which generated the majority of our interest income. These funds were used to acquire HML.
Our tax rate for fiscal year 2013 was 38.0%, compared to 42.2% in 2012. The prior year tax rate includes a charge of $2.7 million to correct an error from prior years, without which the rate would have been 40.3%. During fiscal year 2013, the Company received the benefit of increased profits in locations with lower tax rates than the United States, particularly in the United Kingdom, where the ramp up of the UK contract and the acquisition of HML resulted in profits taxed at lower rates. We anticipate that our tax rate will decline slightly during fiscal year 2014, primarily driven by anticipated profit outlook by jurisdiction.
Fiscal year 2012 compared to fiscal year 2011
Revenue increased 13.0% to $1,050.1 million. On a constant currency basis, growth would have been 13.2%. Organic growth was 6.5%. Organic growth was driven by the Health Services Segment, which was offset by declines in revenue from our international operations in the Human Services Segment.
Gross profit increased 13.5% to $287.9 million, representing a profit margin of 27.4% compared to 27.3% in the prior year. Although gross profit margins did not move significantly at a consolidated level, gross profit margins in the Health Services Segment declined and those in the Human Services Segment increased, as discussed in more detail below.
SG&A increased by 19.2% to $157.4 million. This increase is in excess of the increase in revenue and was caused by a number of factors including significant business development activity, including the preparation of bids and proposals, and the acquisition of PSI, which resulted in additional intangible asset amortization expense.
Operating income from continuing operations increased 4.2% to $127.6 million for the year ended September 30, 2012, compared to the prior year. Excluding the acquisition-related expenses and legal and settlement expense, growth would have been 7.4%. This growth was driven by the acquisition of
25
PSI, new work in our Health Services Segment and growth in our Human Services Segment. The sections below cover segment results in more detail.
Interest and other income increased primarily due to increases in cash balances in jurisdiction with higher interest rates than the United States. This increase in cash was driven by strong international cash flows.
Our effective tax rate for fiscal year 2012 was 42.2% compared with 34.8% in 2011. The tax charge in fiscal year 2012 included a charge of $2.7 million to correct an error from prior years, without which the rate would have been 40.3%. This increase was driven by a greater share of the Company's profits being recorded in the United States, which has a higher corporate tax rate than other jurisdictions in which the Company operates. The increase in profits in the United States was driven by organic growth; the acquisition of PSI, which conducted all of its business within the United States; and the anticipated decline in profits in the United Kingdom, which is discussed below.
Income from continuing operations, net of income taxes, declined 7.4% to $76.1 million. The benefits from the Company's organic growth and acquisitions were offset by the significantly higher tax rate.
Acquisition-related expenses and legal and settlement expenses
Acquisition-related expenses are direct costs incurred as a consequence of the acquisition of HML in 2013, PSI in 2012 and various other acquisitions that were not completed. These costs include legal fees, brokerage fees, due diligence, valuation reports, contract terminations related to redundant support services and severance.
Legal and settlement expense (recovery) consists of costs, net of reimbursed insurance claims, related to significant legal settlements and non-routine legal matters, including future probable legal costs estimated to be incurred in connection with those matters. Legal expenses incurred in the ordinary course of business are included in selling, general and administrative expense. Legal and settlement expenses (recoveries) are summarized below (in thousands):
| |
Year ended September 30, | |||||||||
|---|---|---|---|---|---|---|---|---|---|---|
| |
2013 | 2012 | 2011 | |||||||
Insurance recoveries |
$ | (390 | ) | $ | (1,180 | ) | $ | — | ||
Employee lawsuit |
— | 600 | — | |||||||
Client indemnification |
— | 490 | — | |||||||
Other |
188 | 180 | (808 | ) | ||||||
Legal and settlement expense (recovery) |
$ | (202 | ) | $ | 90 | $ | (808 | ) | ||
During fiscal year 2012, the Company agreed to settle a lawsuit brought by a former employee for $0.6 million and agreed to pay $0.5 million relating to client indemnification of funds misappropriated by a former employee. During fiscal year 2013, the Company's insurance provider reimbursed the Company for part of the latter claim.
The insurance recovery in fiscal year 2012 relates to a litigation settlement in fiscal year 2008.
During the 2011 fiscal year, the Company reversed a legal expense previously recognized in fiscal year 2010 for a matter that concluded without liability to the Company.
We discuss operating income from continuing operations excluding acquisition-related expenses and legal and settlement expenses and recoveries. Operating income excluding acquisition-related expenses and legal and settlement expenses and recoveries is a non-GAAP number. We believe that excluding acquisition-related expenses and legal and settlement expenses and recoveries provides a framework for comparing the performance of the business between periods as these charges do not
26
reflect the underlying performance of the business. This non-GAAP number should not be used in isolation, nor as an alternative to operating income as a measure of performance.
Health Services Segment
The Health Services Segment provides a variety of business process services for state, provincial and federal programs, such as ACA, Medicaid, CHIP, Medicare and the Health Insurance British Columbia Program.
| |
Year ended September 30, | |||||||||
|---|---|---|---|---|---|---|---|---|---|---|
| |
2013 | 2012 | 2011 | |||||||
| |
(dollars in thousands) |
|||||||||
Revenue |
$ | 862,879 | $ | 671,181 | $ | 565,881 | ||||
Gross profit |
248,100 | 172,456 | 147,239 | |||||||
Operating income |
129,834 | 80,619 | 74,715 | |||||||
Gross profit margin |
28.8 |
% |
25.7 |
% |
26.0 |
% |
||||
Operating profit margin |
15.0 | % | 12.0 | % | 13.2 | % | ||||
Fiscal year 2013 versus fiscal year 2012
Revenue increased by 28.6% to $862.9 million. Growth was not significantly affected by year-over-year fluctuations in foreign currency exchange rates. Organic growth was 22.8%. Gross profit increased by 43.9% and operating profit increased by 61.0%, with margins increasing year-over-year.
The results for the segment were driven by:
The expansion of the gross and operating profit margins was driven principally by the accretive nature of the higher volumes in our federal Medicare business.
We expect to see growth in fiscal year 2014 through the full year benefit of our contracts associated with ACA. The Health Services Segment should also receive the benefit of a full year of HML's business. We expect lower margins in the Health Services Segment in fiscal year 2014 compared with fiscal year 2013. This is driven by an expected increase in federal cost-reimbursable contracts, which tend to have lower margins; highly accretive contract work ending; and the launch of a loss-making contract that was acquired as part of the PSI acquisition.
Fiscal year 2012 versus fiscal year 2011
Revenue increased by 18.6%, or 18.9% on a constant currency basis. Organic growth was 14.8%. Gross profit increased by 17.1% and operating profit increased by 7.9%, with margins declining year-over-year.
The results for the segment were driven by:
27
Human Services Segment
The Human Services Segment includes a variety of business process services, case management, job training and support services for programs such as welfare-to-work programs, child support, K-12 special education and other specialized consulting services.
| |
Year ended September 30, | |||||||||
|---|---|---|---|---|---|---|---|---|---|---|
| |
2013 | 2012 | 2011 | |||||||
| |
(dollars in thousands) |
|||||||||
Revenue |
$ | 468,400 | $ | 378,964 | $ | 363,752 | ||||
Gross profit |
137,933 | 115,487 | 106,412 | |||||||
Operating income |
58,091 | 49,922 | 46,822 | |||||||
Gross profit margin |
29.4 |
% |
30.5 |
% |
29.3 |
% |
||||
Operating profit margin |
12.4 | % | 13.2 | % | 12.9 | % | ||||
The results for the Human Services Segment in fiscal year 2013 were affected by a one-time benefit from the termination of a system-integration contract acquired with PSI. The termination resulted in one-time, non-cash benefits to revenue of $16.0 million and to gross and operating profit of $10.9 million. Although contract terminations for convenience do occur within our business, they are infrequent. In addition, this termination was unusual due to the significant effect of the transaction as it involved deferred revenue from the PSI acquisition and does not reflect the underlying operations of the Company. We have provided a reconciliation below showing our results excluding the effect of this contract.
| |
Results for Human Services Segment for year ended September 30, 2013 | |||||||||
|---|---|---|---|---|---|---|---|---|---|---|
| |
Revenue | Gross profit | Operating profit | |||||||
| |
(dollars in thousands) |
|||||||||
As reported |
$ | 468,400 | $ | 137,933 | $ | 58,091 | ||||
Effect of terminated contract |
(16,035 | ) | (10,900 | ) | (10,900 | ) | ||||
Results excluding the effect of the terminated contract |
452,365 | 127,033 | 47,191 | |||||||
Profit margins excluding the effect of the terminated contract. |
28.1 | % | 10.4 | % | ||||||
The numbers in the table above are non-GAAP numbers, but we believe that the presentation of these numbers provides a useful basis for assessing the performance of this segment compared to prior periods or the results of our competitors. However, these non-GAAP numbers should not be considered in isolation nor as alternatives to their GAAP equivalents as measures of performance.
Fiscal year 2013 versus fiscal year 2012
Revenue increased 23.6% to $468.4 million. On a constant currency basis, growth would have been 25.4% and organic growth was 12.8%. Gross profit increased 19.4% and operating profit increased 16.4%. Excluding the effect of the termination of the contract, revenue growth was 19.4%.
Results for the segment were driven by a number of factors:
28
We are forecasting that fiscal year 2014 will be fairly flat for revenue compared to fiscal year 2013. This assumes that growth in our international operations will be offset by a decline in the United States, largely related to the successful completion of a large, multi-year, fixed-price contract. In both fiscal years 2013 and 2012, the segment enjoyed unusual benefits from two contracts that seem unlikely to be repeated in fiscal year 2014. We believe the full year segment operating margins will be towards the lower end of our stated range of 10-15%.
Fiscal year 2012 versus fiscal year 2011
Revenue increased 4.2% to $379.0 million in fiscal year 2012 compared to fiscal year 2011. On a constant currency basis, the growth would have been 4.4%. Excluding acquisition driven growth from PSI, segment revenues would have declined 6.4%. Gross profit increased 8.5% and operating profit increased 6.6%, resulting in increases to both profit margins.
The results for the segment were driven by a number of factors.
Discontinued operations
During the year ended September 30, 2013, the Company incurred legal costs in defending a proceeding related to a discontinued operation. The Company prevailed in that proceeding, but the plaintiff has appealed and the Company may continue to incur costs in defending itself due to claims arising from this, or any other, discontinued operation. Although the Company estimates and accrues anticipated costs relating to such actions, and tries to negotiate indemnifications against liabilities arising from discontinued operations where possible, the Company is unable to anticipate every potential legal claim, and might incur legal defense costs.
29
The Company's results in fiscal year 2011 include the effects of the sale of our ERP business, which took place during fiscal year 2010. During fiscal year 2011, the Company resolved a dispute with the buyer of the business and recorded a pre-tax loss of $1.7 million.
The Company continues to record gains on the sale of Unison MAXIMUS, Inc., a business which was sold in May 2008. The consideration for the sale included a promissory note which is fully reserved. Small payments continue to be received on this note, but owing to uncertainties over the collectability of the full balance, the Company has only recorded a gain on sale where recovery is considered assured, which is typically when cash payments are received. The Company recorded gains on sale of $0.4 million, $0.1 million and $0.3 million for the years ended September 30, 2013, 2012 and 2011, respectively.
Liquidity and capital resources
In recent years, the Company has relied upon cash flows from operations to fund operations, capital expenditures, acquisitions, share repurchases and dividends. Both domestic and overseas locations have remained self-sufficient in funding operations and capital resources. The Company expects to be able to continue to fund operations and capital expenditures from operating cash flows but has a line of credit available if necessary to fund operations. In prior periods, the Company has faced short-term payment delays from state customers, all of which were ultimately recovered. The Company believes its liquidity and capital positions are adequate to weather short-term payment delays. In the event of more protracted delays, the Company may be required to seek additional capital sources, amend payment terms or take other actions. Extended payment delays could adversely affect the Company's cash flows, operations and profitability.
At September 30, 2013, the Company held $125.6 million in cash and cash equivalents. Approximately 60% of these funds are held in overseas locations, principally in Canada and Australia. If we were to transfer these funds to the United States, the Company could be required to accrue and pay additional taxes. We have no requirement to repatriate these funds as we believe we have access to sufficient funds in the United States to fund our operations, capital outlays, dividends, share repurchases or any other requirements. Accordingly, we do not intend to repatriate these funds held overseas and we have not attempted to quantify the charges that might arise if we were to make this transaction. The charges would vary based upon tax legislation in the United States and in the overseas jurisdictions as well as the manner and timing of these transactions.
The Company currently has no debt, with the exception of a $1.5 million interest-free loan from the Atlantic Innovation Fund of Canada, the funds of which must be used for certain investment projects in Prince Edward Island. At September 30, 2013, the Company has access to up to $84.6 million from a credit facility in the United States. These funds are available to cover short-term cash requirements and other potential capital outlays, including share repurchases and acquisitions. Also at September 30, 2013, the Company had letters of credit totaling $15.4 million and performance bond commitments totaling $50.8 million. The letters of credit and performance bonds are typically renewed annually and remain in place until the contractual obligations have been satisfied. Although the triggering events vary from contract to contract, in general we would only be liable for the amount of these guarantees in the event of default of our obligations under each contract, the probability of which we believe is remote.
Our primary source of cash is revenues received from customers. Our collection of cash is driven by billing schedules and payment terms that can vary based upon a number of factors, including contract type. In certain contracts, particularly international welfare-to-work contracts, cash receipts are structured around our performance, which may take several quarters to be realized. In these cases, contracts will typically result in cash outflows over the early period of the contract and the ultimate cash flows of the contract will be subject to risk until the performance outcomes are known. Certain contracts require significant financial outlays in terms of capital assets and in start-up costs. These
30
expenditures result in our use of cash which may be reimbursed during the set-up phase or over the life of the contract. Related revenue may also be deferred during the set-up phase. At September 30, 2013, management considered that the net book value of all capital assets, including deferred contract costs, was less than the expected future cash flows related to these assets.
The Company's acquisition of HML in July 2013 resulted in a net cash payment of $71.4 million, which was paid from cash held outside the United States. The Company's acquisition of PSI in April 2012 resulted in a net cash payment of $66.0 million, using cash based in the United States.
The following table provides a summary of our cash flow information for the three years ended September 30, 2013.
| |
Year ended September 30, | |||||||||
|---|---|---|---|---|---|---|---|---|---|---|
| |
2013 | 2012 | 2011 | |||||||
| |
(dollars in thousands) |
|||||||||
Net cash provided by (used in): |
||||||||||
Operating activities—continuing operations |
$ | 121,557 | $ | 115,160 | $ | 97,585 | ||||
Operating activities—discontinued operations |
(619 | ) | — | (725 | ) | |||||
Investing activities—continuing operations |
(129,833 | ) | (86,612 | ) | (25,877 | ) | ||||
Financing activities—continuing operations |
(41,862 | ) | (17,765 | ) | (51,608 | ) | ||||
Effect of exchange rates on cash and cash equivalents |
(12,938 | ) | 5,579 | (1,746 | ) | |||||
Net increase (decrease) in cash and cash equivalents |
$ | (63,695 | ) | $ | 16,362 | $ | 17,629 | |||
Cash provided by operating activities was $121.6 million in fiscal year 2013, which was slightly higher than cash flows in fiscal year 2012. The operating cash flows have been dampened by delays in payments from customers, as well as a general increase in working capital requirements as the business expands. We do not anticipate these delays in payments to continue but the level of receivables continues to be well within our expected range.
Cash provided by operating activities was $115.2 million in fiscal year 2012, an increase of $17.6 million from fiscal year 2011. The increase was primarily driven by increases in cash receipts from customers. This was driven by increases in revenue as well as the timing of cash receipts on certain projects which did not directly correspond with revenue recognition.
Cash used in operating activities from discontinued operations in fiscal year 2013 relates to arbitration charges on a discontinued line of business. In fiscal year 2011, the Company made payments related to the sale of the Company's ERP division in September 2010, notably the settlement of payroll and other liabilities that were not transferred to the buyers of the business.
Cash used in investing activities includes $68.1 million of net cash outflow related to acquisitions in fiscal year 2013 and $66.0 million in fiscal year 2012. These are principally related to the acquisitions of HML and PSI respectively, with some benefits arising from other transactions. Excluding these events, the principal driver of this cash outflow was the Company's capital expenditures, which increased significantly during fiscal year 2013 as a consequence of the significant additional requirements for new contract start-ups, principally within the United States and Canada. Future investing cash flows will be contingent upon acquisition activity and new business awards.
Cash used in financing activities from continuing operations was $41.9 million, $17.8 million and $51.6 million in fiscal years 2013, 2012 and 2011, respectively. These cash flows were principally driven by repurchases of common stock of $33.3 million, $13.0 million and $56.5 million, respectively. Other fluctuations have been caused by an increase in the Company's tax benefit on option exercises and RSU vestings, offset by increases in withholding payments related to employee tax liabilities. These increases reflect the increase in the share price since the grant date for many of the RSUs that vested in fiscal year 2013.
31
The detrimental effect of exchange rates on cash and cash equivalents of $12.9 million in the 2013 fiscal year reflects the strengthening of the United States Dollar against the Australian Dollar.
To supplement our statements of cash flows presented on a GAAP basis, we use the non-GAAP measure of free cash flow from continuing operations to analyze the funds generated from operations. We believe free cash flow from continuing operations is a useful basis for comparing our performance with our competitors. The presentation of non-GAAP free cash flow from continuing operations is not meant to be considered in isolation, nor as an alternative to net income as an indicator of performance, nor as an alternative to cash flows from operating activities as a measure of liquidity. We calculate free cash flow from continuing operations as follows:
| |
Year ended September 30, | |||||||||
|---|---|---|---|---|---|---|---|---|---|---|
| |
2013 | 2012 | 2011 | |||||||
| |
(dollars in thousands) |
|||||||||
Cash provided by operating activities—continuing operations |
$ | 121,557 | $ | 115,160 | $ | 97,585 | ||||
Purchases of property and equipment |
(43,580 | ) | (18,369 | ) | (18,506 | ) | ||||
Capitalized software costs |
(18,596 | ) | (4,779 | ) | (7,608 | ) | ||||
Free cash flow from continuing operations |
$ | 59,381 | $ | 92,012 | $ | 71,471 | ||||
Repurchases of the Company's common stock
The Board of Directors has authorized the repurchase, at management's discretion, of specified amounts of the Company's common stock. The Board has also authorized the use of option exercise proceeds for the repurchase of the Company's common stock. During the years ended September 30, 2013, 2012 and 2011, the Company repurchased 974,498, 612,000 and 3,194,916 common shares at a cost of $32.5 million, $12.8 million and $57.5 million, respectively. Up to $97.1 million remained available for repurchase under the most recent board authorization as of September 30, 2013.
Dividend
On October 4, 2013, the Company's Board of Directors declared a quarterly cash dividend of $0.045 for each share of the Company's common stock outstanding. The dividend will be paid on November 29, 2013 to shareholders of record on November 15, 2013. Based on the number of shares outstanding, the payment will be approximately $3.1 million.
Obligations and commitments
The following table summarizes our contractual obligations at September 30, 2013 that require the Company to make future cash payments (in thousands):
| |
Payments due by period | |||||||||||||||
|---|---|---|---|---|---|---|---|---|---|---|---|---|---|---|---|---|
Contractual obligations
|
Total | Less than 1 year |
1 - 3 years | 3 - 5 years | More than 5 years |
|||||||||||
| |
(Dollars in thousands) |
|||||||||||||||
Operating leases |
$ | 171,958 | $ | 52,406 | $ | 70,059 | $ | 33,462 | $ | 16,031 | ||||||
Long-term debt |
1,489 | 170 | 340 | 340 | 639 | |||||||||||
Deferred compensation plan liabilities(1) |
15,960 | 2,007 | 2,794 | 2,434 | 8,725 | |||||||||||
Total(2) |
$ | 189,407 | $ | 54,583 | $ | 73,193 | $ | 36,236 | $ | 25,395 | ||||||
32
The contractual obligations table also omits our liabilities with respect to acquisition-related contingent consideration. As part of the acquisition arrangement for DeltaWare Systems, Inc., which was acquired in fiscal year 2010, we agreed to pay up to 4.0 million Canadian Dollars in the event that certain sales targets are reached up to 2016. At present, we have accrued $0.4 million based upon a probability-weighted assessment of our likely payments under this arrangement. At this time, no sales arrangements have been entered into which would require a payment to be made. See "Note 4. Business combinations" of the Consolidated Financial Statements for additional information on this balance.
Off-balance sheet arrangements
We do not have material off-balance sheet risk or exposure to liabilities that are not recorded or disclosed in our financial statements. While we have significant operating lease commitments for office space, those commitments are generally tied to the period of performance under related contracts. Additionally, although on certain contracts we are bound by performance bond commitments and standby letters of credit, we have not had any defaults resulting in draws on performance bonds. Also, we do not speculate in derivative transactions.
Effects of inflation
As measured by revenue, approximately 20% of our business in fiscal year 2013 was conducted under cost-reimbursable contracts that adjust revenue to cover costs increased by inflation. Approximately 3% of the business was time-and-material contracts where labor rates are often fixed for several years. We generally have been able to price these contracts in a manner that accommodates the rates of inflation experienced in recent years. The remaining portions of our contracts are fixed-price and performance-based and are typically priced to account for the likely inflation from period to period to mitigate the risk of our business being adversely affected by inflation.
Critical accounting policies and estimates
The preparation of financial statements in conformity with accounting principles generally accepted in the United States requires us to make estimates and judgments that affect the amounts reported. We consider the accounting policies below to be the most important to our financial position and results of operations either because of the significance of the financial statement item or because of the need to use significant judgment in recording the balance. We base our estimates on historical experience and on various other assumptions that are believed to be reasonable under the circumstances, the results of which form the basis for making judgments about the carrying values of assets and liabilities. Actual results could differ from those estimates.
Revenue Recognition. Revenue is generated from contracts with various pricing arrangements, including:
33
We recognize revenue on arrangements as work is performed and amounts are earned. We consider amounts to be earned once evidence of an arrangement has been obtained, services have been delivered, fees are fixed or determinable and collectability of revenue is reasonably assured.
We recognize revenue on performance-based contracts when earned, which generally occurs when amounts are billable to customers. This may result in revenue being recognized in irregular increments.
Revenue on cost-plus contracts is recognized based on costs incurred plus an estimate of the negotiated fee earned. For certain contracts, the nature and allocation of costs incurred is subject to judgment and differing amounts could be recorded if underlying assumptions or estimates were to change. The Company closely monitors its methodology for recording cost-plus revenue and incorporates the results of client audits where applicable to refine these estimates. Changes in estimates may result in significant changes to revenue.
We recognize revenue on fixed-priced contracts when earned, as services are provided. Revenue is generally recognized on a straight-line basis unless evidence suggests that revenue is earned or obligations are fulfilled in a different pattern. The timing of expense recognition may result in irregular profit margins.
For certain fixed-price contracts, primarily systems design, development and implementation, we generally recognize revenue based upon costs incurred to date and our anticipated gross profit. The cumulative impact of any revisions in estimated revenue and costs is recognized in the period in which the facts that give rise to the revision become known. Provisions for estimated losses on incomplete contracts are provided for in full in the period in which such losses become known. This policy may result in revenues being recognized at different points from amounts being billable. Such contracts require a number of estimates including the timing of future work to be performed, the future costs of labor and materials and, where considered to be estimable and probable, adjustments to revenue from change orders or contract incentives. Changes to these estimates may result in changes to revenue and project profitability. Where the Company enters into contracts where significant uncertainty exists over the ability of management to estimate the future costs, the Company will typically defer all revenue until such time as future costs are estimable or the system implementation is complete.
Revenue on time and materials contracts is recognized based on hours worked and expenses incurred.
Where contracts have multiple deliverables, we evaluate these deliverables at the inception of each contract and as each item is delivered. As part of this evaluation, we consider whether a delivered item has value to a customer on a stand-alone basis and whether the delivery of the undelivered items is considered probable and substantially within our control, if a general right of return exists. Where deliverables, or groups of deliverables, have both of these characteristics, we treat each deliverable item as a separate element in the arrangement, allocate a portion of the allocable arrangement consideration using the relative selling price method to each element and apply the relevant revenue recognition guidance to each element. The allocation of revenue to individual elements requires judgment as, in many cases, we do not provide directly comparable services or products on a standalone basis.
Business combinations and goodwill: The purchase price of an acquired business is allocated to tangible assets and separately identifiable intangible assets acquired less liabilities assumed based upon their respective fair values. The excess balance is recorded as goodwill. Accounting for business combinations requires the use of judgment in determining the fair value of assets acquired and liabilities assumed in order to allocate the purchase price of entities acquired. Our estimates of these fair values are based upon assumptions we believe to be reasonable and, where appropriate, include assistance from third-party appraisal firms.
Goodwill is not amortized, but is subject to impairment testing on an annual basis, or more frequently if impairment indicators arise. Impairment testing is performed at the reporting unit level.
34
This process requires judgment in identifying our reporting units, appropriately allocating goodwill to these reporting units and assessing the fair value of these reporting units. At July 1, 2013, the Company performed the annual impairment test and determined that there had been no impairment of goodwill. In performing this assessment, the Company utilizes an income approach. Such an approach requires estimation of future operating cash flows including business growth, utilization of working capital and discount rates. The valuation of the business as a whole is compared to the Company's market capital at the date of the acquisition in order to verify the calculation. In all cases, we determined that the fair value of our reporting units was significantly in excess of our carrying value to the extent that a 25% decline in fair value in any reporting unit would not have resulted in an impairment charge.
Long-Lived Assets (Excluding Goodwill) The Company reviews long-lived assets for impairment whenever events or circumstances indicate that the carrying amount of an asset may not be fully recoverable. Our review is based on our projection of the undiscounted future operating cash flows of the related customer project. To the extent such projections indicate that future undiscounted cash flows are not sufficient to recover the carrying amount, we recognize a non-cash impairment charge to reduce the carrying amount to equal projected future discounted cash flows. No impairment charges were recorded in the three years ending September 30, 2013.
Contingencies. From time to time, we are involved in legal proceedings, including contract and employment claims, in the ordinary course of business. We assess the likelihood of any adverse judgments or outcomes to these contingencies, as well as potential ranges of probable losses and establish reserves accordingly. The amount of reserves required may change in future periods due to new developments in each matter or changes in approach to a matter such as a change in settlement strategy.
Income Taxes. The Company recognizes the financial statement benefit of a tax position only after determining that the relevant tax authority would "more likely than not" sustain the position following an audit. For tax positions meeting the "more likely than not" threshold, the amount recognized in the financial statements is the largest benefit that has a greater than fifty percent likelihood of being realized upon ultimate settlement with the relevant tax authority. The assumptions and estimates used in preparing these calculations may change over time and may result in adjustments that will affect our tax charge.
At September 30, 2013, the Company's overseas subsidiaries held approximately $145 million of cumulative earnings. We do not provide for U.S. income taxes on these undistributed earnings as we do not have the intention or the need to repatriate these funds. If we were to transfer these funds to the United States, the Company would be required to accrue and pay additional taxes. We have not attempted to quantify the charges that might arise if we were to make this transaction. The charges would vary based upon tax legislation in the United States and the other overseas jurisdictions as well as the manner and timing in which MAXIMUS would make these transactions. The amount of taxes that may be applicable on earnings planned to be reinvested indefinitely outside the United States is not readily determinable given the various tax planning alternatives the Company could employ should it decide to repatriate these earnings.
35
ITEM 7A. Quantitative and Qualitative Disclosures About Market Risk.
We believe that our exposure to market risk related to the effect of changes in interest rates, commodity prices and other market risks with regard to instruments entered into for trading or for other purposes is immaterial.
The Company is exposed to foreign exchange fluctuations in the Australian Dollar, the Canadian Dollar, the British Pound and the Saudi Arabian Riyal. During the year ended September 30, 2013, the Company earned approximately 25% of revenues and operating income from foreign subsidiaries. At September 30, 2013, approximately 34% of the Company's assets are held by foreign subsidiaries. The Company mitigates its foreign exchange risks through maintaining sufficient capital within its foreign subsidiaries to support the short-term and long-term capital requirements of these businesses. The Company's foreign subsidiaries typically incur costs in the same currency as they earn revenues, thus limiting the Company's exposure to unexpected fluctuations. The operations of the U.S. business do not depend upon cash flows from foreign subsidiaries.
36
ITEM 8. Financial Statements and Supplementary Data.
The following consolidated financial statements and supplementary data are included as part of this Annual Report on Form 10-K:
37
REPORT OF INDEPENDENT REGISTERED PUBLIC ACCOUNTING FIRM
The Board of Directors and Shareholders of MAXIMUS, Inc.
We have audited the accompanying consolidated balance sheets of MAXIMUS, Inc. as of September 30, 2013 and 2012, and the related consolidated statements of operations, comprehensive income, shareholders' equity and cash flows for each of the three years in the period ended September 30, 2013. These financial statements are the responsibility of the Company's management. Our responsibility is to express an opinion on these financial statements based on our audits.
We conducted our audits in accordance with the standards of the Public Company Accounting Oversight Board (United States). Those standards require that we plan and perform the audit to obtain reasonable assurance about whether the financial statements are free of material misstatement. An audit includes examining, on a test basis, evidence supporting the amounts and disclosures in the financial statements. An audit also includes assessing the accounting principles used and significant estimates made by management, as well as evaluating the overall financial statement presentation. We believe that our audits provide a reasonable basis for our opinion.
In our opinion, the financial statements referred to above present fairly, in all material respects, the consolidated financial position of MAXIMUS, Inc. at September 30, 2013 and 2012, and the consolidated results of its operations and its cash flows for each of the three years in the period ended September 30, 2013, in conformity with U.S. generally accepted accounting principles.
We also have audited, in accordance with the standards of the Public Company Accounting Oversight Board (United States), MAXIMUS, Inc.'s internal control over financial reporting as of September 30, 2013, based on criteria established in Internal Control-Integrated Framework issued by the Committee of Sponsoring Organizations of the Treadway Commission (1992 framework) and our report dated November 18, 2013 expressed an unqualified opinion thereon.
| /s/Ernst & Young LLP |
McLean,
Virginia
November 18, 2013
38
MAXIMUS, Inc.
CONSOLIDATED STATEMENTS OF OPERATIONS
(Amounts in thousands, except per share data)
| |
Year ended September 30, | |||||||||
|---|---|---|---|---|---|---|---|---|---|---|
| |
2013 | 2012 | 2011 | |||||||
Revenue |
$ | 1,331,279 | $ | 1,050,145 | $ | 929,633 | ||||
Cost of revenue |
945,246 | 762,202 | 675,982 | |||||||
Gross profit |
386,033 | 287,943 | 253,651 | |||||||
Selling, general and administrative expenses |
197,859 | 157,402 | 132,058 | |||||||
Acquisition-related expenses |
2,168 | 2,876 | — | |||||||
Legal and settlement expense (recovery), net |
(202 | ) | 90 | (808 | ) | |||||
Operating income from continuing operations |
186,208 | 127,575 | 122,401 | |||||||
Interest and other income, net |
2,851 | 4,176 | 3,495 | |||||||
Income from continuing operations before income taxes |
189,059 | 131,751 | 125,896 | |||||||
Provision for income taxes |
71,934 | 55,652 | 43,754 | |||||||
Income from continuing operations |
117,125 | 76,099 | 82,142 | |||||||
Discontinued operations, net of income taxes: |
||||||||||
Loss from discontinued operations |
(635 | ) | — | (133 | ) | |||||
Gain (loss) on disposal |
241 | 34 | (841 | ) | ||||||
Income (loss) from discontinued operations |
(394 | ) | 34 | (974 | ) | |||||
Net income |
$ | 116,731 | $ | 76,133 | $ | 81,168 | ||||
Basic earnings per share: |
||||||||||
Income from continuing operations |
$ | 1.72 | $ | 1.12 | $ | 1.19 | ||||
Income (loss) from discontinued operations |
(0.01 | ) | — | (0.01 | ) | |||||
Basic earnings per share |
$ | 1.71 | $ | 1.12 | $ | 1.18 | ||||
Diluted earnings per share: |
||||||||||
Income from continuing operations |
$ | 1.68 | $ | 1.09 | $ | 1.16 | ||||
Income (loss) from discontinued operations |
(0.01 | ) | — | (0.02 | ) | |||||
Diluted earnings per share |
$ | 1.67 | $ | 1.09 | $ | 1.14 | ||||
Dividends per share |
$ | 0.18 | $ | 0.18 | $ | 0.15 | ||||
Weighted average shares outstanding: |
||||||||||
Basic |
68,165 | 67,734 | 68,834 | |||||||
Diluted |
69,893 | 69,611 | 71,062 | |||||||
See accompanying notes to consolidated financial statements.
39
MAXIMUS, Inc.
CONSOLIDATED STATEMENTS OF COMPREHENSIVE INCOME
(Amounts in thousands)
| |
Year ended September 30, | |||||||||
|---|---|---|---|---|---|---|---|---|---|---|
| |
2013 | 2012 | 2011 | |||||||
Net income |
$ | 116,731 | $ | 76,133 | $ | 81,168 | ||||
Foreign currency translation adjustments |
(12,253 | ) | 7,760 | (2,050 | ) | |||||
Comprehensive income |
$ | 104,478 | $ | 83,893 | $ | 79,118 | ||||
See accompanying notes to consolidated financial statements.
40
MAXIMUS, Inc.
CONSOLIDATED BALANCE SHEETS
(Amounts in thousands)
| |
September 30, | ||||||
|---|---|---|---|---|---|---|---|
| |
2013 | 2012 | |||||
ASSETS |
|||||||
Current assets: |
|||||||
Cash and cash equivalents |
$ | 125,617 | $ | 189,312 | |||
Restricted cash |
12,176 | 11,593 | |||||
Accounts receivable—billed, net |
272,636 | 172,705 | |||||
Accounts receivable—unbilled |
20,320 | 10,539 | |||||
Prepaid income taxes |
358 | 3,800 | |||||
Deferred income taxes |
26,443 | 22,207 | |||||
Prepaid expenses and other current assets |
32,049 | 33,061 | |||||
Total current assets |
489,599 | 443,217 | |||||
Property and equipment, net |
77,710 | 58,798 | |||||
Capitalized software, net |
40,456 | 27,390 | |||||
Goodwill |
171,867 | 112,032 | |||||
Intangible assets, net |
42,039 | 25,330 | |||||
Deferred contract costs, net |
14,318 | 9,284 | |||||
Deferred income taxes |
1,179 | 1,369 | |||||
Deferred compensation plan assets |
10,314 | 9,220 | |||||
Other assets |
10,496 | 8,653 | |||||
Total assets |
$ | 857,978 | $ | 695,293 | |||
LIABILITIES AND SHAREHOLDERS' EQUITY |
|||||||
Current liabilities: |
|||||||
Accounts payable and accrued liabilities |
$ | 109,020 | $ | 73,128 | |||
Accrued compensation and benefits |
83,280 | 56,105 | |||||
Deferred revenue |
53,137 | 45,501 | |||||
Current portion of long-term debt |
170 | 178 | |||||
Income taxes payable |
8,327 | 3,100 | |||||
Other liabilities |
8,373 | 6,599 | |||||
Total current liabilities |
262,307 | 184,611 | |||||
Deferred revenue, less current portion |
32,953 | 34,075 | |||||
Long-term debt |
1,319 | 1,558 | |||||
Acquisition-related contingent consideration, less current portion |
388 | 406 | |||||
Income taxes payable, less current portion |
1,191 | 1,412 | |||||
Deferred income taxes |
16,359 | 10,384 | |||||
Deferred compensation plan liabilities, less current portion |
13,953 | 11,741 | |||||
Total liabilities |
328,470 | 244,187 | |||||
Commitments and contingencies |
|||||||
Shareholders' equity: |
|||||||
Common stock, no par value; 100,000 shares authorized; 68,525 and 67,971 shares issued and outstanding at September 30, 2013 and 2012, at stated amount, respectively |
415,271 | 395,967 | |||||
Accumulated other comprehensive income |
7,987 | 20,240 | |||||
Retained earnings |
106,250 | 34,899 | |||||
Total shareholders' equity |
529,508 | 451,106 | |||||
Total liabilities and shareholders' equity |
$ | 857,978 | $ | 695,293 | |||
See accompanying notes to consolidated financial statements.
41
MAXIMUS, Inc.
CONSOLIDATED STATEMENTS OF CASH FLOWS
(Amounts in thousands)
| |
Year ended September 30, | |||||||||
|---|---|---|---|---|---|---|---|---|---|---|
| |
2013 | 2012 | 2011 | |||||||
Cash flows from operating activities: |
||||||||||
Net income |
$ | 116,731 | $ | 76,133 | $ | 81,168 | ||||
Adjustments to reconcile net income to net cash provided by operating activities: |
||||||||||
(Income) loss from discontinued operations |
394 | (34 | ) | 974 | ||||||
Depreciation and amortization |
35,816 | 26,460 | 22,845 | |||||||
Deferred income taxes |
2,396 | (3,274 | ) | 1,758 | ||||||
Stock compensation expense |
14,555 | 12,077 | 9,485 | |||||||
Changes in assets and liabilities, net of effects of business combinations and divestitures: |
||||||||||
Accounts receivable—billed |
(93,092 | ) | (7,213 | ) | (11,584 | ) | ||||
Accounts receivable—unbilled |
(9,905 | ) | 2,214 | 10,068 | ||||||
Prepaid expenses and other current assets |
(2,492 | ) | (6,018 | ) | (2,573 | ) | ||||
Deferred contract costs |
(5,073 | ) | (1,221 | ) | (1,309 | ) | ||||
Accounts payable and accrued liabilities |
31,678 | 6,485 | 7,312 | |||||||
Accrued compensation and benefits |
21,308 | (2,648 | ) | 4,490 | ||||||
Deferred revenue |
6,304 | 9,827 | (11,779 | ) | ||||||
Income taxes |
2,034 | 6,885 | (10,814 | ) | ||||||
Other assets and liabilities |
903 | (4,513 | ) | (2,456 | ) | |||||
Cash provided by operating activities—continuing operations |
121,557 | 115,160 | 97,585 | |||||||
Cash used in operating activities—discontinued operations |
(619 | ) | — | (725 | ) | |||||
Cash provided by operating activities |
120,938 | 115,160 | 96,860 | |||||||
Cash flows from investing activities: |
||||||||||
Acquisition of businesses, net of cash acquired |
(71,435 | ) | (66,003 | ) | — | |||||
Proceeds from settlement of final PSI price |
3,380 | — | — | |||||||
Purchases of property and equipment |
(43,580 | ) | (18,369 | ) | (18,506 | ) | ||||
Capitalized software costs |
(18,596 | ) | (4,779 | ) | (7,608 | ) | ||||
Proceeds from note receivable |
398 | 299 | 237 | |||||||
Proceeds from sale of discontinued operations |
— | 2,240 | — | |||||||
Cash used in investing activities—continuing operations |
(129,833 | ) | (86,612 | ) | (25,877 | ) | ||||
Cash used in investing activities—discontinued operations |
— | — | — | |||||||
Cash used in investing activities |
(129,833 | ) | (86,612 | ) | (25,877 | ) | ||||
Cash flows from financing activities: |
||||||||||
Cash dividends paid |
(12,272 | ) | (12,180 | ) | (10,327 | ) | ||||
Repurchases of common stock |
(33,287 | ) | (12,977 | ) | (56,540 | ) | ||||
Stock compensation tax benefit |
10,569 | 7,268 | 6,996 | |||||||
Tax withholding related to RSU vesting |
(8,868 | ) | (4,464 | ) | (3,516 | ) | ||||
Stock option exercises |
2,168 | 6,441 | 12,496 | |||||||
Issuance of long-term debt |
— | — | 304 | |||||||
Repayment of long-term debt |
(172 | ) | (44 | ) | — | |||||
Acquisition-related contingent consideration |
— | (1,809 | ) | (1,021 | ) | |||||
Cash used in financing activities |
(41,862 | ) | (17,765 | ) | (51,608 | ) | ||||
Effect of exchange rate changes on cash |
(12,938 | ) | 5,579 | (1,746 | ) | |||||
Net increase (decrease) in cash and cash equivalents |
(63,695 | ) | 16,362 | 17,629 | ||||||
Cash and cash equivalents, beginning of period |
189,312 | 172,950 | 155,321 | |||||||
Cash and cash equivalents, end of period |
$ | 125,617 | $ | 189,312 | $ | 172,950 | ||||
See accompanying notes to consolidated financial statements.
42
MAXIMUS, Inc.
CONSOLIDATED STATEMENTS OF CHANGES IN SHAREHOLDERS' EQUITY
(Amounts in thousands)
| |
Common Shares Outstanding |
Common Stock |
Accumulated Other Comprehensive Income |
Retained Earnings |
Total Shareholders' Equity |
|||||||||||
|---|---|---|---|---|---|---|---|---|---|---|---|---|---|---|---|---|
Balance at September 30, 2010 |
68,697 | $ | 352,696 | $ | 14,530 | $ | (28,437 | ) | $ | 338,789 | ||||||
Net income |
— | — | — | 81,168 | 81,168 | |||||||||||
Foreign currency translation |
— | — | (2,050 | ) | — | (2,050 | ) | |||||||||
Cash dividends |
— | — | — | (10,327 | ) | (10,327 | ) | |||||||||
Dividends on RSUs |
— | 522 | — | (522 | ) | — | ||||||||||
Repurchases of common stock |
(3,194 | ) | — | — | (57,484 | ) | (57,484 | ) | ||||||||
Stock compensation expense |
— | 9,485 | — | — | 9,485 | |||||||||||
Stock compensation tax benefit |
— | 6,996 | — | — | 6,996 | |||||||||||
Tax withholding related to RSU vesting |
— | (4,616 | ) | — | — | (4,616 | ) | |||||||||
Stock option exercises and RSU releases |
2,084 | 12,496 | — | — | 12,496 | |||||||||||
Balance at September 30, 2011 |
67,587 | 377,579 | 12,480 | (15,602 | ) | 374,457 | ||||||||||
Net income |
— | — | — | 76,133 | 76,133 | |||||||||||
Foreign currency translation |
— | — | 7,760 | — | 7,760 | |||||||||||
Cash dividends |
— | — | — | (12,180 | ) | (12,180 | ) | |||||||||
Dividends on RSUs |
— | 656 | — | (656 | ) | — | ||||||||||
Repurchases of common stock |
(612 | ) | — | — | (12,796 | ) | (12,796 | ) | ||||||||
Stock compensation expense |
— | 12,077 | — | — | 12,077 | |||||||||||
Stock compensation tax benefit |
— | 7,268 | — | — | 7,268 | |||||||||||
Tax withholding relating to RSU vesting |
— | (8,054 | ) | — | — | (8,054 | ) | |||||||||
Stock option exercises and RSU releases |
996 | 6,441 | — | — | 6,441 | |||||||||||
Balance at September 30, 2012 |
67,971 | 395,967 | 20,240 | 34,899 | 451,106 | |||||||||||
Net income |
— | — | — | 116,731 | 116,731 | |||||||||||
Foreign currency translation |
— | — | (12,253 | ) | — | (12,253 | ) | |||||||||
Cash dividends |
— | — | — | (12,272 | ) | (12,272 | ) | |||||||||
Dividends on RSUs |
— | 583 | — | (583 | ) | — | ||||||||||
Repurchases of common stock |
(974 | ) | — | — | (32,525 | ) | (32,525 | ) | ||||||||
Stock compensation expense |
— | 14,555 | — | — | 14,555 | |||||||||||
Stock compensation tax benefit |
— | 10,569 | — | — | 10,569 | |||||||||||
Common stock issued pursuant to acquisition of HML |
203 | 6,425 | — | — | 6,425 | |||||||||||
Tax withholding related to RSU vesting |
— | (14,996 | ) | — | — | (14,996 | ) | |||||||||
Stock option exercises and RSU releases |
1,325 | 2,168 | — | — | 2,168 | |||||||||||
Balance at September 30, 2013 |
68,525 | $ | 415,271 | $ | 7,987 | $ | 106,250 | $ | 529,508 | |||||||
See accompanying notes to consolidated financial statements.
43
MAXIMUS, Inc.
Notes to Consolidated Financial Statements
For the years ended September 30, 2013, 2012 and 2011
1. Business and summary of significant accounting policies
(a) Description of business
MAXIMUS, Inc. (the "Company" or "we") provides business process services (BPS) to government health and human services agencies in the United States and to foreign governments. The Company conducts its operations through two business segments: Health Services and Human Services. The Health Services Segment provides a variety of business process services for state, provincial and federal programs, such as ACA, Medicaid, CHIP, Medicare and the Health Insurance British Columbia Program. The Human Services Segment provides a variety of administrative support and case management services for federal, national, state and county human services agencies including welfare-to-work programs, child support, higher education services and K-12 special education services.
Other than disclosed in Note 20, the notes to the consolidated financial statements reflect operating results from continuing operations.
(b) Principles of consolidation
The consolidated financial statements include the accounts of MAXIMUS, Inc. and its wholly-owned subsidiaries. All intercompany balances and transactions have been eliminated in consolidation.
(c) Use of estimates
The preparation of financial statements in conformity with accounting principles generally accepted in the United States requires management to make estimates and assumptions that affect the reported amounts of assets and liabilities, the disclosure of contingent assets and liabilities, and the reported amounts of revenue and expenses during the reporting period. Actual results could differ from those estimates. Significant estimates used by the Company include estimates of profits or loss on contracts in process, estimates of collectability of receivables, evaluation of asset impairment, accrual of estimated liabilities, and valuation of acquisition-related contingent consideration liabilities.
(d) Stock split
On April 16, 2013, the Company's Board of Directors declared a two-for-one stock split in the form of a dividend of one share for each outstanding share for shareholders of record on June 14, 2013. The additional shares were distributed on June 28, 2013. This stock-split did not affect the proportionate interests that stockholders maintained in the Company. All common stock and per share amounts throughout this document have been adjusted for the stock split.
(e) Revenue recognition
Revenue is generated from contracts with various pricing arrangements, including:
44
MAXIMUS, Inc.
Notes to Consolidated Financial Statements (Continued)
For the years ended September 30, 2013, 2012 and 2011
1. Business and summary of significant accounting policies (Continued)
We recognize revenue on arrangements as work is performed and amounts are earned. We consider amounts to be earned once evidence of an arrangement has been obtained, services have been delivered, fees are fixed or determinable and collectability of revenue is reasonably assured.
We recognize revenue on performance-based contracts when earned, which generally occurs when amounts are billable to customers. This may result in revenue being recognized in irregular increments.
Revenue on cost-plus contracts is recognized based on costs incurred plus an estimate of the negotiated fee earned.
We recognize revenue on fixed-priced contracts when earned, as services are provided. Revenue is generally recognized on a straight-line basis unless evidence suggests that revenue is earned or obligations are fulfilled in a different pattern. The timing of expense recognition may result in irregular profit margins.
For certain fixed-price contracts, primarily systems design, development and implementation, we generally recognize revenue based upon costs incurred to date and our anticipated gross profit. The cumulative impact of any revisions in estimated revenue and costs is recognized in the period in which the facts that give rise to the revision become known. Provisions for estimated losses on incomplete contracts are provided for in full in the period in which such losses become known. This policy may result in revenues being recognized at different points from amounts being billable. Where the Company enters into contracts where significant uncertainty exists over the ability of management to estimate the future costs, the Company will typically defer all revenue until such time as future costs are estimable or the system implementation is complete.
Revenue on time and materials contracts is recognized based on hours worked and expenses incurred.
Where contracts have multiple deliverables, we evaluate these deliverables at the inception of each contract and as each item is delivered. As part of this evaluation, we consider whether a delivered item has value to a customer on a stand-alone basis and whether the delivery of the undelivered items is considered probable and substantially within our control, if a general right of return exists. Where deliverables, or groups of deliverables, have both of these characteristics, we treat each deliverable item as a separate element in the arrangement, allocate a portion of the allocable arrangement consideration using the relative selling price method to each element and apply the relevant revenue recognition guidance to each element.
Sales and purchases in jurisdictions subject to indirect taxes, such as value added tax, are recorded net of tax collected and paid.
(f) Cash and cash equivalents
The Company considers all highly liquid investments with an original maturity of three months or less when purchased to be cash equivalents. Where the Company is obliged to hold cash balances as collateral for lease, credit card or letter of credit arrangements, or where MAXIMUS holds funds on behalf of clients, this balance is not considered to be cash and cash equivalents but is reported as restricted cash.
45
MAXIMUS, Inc.
Notes to Consolidated Financial Statements (Continued)
For the years ended September 30, 2013, 2012 and 2011
1. Business and summary of significant accounting policies (Continued)
(g) Accounts receivable and allowance for doubtful accounts
Accounts receivable are recorded at their face amount less an allowance for doubtful accounts. We maintain an allowance for doubtful accounts at an amount we estimate to be sufficient to cover the risk of collecting less than full payment on our receivables. On a regular basis, we re-evaluate our client receivables, especially receivables that are past due, and reassess our allowance for doubtful accounts based on specific client collection issues.
(h) Business combinations and goodwill
The purchase price of an acquired business is allocated to tangible assets and separately identifiable intangible assets acquired less liabilities assumed based upon their respective fair values. The excess balance is recorded as goodwill. Costs incurred directly related to an acquisition, including legal, accounting and valuation services, are expensed as incurred.
The separately identifiable intangible assets are amortized over useful lives estimated at the time of the business combination.
Goodwill is not amortized but is subject to impairment testing on an annual basis, or more frequently if impairment indicators arise. Impairment testing is performed at the reporting unit level. A reporting unit is the operating segment, or a business one level below that operating segment (the component level) if discrete financial information is prepared and reviewed regularly by segment management. However, components are aggregated if they have similar economic characteristics. The evaluation is performed by comparing the fair value of the relevant reporting unit to the carrying value, including goodwill, of the reporting unit. If the fair value of the reporting unit exceeds the carrying value, no impairment loss is recognized. However, if the carrying value of the reporting unit exceeds the fair value, the goodwill of the reporting unit may be impaired.
The Company performs its annual impairment test as of July 1 of each year. At July 1, 2013, the Company performed the annual impairment test and determined that there had been no impairment of goodwill. In performing this assessment, the Company utilizes an income approach. Such an approach requires estimation of future operating cash flows including business growth, utilization of working capital and discount rates. The valuation of the business as a whole is compared to the Company's market value at the date of the test in order to verify the calculation.
In 2011, the Financial Accounting Standards Board issued new accounting guidance that simplifies goodwill impairment tests. The new guidance states that a "qualitative" assessment may be performed to determine whether further impairment testing is necessary. We have adopted this accounting standard during this current fiscal year but we have not changed our methodology in performing our goodwill impairment test.
(i) Long-lived assets (excluding goodwill)
Property and equipment is recorded at cost. Depreciation is recorded over the assets' respective useful economic lives, which are not to exceed 39.5 years for the Company's buildings and seven years for office furniture and equipment. Leasehold improvements are amortized over the shorter of their useful life or the remaining term of the lease. Repairs and maintenance costs are expensed as incurred.
46
MAXIMUS, Inc.
Notes to Consolidated Financial Statements (Continued)
For the years ended September 30, 2013, 2012 and 2011
1. Business and summary of significant accounting policies (Continued)
All of the Company's capitalized software represents development costs for software that is intended for the Company's internal use. Direct costs of time and material incurred for the development of application software for internal use are capitalized and amortized using the straight-line method over the estimated useful life of the software, ranging from three to eight years. Costs incurred for upgrades and enhancements that do not result in additional functionality are expensed as incurred.
Deferred contract costs consist of contractually recoverable direct set-up costs relating to long-term service contracts. These costs include direct and incremental costs incurred prior to the commencement of us providing service to enable us to provide the contracted services to our customer. Such costs are expensed over the period services are provided.
The Company reviews long-lived assets for impairment whenever events or circumstances indicate that the carrying amount of an asset may not be fully recoverable. Our review is based on our projection of the undiscounted future operating cash flows of the related customer project. To the extent such projections indicate that future undiscounted cash flows are not sufficient to recover the carrying amount, we recognize a non-cash impairment charge to reduce the carrying amount to equal projected future discounted cash flows. No impairment charges were recorded in the three years ending September 30, 2013.
(j) Legal and settlement expense (recovery), net
Legal and settlement expense (recovery), net consists of costs, net of reimbursed insurance claims, related to significant legal settlements and non-routine legal matters, including future probable legal costs estimated to be incurred in connection with those matters. Legal expenses incurred in the ordinary course of business are included in selling, general and administrative expense.
(k) Income taxes
Deferred tax liabilities and assets are determined based on the difference between the financial statement and tax basis of assets and liabilities and are measured by applying enacted tax rates and laws for the taxable years in which those differences are expected to reverse. In addition, a valuation allowance is recorded if it is believed more likely than not that a deferred tax asset will not be fully realized.
The Company recognizes the financial statement benefit of a tax position only after determining that the relevant tax authority would "more likely than not" sustain the position following an audit. For tax positions meeting the "more likely than not" threshold, the amount recognized in the financial statements is the largest benefit which has a greater than fifty percent likelihood of being realized upon ultimate settlement with the relevant tax authority.
47
MAXIMUS, Inc.
Notes to Consolidated Financial Statements (Continued)
For the years ended September 30, 2013, 2012 and 2011
1. Business and summary of significant accounting policies (Continued)
(l) Foreign currency
For all foreign operations, the functional currency is the local currency. The assets and liabilities of foreign operations are translated into U.S. dollars at period-end exchange rates, and revenue and expenses are translated at average exchange rates for the year. The resulting cumulative translation adjustment is included in accumulated other comprehensive income on the consolidated balance sheet. Gains and losses from foreign currency transactions are included in interest and other income and are typically immaterial.
(m) Contingencies
From time to time, we are involved in legal proceedings, including contract and employment claims, in the ordinary course of business. We assess the likelihood of any adverse judgments or outcomes to these contingencies, as well as potential ranges of probable losses and establish reserves accordingly. The amount of reserves required may change in future periods due to new developments in each matter or changes in approach to a matter such as a change in settlement strategy.
(n) Reclassifications
Certain financial results have been reclassified to conform to the current year presentation.
The Company corrected an immaterial balance sheet classification error in the accounting for the repurchase of common stock, which resulted in the reduction of the previously reported amounts of treasury stock and retained earnings by $429.6 million at September 30, 2012.
The Company corrected an immaterial balance sheet classification error in the accounting for deferred revenue and costs of underlying associated contracts, which resulted in a reclassification of approximately $14.5 million from current deferred revenue to long-term deferred revenue and $5.5 million of prepayments to other long-term assets as of September 30, 2012.
48
MAXIMUS, Inc.
Notes to Consolidated Financial Statements (Continued)
For the years ended September 30, 2013, 2012 and 2011
2. Business segments
The Company is organized and managed based upon the services it provides. We operate in two business segments, Health Services and Human Services. The results of these segments for the three years ended September 30, 2013 are shown below (in thousands):
| |
Year ended September 30, | |||||||||
|---|---|---|---|---|---|---|---|---|---|---|
| |
2013 | 2012 | 2011 | |||||||
Revenue: |
||||||||||
Health Services |
$ | 862,879 | $ | 671,181 | $ | 565,881 | ||||
Human Services |
468,400 | 378,964 | 363,752 | |||||||
Total |
$ | 1,331,279 | $ | 1,050,145 | $ | 929,633 | ||||
Gross Profit: |
||||||||||
Health services |
$ | 248,100 | $ | 172,456 | $ | 147,239 | ||||
Human Services |
137,933 | 115,487 | 106,412 | |||||||
Total |
$ | 386,033 | $ | 287,943 | $ | 253,651 | ||||
Selling, general and administrative expense: |
||||||||||
Health Services |
$ | 118,266 | $ | 91,837 | $ | 72,524 | ||||
Human Services |
79,842 | 65,565 | 59,590 | |||||||
Corporate / Other |
(249 | ) | — | (56 | ) | |||||
Total |
$ | 197,859 | $ | 157,402 | $ | 132,058 | ||||
Operating income from continuing operations (before income taxes): |
||||||||||
Health Services |
$ | 129,834 | $ | 80,619 | $ | 74,715 | ||||
Human Services |
58,091 | 49,922 | 46,822 | |||||||
Corporate / Other |
249 | — | 56 | |||||||
Acquisition-related expenses and legal and settlement recovery (expense), net |
(1,966 | ) | (2,966 | ) | 808 | |||||
Total |
$ | 186,208 | $ | 127,575 | $ | 122,401 | ||||
Depreciation and amortization: |
||||||||||
Health Services |
$ | 17,438 | $ | 14,257 | $ | 12,120 | ||||
Human Services |
13,722 | 8,790 | 7,842 | |||||||
Corporate / Other |
4,656 | 3,413 | 2,883 | |||||||
Total |
$ | 35,816 | $ | 26,460 | $ | 22,845 | ||||
The Company operates primarily in the United States, Australia, Canada, the United Kingdom and Saudi Arabia.
49
MAXIMUS, Inc.
Notes to Consolidated Financial Statements (Continued)
For the years ended September 30, 2013, 2012 and 2011
2. Business segments (Continued)
Revenues for the Company were distributed as follows (in thousands):
| |
Year ended September 30, | |||||||||
|---|---|---|---|---|---|---|---|---|---|---|
| |
2013 | 2012 | 2011 | |||||||
United States |
$ | 999,419 | $ | 775,871 | $ | 630,812 | ||||
Australia |
157,383 | 163,482 | 176,814 | |||||||
Rest of World |
174,477 | 110,792 | 122,007 | |||||||
Total |
$ | 1,331,279 | $ | 1,050,145 | $ | 929,633 | ||||
Identifiable assets for the segments are shown below (in thousands):
| |
Year Ended September 30 |
||||||
|---|---|---|---|---|---|---|---|
| |
2013 | 2012 | |||||
Health Services |
$ | 518,914 | $ | 266,017 | |||
Human Services |
221,604 | 305,376 | |||||
Corporate / Other |
117,460 | 123,900 | |||||
Total |
$ | 857,978 | $ | 695,293 | |||
Total long-lived assets of the Company, consisting of property and equipment, capitalized software costs and deferred compensation plan assets, were distributed as follows (in thousands):
| |
Year Ended September 30 |
||||||
|---|---|---|---|---|---|---|---|
| |
2013 | 2012 | |||||
United States |
$ | 88,812 | $ | 56,188 | |||
Canada |
24,135 | 24,110 | |||||
Australia |
9,459 | 10,358 | |||||
Rest of World |
6,074 | 4,752 | |||||
Total |
$ | 128,480 | $ | 95,408 | |||
3. Earnings per share
All common stock amounts have been adjusted for the two-for-one stock split in June 2013.
50
MAXIMUS, Inc.
Notes to Consolidated Financial Statements (Continued)
For the years ended September 30, 2013, 2012 and 2011
3. Earnings per share (Continued)
The following table sets forth the components of basic and diluted earnings per share (in thousands):
| |
Year ended September 30, | |||||||||
|---|---|---|---|---|---|---|---|---|---|---|
| |
2013 | 2012 | 2011 | |||||||
Numerator: |
||||||||||
Income from continuing operations |
$ | 117,125 | $ | 76,099 | $ | 82,142 | ||||
Income (loss) from discontinued operations |
(394 | ) | 34 | (974 | ) | |||||
Net income |
$ | 116,731 | $ | 76,133 | $ | 81,168 | ||||
Denominator: |
||||||||||
Weighted average shares outstanding |
68,165 | 67,734 | 68,834 | |||||||
Effect of dilutive securities: |
||||||||||
Employee stock options and unvested restricted stock awards |
1,728 | 1,877 | 2,228 | |||||||
Denominator for diluted earnings per share |
69,893 | 69,611 | 71,062 | |||||||
Certain unvested restricted stock units have been excluded from the calculation of diluted earnings per share as the effect of including them would have been anti-dilutive. The number of such awards did not exceed 30,000 for any of the three years ended September 30, 2013.
4. Business combinations
Health Management Limited
On July 1, 2013 (the acquisition date), the Company acquired 100% of the share capital of Health Management Limited (HML) for total consideration of $77.9 million (£51.1 million). The consideration was comprised of $71.4 million (£46.9 million) in cash and 202,972 shares of MAXIMUS stock worth $6.4 million (£4.2 million). In addition, the Company incurred $1.2 million of expenses directly related to the transaction, including legal fees, due diligence expenses and duty related to the transfer of assets. These fees have been recorded as acquisition-related expenses.
HML provides independent health assessments within the United Kingdom. MAXIMUS acquired HML, among other reasons, to expand the Company's independent medical assessment business and to establish a strong presence in the United Kingdom health services market. The acquired assets and business have been integrated into the Company's Health Services Segment.
51
MAXIMUS, Inc.
Notes to Consolidated Financial Statements (Continued)
For the years ended September 30, 2013, 2012 and 2011
4. Business combinations (Continued)
The assets and liabilities of HML were recorded in the Company's financial statements at their fair values at the acquisition date as follows (in thousands):
| |
Preliminary Purchase Price Accounting |
|||
|---|---|---|---|---|
Cash consideration, net of cash acquired |
$ | 71,435 | ||
Stock consideration |
6,425 | |||
Purchase consideration, net of cash acquired |
$ | 77,860 | ||
Accounts receivable and unbilled receivables |
$ | 7,671 | ||
Other current assets |
1,382 | |||
Property and equipment |
2,752 | |||
Intangible assets |
20,542 | |||
Total identifiable assets acquired |
32,347 | |||
Accounts payable and other liabilities |
6,228 | |||
Deferred revenue |
1,149 | |||
Current income tax liability |
612 | |||
Deferred tax liability |
4,814 | |||
Total liabilities assumed |
12,803 | |||
Net identifiable assets acquired |
19,544 | |||
Goodwill |
58,316 | |||
Net assets acquired |
$ | 77,860 | ||
Management is still in the process of completing certain assessments of fair value of these assets and liabilities, including the assessment of the fair value of intangible assets acquired. The excess of the acquisition date fair value of consideration over the estimated fair value of the net assets acquired will be recorded as goodwill. The Company considers the goodwill to represent benefits that are expected to be realized as a result of the business combination, including, but not limited to, the assembled workforce and the benefit of the enhanced knowledge and capabilities of HML. Goodwill is not expected to be deductible for tax purposes.
The valuation of the intangible assets acquired is summarized below (in thousands).
| |
Useful life | Fair value | ||||
|---|---|---|---|---|---|---|
Customer relationships |
20 years | $ | 19,933 | |||
Technology-based intangible assets |
2 years | 609 | ||||
Total intangible assets |
$ | 20,542 | ||||
The weighted average amortization period is 19.5 years.
Our consolidated statement of operations includes $14.1 million of revenue and $0.5 million of income from continuing operations for the year ended September 30, 2013 generated by the acquired HML business.
52
MAXIMUS, Inc.
Notes to Consolidated Financial Statements (Continued)
For the years ended September 30, 2013, 2012 and 2011
4. Business combinations (Continued)
The following table presents certain results for the Company for the year ended September 30, 2013 as though the acquisition of HML had occurred on October 1, 2011. The unaudited pro forma information is presented for informational purposes only and is not necessarily indicative of the results of the Company if the acquisition had taken place at this time. The pro forma results presented include amortization charges for acquired intangible assets, adjustments to interest income foregone, the effect of calculating the fair value of acquired deferred revenue and related tax effects, as well as excluding the related acquisition expenses for fiscal year 2013 (in thousands).
| |
Unaudited pro forma results for the year ended September 30, |
||||||
|---|---|---|---|---|---|---|---|
| |
2013 | 2012 | |||||
Revenue |
$ | 1,368,399 | $ | 1,093,389 | |||
Income from continuing operations |
120,182 | 77,469 | |||||
Policy Studies, Inc.
On April 30, 2012 (the PSI acquisition date), the Company acquired 100% of the share capital of PSI Services Holding, Inc. and its wholly-owned subsidiary, Policy Studies, Inc. (PSI) for cash consideration of $63.4 million.
PSI supports government clients in the administration of a number of health and human services programs exclusively within the United States. MAXIMUS acquired PSI, among other reasons, to strengthen its leadership in the administration of public health and human services programs. The acquired assets and business have been integrated into the Company's Health Services and Human Services Segments.
53
MAXIMUS, Inc.
Notes to Consolidated Financial Statements (Continued)
For the years ended September 30, 2013, 2012 and 2011
4. Business combinations (Continued)
The assets and liabilities of PSI are recorded in the Company's financial statements at their fair values as of the PSI acquisition date. An initial valuation was performed at September 30, 2012 and this valuation has been updated through September 30, 2013 (below, in thousands):
| |
Purchase Price Allocation | |||||||||
|---|---|---|---|---|---|---|---|---|---|---|
| |
Updated through September 30, 2012 | Adjustments | Updated through September 30, 2013 | |||||||
Accounts receivable and unbilled receivables |
$ | 23,017 | $ | — | $ | 23,017 | ||||
Other current assets |
9,527 | — | 9,527 | |||||||
Deferred income taxes |
1,931 | 198 | 2,129 | |||||||
Property and equipment |
6,411 | — | 6,411 | |||||||
Other assets |
1,332 | — | 1,332 | |||||||
Intangible assets |
22,183 | — | 22,183 | |||||||
Total identifiable assets acquired |
64,401 | 198 | 64,599 | |||||||
Accounts payable and other liabilities |
20,666 | — | 20,666 | |||||||
Deferred revenue |
19,696 | 79 | 19,775 | |||||||
Total liabilities assumed |
40,362 | 79 | 40,441 | |||||||
Net identifiable assets acquired |
24,039 | 119 | 24,158 | |||||||
Goodwill |
39,161 | 129 | 39,290 | |||||||
Net assets acquired |
$ | 63,200 | $ | 248 | $ | 63,448 | ||||
The Company has completed its valuation of the assets and liabilities acquired. The identifiable assets acquired and liabilities assumed were recognized and measured as of the PSI acquisition date based upon their estimated fair values. The excess of the acquisition date fair value of the consideration over the estimated fair value of the net assets acquired was recorded as goodwill and allocated to the Company's two segments, Health Services and Human Services, based upon the respective valuations of the businesses. The Company considers the goodwill to represent a number of potential strategic and financial benefits that are expected to be realized as a result of the acquisition, including, but not limited to, the assembled workforce and the addition of new capabilities within MAXIMUS' existing business. Goodwill is not expected to be deductible for tax purposes.
DeltaWare Systems, Inc.
On February 10, 2010 (the DeltaWare acquisition date), the Company acquired 100% of the share capital of DeltaWare Systems, Inc. (DeltaWare).
As part of the acquisition agreement, the Company must pay the former owners of DeltaWare up to four million Canadian Dollars ($3.9 million). These payments, considered contingent consideration, will be made based upon the Company making sales of DeltaWare's products in particular geographic markets prior to December 2016. The Company has recorded a long-term liability of $0.4 million which represents the payment that management assesses will likely be paid. In the event that such sales are anticipated by the Company, this could result in an increase to this liability based upon the size and location of the sales. No such sales have been made to date and the likelihood of future sales between this time and December 2016 is considered low. Management reviews the likelihood of future sales on
54
MAXIMUS, Inc.
Notes to Consolidated Financial Statements (Continued)
For the years ended September 30, 2013, 2012 and 2011
4. Business combinations (Continued)
a quarterly basis and, to the extent that sales opportunities are identified, proposals submitted or contracts won, the Company updates its probability weighted assessment of payment. Changes in this assessment will result in an expense or credit to earnings. The contingent consideration payable for any single contract signed would be based upon the population of the area served but would be capped at one million Canadian Dollars per sale. As the inputs required for the valuation of this liability require significant judgment, they are considered to be Level 3 inputs under the Financial Accounting Standards Board's classification of assets and liabilities subject to fair value measurement.
The effect on the financial statements is summarized below (in thousands):
| |
Contingent consideration |
|||
|---|---|---|---|---|
Balance at September 30, 2012 |
$ | 406 | ||
Foreign currency translation |
(18 | ) | ||
Balance at September 30, 2013 |
$ | 388 | ||
5. Concentrations of credit risk and major customers
Financial instruments that potentially subject the Company to significant concentrations of credit risk consist primarily of accounts receivable, billed and unbilled.
The Company operates predominantly in the United States. Revenue from foreign-based projects and offices was 25%, 26% and 32% of total revenue for the years ended September 30, 2013, 2012 and 2011, respectively.
In the year ended September 30, 2013, approximately 56% of our total revenue was derived from state government agencies whose programs received significant federal funding, 24% from foreign government agencies, 12% from U.S.-based federal government agencies, and 8% from other sources including local municipalities and commercial customers. Management believes that the credit risk associated with its receivables is limited due to the credit worthiness of these customers.
During fiscal year 2013, the Company had three customers who each provided more than 10% of the Company's annual revenues: the State of Texas, the United States Federal Government and the Commonwealth of Australia. Revenue from Texas and the United States Federal Government was principally within the Health Services Segment. Revenue from Australia was exclusively within the Human Services Segment. The proportion of revenue recognized from customers providing in excess of 10% of the Company's consolidated revenues for each of the three years ended September 30, 2013 was as follows:
| |
Year ended September 30, | |||||||||
|---|---|---|---|---|---|---|---|---|---|---|
| |
2013 | 2012 | 2011 | |||||||
Texas |
14 | % | 18 | % | 16 | % | ||||
Commonwealth of Australia |
12 | % | 16 | % | 19 | % | ||||
United States Federal |
12 | % | * | 10 | % | |||||
California |
* | 10 | % | 11 | % | |||||
55
MAXIMUS, Inc.
Notes to Consolidated Financial Statements (Continued)
For the years ended September 30, 2013, 2012 and 2011
6. Accounts receivable reserve
Changes in the reserves against current billed accounts receivable were as follows (in thousands):
| |
Year ended September 30, | |||||||||
|---|---|---|---|---|---|---|---|---|---|---|
| |
2013 | 2012 | 2011 | |||||||
Balance at beginning of year |
$ | 3,975 | $ | 3,265 | $ | 1,845 | ||||
Additions to reserve |
2,334 | 2,061 | 3,063 | |||||||
Deductions |
(2,481 | ) | (1,351 | ) | (1,643 | ) | ||||
Balance at end of year |
$ | 3,828 | $ | 3,975 | $ | 3,265 | ||||
In evaluating the net realizable value of accounts receivable, the Company considers such factors as current economic trends, customer credit-worthiness, and changes in the customer payment terms and collection trends. Changes in the assumptions used in analyzing a specific account receivable may result in a reserve being recognized in the period in which the change occurs.
At September 30, 2013 and 2012, $8.3 million and $3.2 million of our billed receivables related to amounts pursuant to contractual retainage provisions. We anticipate that the majority of the fiscal 2013 balance will be collected during the 2014 fiscal year.
7. Goodwill and intangible assets
Changes in goodwill for the years ended September 30, 2013 and 2012 are as follows (in thousands):
| |
Health Services | Human Services | Total | |||||||
|---|---|---|---|---|---|---|---|---|---|---|
Balance as of September 30, 2011 |
$ | 43,242 | $ | 28,081 | $ | 71,323 | ||||
Goodwill acquired with PSI |
19,898 | 19,263 | 39,161 | |||||||
Foreign currency translation |
377 | 1,171 | 1,548 | |||||||
Balance as of September 30, 2012 |
63,517 | 48,515 | 112,032 | |||||||
Goodwill acquired with HML |
58,316 | — | 58,316 | |||||||
Adjustment to goodwill acquired with PSI |
65 | 64 | 129 | |||||||
Foreign currency translation |
3,198 | (1,808 | ) | 1,390 | ||||||
Balance as of September 30, 2013 |
$ | 125,096 | $ | 46,771 | $ | 171,867 | ||||
There have been no impairment charges in our goodwill related to continuing operations.
56
MAXIMUS, Inc.
Notes to Consolidated Financial Statements (Continued)
For the years ended September 30, 2013, 2012 and 2011
7. Goodwill and intangible assets (Continued)
The following table sets forth the components of intangible assets (in thousands):
| |
As of September 30, 2013 | As of September 30, 2012 | |||||||||||||||||
|---|---|---|---|---|---|---|---|---|---|---|---|---|---|---|---|---|---|---|---|
| |
Cost | Accumulated Amortization |
Intangible Assets, net |
Cost | Accumulated Amortization |
Intangible Assets, net |
|||||||||||||
Customer contracts and relationships |
$ | 39,243 | $ | 3,953 | $ | 35,290 | $ | 20,167 | $ | 3,082 | $ | 17,085 | |||||||
Technology-based intangible assets |
9,583 | 5,974 | 3,609 | 9,114 | 4,909 | 4,205 | |||||||||||||
Trademarks and trade names |
4,421 | 1,303 | 3,118 | 4,450 | 497 | 3,953 | |||||||||||||
Non-compete arrangements |
243 | 221 | 22 | 254 | 167 | 87 | |||||||||||||
Total |
$ | 53,490 | $ | 11,451 | $ | 42,039 | $ | 33,985 | $ | 8,655 | $ | 25,330 | |||||||
The intangible assets include $3.4 million of fully amortized technology-based assets still in use by the Company. The Company's intangible assets have a weighted average remaining life of 12.6 years, comprising 14.2 years for customer contracts and relationships, 4.1 years for technology-based intangible assets, 3.9 years for trademarks and trade names and 0.3 years for non-compete arrangements. Amortization expense for the years ended September 30, 2013, 2012 and 2011 was $4.9 million, $2.7 million and $2.2 million, respectively. Future amortization expense is estimated as follows (in thousands):
| |
Future amortization expense |
|||
|---|---|---|---|---|
Year ending September 30, 2014 |
$ | 5,322 | ||
Year ending September 30, 2015 |
5,165 | |||
Year ending September 30, 2016 |
4,865 | |||
Year ending September 30, 2017 |
4,466 | |||
Year ending September 30, 2018 |
3,768 | |||
8. Property and equipment
Property and equipment, at cost, consists of the following (in thousands):
| |
As of September 30, | ||||||
|---|---|---|---|---|---|---|---|
| |
2013 | 2012 | |||||
Land |
$ | 1,738 | $ | 1,800 | |||
Building and improvements |
11,661 | 11,588 | |||||
Office furniture and equipment |
149,796 | 107,859 | |||||
Leasehold improvements |
17,870 | 20,263 | |||||
|
181,065 | 141,510 | |||||
Less: Accumulated depreciation and amortization |
(103,355 | ) | (82,712 | ) | |||
Total property and equipment, net |
$ | 77,710 | $ | 58,798 | |||
57
MAXIMUS, Inc.
Notes to Consolidated Financial Statements (Continued)
For the years ended September 30, 2013, 2012 and 2011
8. Property and equipment (Continued)
Fixed asset depreciation expense for the years ended September 30, 2013, 2012 and 2011 was $26.3 million, $18.8 million and $15.1 million, respectively.
9. Capitalized software
Capitalized software consists of the following (in thousands):
| |
As of September 30, | ||||||
|---|---|---|---|---|---|---|---|
| |
2013 | 2012 | |||||
Capitalized software |
$ | 64,189 | $ | 46,767 | |||
Less: Accumulated amortization |
(23,733 | ) | (19,377 | ) | |||
Total Software development costs, net |
$ | 40,456 | $ | 27,390 | |||
Capitalized software amortization expense for the years ended September 30, 2013, 2012 and 2011 was $4.6 million, $4.9 million and $5.5 million, respectively.
10. Deferred contract costs
Deferred contract costs consist of contractually recoverable direct set-up costs relating to long-term service contracts in progress. These costs include direct and incremental costs incurred prior to the commencement of us providing contracted services to our customers. Deferred contract costs consist of the following (in thousands):
| |
As of September 30, | ||||||
|---|---|---|---|---|---|---|---|
| |
2013 | 2012 | |||||
Deferred contract costs |
$ | 23,623 | $ | 16,147 | |||
Less: accumulated amortization |
(9,305 | ) | (6,863 | ) | |||
Total deferred contract costs, net |
$ | 14,318 | $ | 9,284 | |||
11. Credit facilities
On March 15, 2013, the Company entered into an unsecured five-year revolving credit agreement (the "Credit Agreement"). The Credit Agreement amends and restates the Company's existing revolving credit agreement entered into in January 2008. The Credit Agreement provides for a revolving line of credit up to $100 million which may be used for revolving loans; swingline loans, subject to a sublimit of $5 million; and to request letters of credit, subject to a sublimit of $30 million. The line of credit is available for general corporate purposes, including working capital expenses, capital expenditures and acquisitions. The arrangement terminates on March 15, 2018, at which time all outstanding borrowings must be repaid.
At September 30, 2013, the Company's only borrowings under the Credit Agreement were five letters of credit totaling $15.4 million. Each of these letters of credit may be called by customers in the event that the Company defaults under the terms of a contract, the probability of which we believe is remote. In addition, two letters of credit totaling $3.0 million are held with another financial institution to cover similar obligations.
58
MAXIMUS, Inc.
Notes to Consolidated Financial Statements (Continued)
For the years ended September 30, 2013, 2012 and 2011
11. Credit facilities (Continued)
The Credit Agreement requires the Company to comply with certain financial covenants including a maximum total leverage ratio and a minimum fixed charge coverage ratio. The Company was in compliance with all covenants as of September 30, 2013. The obligations of the Company under the Credit Agreement are guaranteed by material domestic subsidiaries of the Company. The Credit Facility is currently unsecured. In the event that the Company's total leverage ratio exceeds 2.5:1.0 or the Company incurs a certain level of indebtedness outside of the Credit Agreement, the Credit Agreement will become secured by the assets of the Company and certain of its subsidiaries. At September 30, 2013, our total leverage ratio was less than 0.1:1.0.
The Credit Agreement provides for an annual commitment fee payable on funds not borrowed or utilized for letters of credit. This charge is based upon the Company's leverage and varies between 0.15% and 0.3%. Borrowings under the Credit Agreement bear interest at our choice at either (a) a Base Rate plus a margin that varies between 0.0% and 0.75% per year, (b) a Eurocurrency Rate plus an applicable margin that varies between 1.0% and 1.75% per year or (c) an Index Rate plus an applicable margin which varies between 1.0% and 1.75% per year. The Base Rate, Eurocurrency Rate and Index Rate are defined by the Credit Agreement and the applicable percentages are based upon the Company's leverage rate at the time of the borrowing. At September 30, 2013, the Company would utilize the lowest available applicable margins listed above.
In addition to this credit facility, the Company has a loan agreement with the Atlantic Innovation Fund of Canada. This provided a loan of 1.8 million Canadian Dollars, the proceeds of which were required to be used for specific technology-based research and development. The loan has no interest charge. At September 30, 2013, this balance was repayable in 35 remaining quarterly installments. At September 30, 2013, $1.5 million (1.5 million Canadian Dollars) was outstanding under this agreement.
Certain contracts require us to provide a surety bond as a guarantee of performance. At September 30, 2013 and 2012, the Company had performance bond commitments totaling $50.8 million and $48.0 million, respectively. These bonds are typically renewed annually and remain in place until the contractual obligations have been satisfied. Although the triggering events vary from contract to contract, in general we would only be liable for the amount of these guarantees in the event of default in our performance of our obligations under each contract, the probability of which we believe is remote.
12. Commitments and contingencies
Litigation
The Company is involved in various legal proceedings, including the matters described below, in the ordinary course of its business.
In March 2009, a state Medicaid agency asserted a claim against MAXIMUS, related to a discontinued business line, in the amount of $2.3 million in connection with a contract MAXIMUS had through February 1, 2009 to provide Medicaid administrative claiming services to school districts in the state. MAXIMUS entered into separate agreements with the school districts under which MAXIMUS helped the districts prepare and submit claims to the state Medicaid agency which, in turn, submitted claims for reimbursement to the United States Federal Government. No legal action has been initiated. The state has asserted that its agreement with MAXIMUS requires the Company to reimburse the
59
MAXIMUS, Inc.
Notes to Consolidated Financial Statements (Continued)
For the years ended September 30, 2013, 2012 and 2011
12. Commitments and contingencies (Continued)
state for the amounts owed to the Federal Government. However, the Company's agreements with the school districts require them to reimburse MAXIMUS for such payments and therefore MAXIMUS believes the school districts are responsible for any amounts disallowed by the state Medicaid agency or the Federal Government. Accordingly, the Company believes its exposure in this matter is limited to its fees associated with this work and that the school districts will be responsible for the remainder. MAXIMUS has exited the federal health care claiming business and no longer provides the services at issue in this matter.
In 2008, MAXIMUS sold the SchoolMAX student information system business line as part of the divestiture of the MAXIMUS Education Systems division. In 2012, a school district ("District") which was a SchoolMAX client filed a formal arbitration notice alleging that MAXIMUS and the buyer failed to (i) use best practices in developing the software and (ii) deliver and test product releases as required by the contract. The District contended that those failures resulted in damages of at least $10 million. In December 2012, the arbitration panel denied the District's claims in their entirety. Costs related to the arbitration proceeding have been included within discontinued operations. The District subsequently filed a motion to vacate the decision of the arbitration panel which was denied by the court in July 2013. The District has appealed that ruling. Separately, in late 2012, the District asserted that MAXIMUS had defrauded the District in 2007 or 2008 by misrepresenting its intentions regarding the sale of the Education Systems division. That allegation was not part of the arbitration, and no formal claim or lawsuit has been filed. The company believes it has a number of defenses to that allegation and would contest it vigorously if it were asserted.
Acquired loss-making contract
As part of the acquisition of PSI in April 2012, the Company acquired a systems-integration contract that was anticipated to record significant future losses. The fair value of the obligation to provide these services at a loss was calculated and recorded on the Company's balance sheet at acquisition as deferred revenue of $15.1 million.
The contract was an arrangement that included both significant production and customization of software as well as postcontract customer support for these services. As MAXIMUS was unable to estimate the costs of providing these services, management deferred all revenue and costs related until to service in anticipation of recognizing revenue at the commencement of the postcontract customer support services.
In February 2013, the Company received a formal notice of termination for convenience for this contract. The work was terminated as part of a broad, state-wide initiative to focus resources on a select number of projects. At the termination of this agreement, the Company reimbursed the client for certain funds received and undertook to provide services in consideration for the termination. All other obligations to provide services have been extinguished and no material future costs will be incurred. Accordingly, revenue of $16.0 million has been recognized in the year ended September 30, 2013. In addition, costs of $5.1 million, including costs which had been deferred, were recognized in the same period for an operating profit of $10.9 million.
60
MAXIMUS, Inc.
Notes to Consolidated Financial Statements (Continued)
For the years ended September 30, 2013, 2012 and 2011
12. Commitments and contingencies (Continued)
Flexible New Deal contract liabilities and contingent gains
In August 2009, the Company commenced work for the United Kingdom government as a provider of services under the "Flexible New Deal," a welfare-to-work initiative. The work was performed in the Company's Human Services segment. This initiative was terminated for all contract providers during fiscal year 2011 and replaced with the Work Programme, under which MAXIMUS also performs services. As a consequence of the termination of the Flexible New Deal, MAXIMUS incurred certain costs related to the termination of leases, including property leases for offices that are no longer occupied by the Company but for which the Company then retained responsibility for future lease payments. For properties which were exited, the Company recognized a liability for future lease rentals, service charges and property taxes for which it was liable, offset by anticipated future sublease rentals. The Company initially recorded a reserve of $0.5 million at September 30, 2011 to cover these liabilities, which reserve was fully utilized by September 30, 2012.
As part of the Flexible New Deal contract, MAXIMUS was entitled to reimbursement for costs incurred as a consequence of early termination, as well as a contract settlement for payments the Company would have received for realizing certain long-term goals under the contract. During the year ended September 30, 2012, MAXIMUS received a payment of $2.7 million for revenue foregone and $1.7 million of cost recoveries, net of subcontractor expenses.
Contracts
During the year ended September 30, 2012, the Company recorded a gain of $6.8 million on a fixed-price contract owing to changes in our estimate to complete the work. During the year ended September 30, 2011, the Company recorded a charge of $7.3 million on the same contract. The Company has no further liabilities relating to anticipated losses on this contract.
During the year ended September 30, 2012, the Company signed an amendment on a significant Health Services contract. As a consequence, the Company recognized additional revenue in the period of $10.2 million.
Employment agreements
Subsequent to September 30, 2013, the Company signed an employment agreement with its chief executive officer with a term ending in fiscal 2018.
Collective bargaining agreements
Approximately 12% of our employees are covered by collective bargaining agreements or similar arrangements.
61
MAXIMUS, Inc.
Notes to Consolidated Financial Statements (Continued)
For the years ended September 30, 2013, 2012 and 2011
13. Leases
The Company leases office space and equipment under various operating leases. Lease expense for the years ended September 30, 2013, 2012 and 2011 was $49.0 million, $37.6 million and $32.0 million respectively.
Minimum future payments under leases in effect as of September 30, 2013 are as follows (in thousands):
| |
Operating lease commitments | |||||||||
|---|---|---|---|---|---|---|---|---|---|---|
| |
Office space | Equipment | Total | |||||||
Year ended September 30, |
||||||||||
2014 |
$ | 50,573 | $ | 1,833 | $ | 52,406 | ||||
2015 |
41,736 | 1,242 | 42,978 | |||||||
2016 |
26,525 | 556 | 27,081 | |||||||
2017 |
21,508 | 335 | 21,843 | |||||||
2018 |
11,411 | 208 | 11,619 | |||||||
Thereafter |
16,031 | — | 16,031 | |||||||
Total minimum lease payments |
$ | 167,784 | $ | 4,174 | $ | 171,958 | ||||
14. Employee benefit plans and deferred compensation
The Company has 401(k) plans for the benefit of all employees who meet certain eligibility requirements. The plans provide for Company match, specified Company contributions, and discretionary Company contributions. During the years ended September 30, 2013, 2012 and 2011, the Company contributed $3.8 million, $3.0 million and $3.0 million to the 401(k) plans, respectively.
The Company also has a deferred compensation plan, which is a non-qualified plan available to a restricted number of highly compensated employees. The plan enables participants to defer compensation for tax purposes. These deferred employee contributions are held within a rabbi trust with investments directed by the respective employees. The assets of the rabbi trust are available to satisfy the claims of general creditors in the event of bankruptcy of the Company. The balance sheet at September 30, 2013 includes $1.5 million of cash and cash equivalents; an asset of $10.3 million related to life insurance assets, which are held at cash surrender value; and liabilities totaling $16.0 million.
15. Stock compensation
All common stock amounts have been adjusted for the two-for-one stock split in June 2013.
In March 2012, the Company's shareholders approved the 2011 Equity Incentive Plan which superseded the Company's 1997 Equity Incentive Plan. Under these plans, the Company is authorized to grant stock options, restricted stock units ("RSUs") and other forms of equity awards to officers, employees and directors of the Company. At September 30, 2013, 2.8 million shares remained available for grants under the Company's stock plans. The Company typically issues new shares in satisfying its obligations under its stock plans.
In recent years, the Company has granted equity awards to officers, employees and directors in the form of RSUs. Generally, RSUs issued before 2009 vest ratably over six years. RSUs issued since then
62
MAXIMUS, Inc.
Notes to Consolidated Financial Statements (Continued)
For the years ended September 30, 2013, 2012 and 2011
15. Stock compensation (Continued)
vest ratably over five years. The fair value of the RSUs, based on the Company's stock price at the grant date, is expensed in equal installments over the vesting period. For the fiscal years ended September 30, 2013, 2012 and 2011, compensation expense recognized related to RSUs was $14.6 million, $12.1 million and $9.4 million, respectively. Employees who are granted RSUs also receive dividend-equivalent payments in the form of additional RSUs. However, until the shares are issued, they have no voting rights and employees may not buy or sell these RSUs. In the event that an award is forfeited, the dividend-equivalent payments received by the holder with respect to that award are also forfeited.
A summary of the Company's RSU activity for the year ended September 30, 2013, is as follows:
| |
Shares | Weighted- Average Grant-Date Fair Value |
|||||
|---|---|---|---|---|---|---|---|
Non-vested shares outstanding at September 30, 2012 |
2,892,140 | $ | 13.86 | ||||
Granted |
566,249 | 30.66 | |||||
Vested |
(931,993 | ) | 14.46 | ||||
Forfeited |
(107,442 | ) | 15.88 | ||||
Non-vested shares outstanding at September 30, 2013 |
2,418,954 | 17.47 | |||||
The weighted-average grant-date fair value of RSUs granted in the years ended September 30, 2012 and 2011 was $21.00 and $15.90, respectively. The total fair value of RSUs vesting during the year was $40.8 million, $25.0 million and $14.5 million in the years ended September 30, 2013, 2012 and 2011, respectively. As of September 30, 2013, the total remaining unrecognized compensation cost related to unvested RSUs was $29.0 million. This charge is expected to be realized over 5 years, with a weighted average life of 1.6 years.
Prior to fiscal year 2008, the Company granted stock options to certain employees. These were granted at exercise prices equal to the fair market value of the Company's common stock at the date of grant, vested over a period of four years and expired ten years after the date of the grant. Compensation expenses related to stock options were immaterial for all three years ended September 30, 2013.
A summary of the Company's stock option activity for the year ended September 30, 2013, is as follows:
| |
Options | Weighted Average Exercise Price |
|||||
|---|---|---|---|---|---|---|---|
Outstanding at September 30, 2012 |
720,358 | $ | 8.26 | ||||
Exercised |
(288,742 | ) | 7.50 | ||||
Forfeited or expired |
(10,152 | ) | 5.54 | ||||
Outstanding and exercisable at September 30, 2013 |
421,464 | 8.85 | |||||
The intrinsic value of outstanding and exercisable stock options at September 30, 2013 was $15.3 million with a weighted average remaining life of 2.3 years.
63
MAXIMUS, Inc.
Notes to Consolidated Financial Statements (Continued)
For the years ended September 30, 2013, 2012 and 2011
15. Stock compensation (Continued)
The following table summarizes information pertaining to the stock options vested and exercised for the years presented (in thousands):
| |
Year ended September 30, | |||||||||
|---|---|---|---|---|---|---|---|---|---|---|
| |
2013 | 2012 | 2011 | |||||||
Aggregate intrinsic value of all stock options exercised |
$ | 7,081 | $ | 10,920 | $ | 15,102 | ||||
Net cash proceeds from exercise of stock options |
2,168 | 6,441 | 12,496 | |||||||
The total income tax benefit recognized in the income statement for share-based compensation arrangements was $5.2 million, $4.3 million and $3.7 million for the fiscal years ended September 30, 2013, 2012 and 2011, respectively.
Employees are permitted to forfeit a certain number of shares to cover their personal tax liability. Amounts paid to cover this liability by the Company were $8.9 million, $4.5 million and $3.5 million in the years ended September 30, 2013, 2012 and 2011.
Cash flows resulting from the tax benefits generated from tax deductions in excess of the compensation costs recognized for those options and RSUs (excess tax benefits) are classified as financing cash flows.
16. Stock repurchase programs
All common stock amounts have been adjusted for the two-for-one stock split in June 2013.
Under resolutions adopted in July 2008 and September 2010, the Board of Directors authorized the repurchase, at management's discretion, of up to an aggregate of $175.0 million of the Company's common stock. In November 2011, this plan was replaced with a new program which authorized up to $125.0 million of repurchases. The Board has also authorized the use of option exercise proceeds for the repurchase of the Company's common stock. During the years ended September 30, 2013, 2012 and 2011, the Company repurchased 974,498, 612,000 and 3,194,916 common shares at a cost of $32.5 million, $12.8 million and $57.5 million, respectively. At September 30, 2013, $97.1 million remained available for future stock repurchases.
17. Legal and settlement expense (recovery), net
Legal and settlement expense (recovery), net consists of costs, net of reimbursed insurance claims, related to significant legal settlements and non-routine legal matters, including future probable legal costs estimated to be incurred in connection with those matters. Legal expenses incurred in the
64
MAXIMUS, Inc.
Notes to Consolidated Financial Statements (Continued)
For the years ended September 30, 2013, 2012 and 2011
17. Legal and settlement expense (recovery), net (Continued)
ordinary course of business are included in selling, general and administrative expense. Expenses and recoveries for the three years ended September 30, 2013 are shown below (in thousands):
| |
Year ended September 30, | |||||||||
|---|---|---|---|---|---|---|---|---|---|---|
| |
2013 | 2012 | 2011 | |||||||
Insurance recoveries |
$ | (390 | ) | $ | (1,180 | ) | $ | — | ||
Employee lawsuit |
— | 600 | — | |||||||
Client indemnification |
— | 490 | — | |||||||
Other |
188 | 180 | (808 | ) | ||||||
Total |
$ | (202 | ) | $ | 90 | $ | (808 | ) | ||
During fiscal year 2012, the Company agreed to settle a lawsuit brought by a former employee for $0.6 million and agreed to pay $0.5 million relating to client indemnification of funds misappropriated by a former employee. During fiscal year 2013, the Company's insurance provider reimbursed the Company for part of the latter claim.
The insurance recovery in fiscal year 2012 relates to a litigation settlement in fiscal 2008.
During the 2011 fiscal year, the Company reversed a legal expense previously recognized in fiscal 2010 for a matter which concluded without liability to the Company.
18. Income taxes
The Company's components of income from continuing operations before income taxes and the corresponding provision for income taxes is as follows (in thousands):
| |
Year ended September 30, | |||||||||
|---|---|---|---|---|---|---|---|---|---|---|
| |
2013 | 2012 | 2011 | |||||||
Income from continuing operations before income taxes: |
||||||||||
United States |
$ | 140,371 | $ | 93,418 | $ | 66,842 | ||||
Foreign |
48,688 | 38,333 | 59,054 | |||||||
Income from continuing operations before income taxes |
$ | 189,059 | $ | 131,751 | $ | 125,896 | ||||
65
MAXIMUS, Inc.
Notes to Consolidated Financial Statements (Continued)
For the years ended September 30, 2013, 2012 and 2011
18. Income taxes (Continued)
| |
Year ended September 30, | |||||||||
|---|---|---|---|---|---|---|---|---|---|---|
| |
2013 | 2012 | 2011 | |||||||
Current provision: |
||||||||||
Federal |
$ | 43,460 | $ | 36,348 | $ | 20,090 | ||||
State and local |
11,257 | 9,006 | 4,484 | |||||||
Foreign |
14,821 | 13,572 | 17,422 | |||||||
Total current provision |
69,538 | 58,926 | 41,996 | |||||||
Deferred tax expense (benefit): |
||||||||||
Federal |
$ | 2,741 | $ | (1,272 | ) | $ | 1,572 | |||
State and local |
851 | (471 | ) | 397 | ||||||
Foreign |
(1,196 | ) | (1,531 | ) | (211 | ) | ||||
Total deferred tax expense (benefit) |
2,396 | (3,274 | ) | 1,758 | ||||||
Income tax expense |
$ | 71,934 | $ | 55,652 | $ | 43,754 | ||||
The provision for income taxes differs from that which would have resulted from the use of the federal statutory income tax rate as follows (in thousands):
| |
Year ended September 30, | |||||||||
|---|---|---|---|---|---|---|---|---|---|---|
| |
2013 | 2012 | 2011 | |||||||
Federal income tax provision at statutory rate of 35% |
$ | 66,171 | $ | 46,113 | $ | 44,063 | ||||
State income taxes, net of federal benefit |
8,183 | 5,558 | 3,175 | |||||||
Foreign taxation |
(3,499 | ) | (1,950 | ) | (3,644 | ) | ||||
Permanent items |
708 | 2,808 | 314 | |||||||
True up to prior year |
— | 2,715 | — | |||||||
Valuation allowances on net operating loss carryforwards |
— | 305 | (16 | ) | ||||||
Other |
371 | 103 | (138 | ) | ||||||
Income tax expense |
$ | 71,934 | $ | 55,652 | $ | 43,754 | ||||
During the year ended September 30, 2012, the Company recorded the correction of an error of $2.7 million. The Company does not believe this correction is material to its consolidated financial statements.
66
MAXIMUS, Inc.
Notes to Consolidated Financial Statements (Continued)
For the years ended September 30, 2013, 2012 and 2011
18. Income taxes (Continued)
The significant items comprising the Company's deferred tax assets and liabilities as of September 30, 2013 and 2012 are as follows (in thousands):
| |
As of September 30, | ||||||
|---|---|---|---|---|---|---|---|
| |
2013 | 2012 | |||||
Deferred tax assets—current: |
|||||||
Costs deductible in future periods |
$ | 21,186 | $ | 11,126 | |||
Deferred revenue |
10,930 | 14,543 | |||||
Net operating loss carryforwards |
— | 811 | |||||
Other |
544 | — | |||||
Total deferred tax assets—current |
32,660 | 26,480 | |||||
Deferred tax liabilities—current: |
|||||||
Accounts receivable—unbilled |
6,217 | 3,932 | |||||
Other |
— | 341 | |||||
Total deferred tax liabilities—current: |
6,217 | 4,273 | |||||
Net deferred tax asset—current |
$ | 26,443 | $ | 22,207 | |||
Deferred tax assets—non-current: |
|||||||
Net operating loss carryforwards |
$ | 4,080 | $ | 5,728 | |||
Valuation allowance on net operating loss carryforwards |
(968 | ) | (1,313 | ) | |||
Net operating loss carryforwards net of valuation reserve |
3,112 | 4,415 | |||||
Deferred revenue |
10,340 | 6,737 | |||||
Stock compensation |
4,601 | 4,176 | |||||
Costs deductible in future periods |
1,528 | 1,021 | |||||
Other |
5,360 | 3,055 | |||||
Total deferred tax assets—non-current |
24,941 | 19,404 | |||||
Deferred tax liabilities—non-current |
|||||||
Amortization of goodwill and intangible assets |
19,383 | 14,218 | |||||
Capitalized software |
9,045 | 4,701 | |||||
Property and equipment |
8,687 | 8,535 | |||||
Deferred contract costs |
2,059 | 452 | |||||
Other |
947 | 513 | |||||
Total deferred tax liability—non-current |
$ | 40,121 | $ | 28,419 | |||
Net deferred tax liability—non-current |
$ | 15,180 | $ | 9,015 | |||
67
MAXIMUS, Inc.
Notes to Consolidated Financial Statements (Continued)
For the years ended September 30, 2013, 2012 and 2011
18. Income taxes (Continued)
Due to deferred tax assets and liabilities in different tax jurisdictions, the net long-term assets and liabilities are reflected on the accompanying consolidated balance sheet as follows (in thousands):
| |
As of September 30, | ||||||
|---|---|---|---|---|---|---|---|
| |
2013 | 2012 | |||||
Long-term assets |
$ | 1,179 | $ | 1,369 | |||
Long-term liabilities |
16,359 | 10,384 | |||||
Net deferred tax liability—non-current |
$ | 15,180 | $ | 9,015 | |||
At September 30, 2013, the Company's overseas subsidiaries held approximately $144 million of cumulative earnings. We do not provide for U.S. income taxes on these undistributed earnings as we do not have the intention or the need to repatriate these funds. If we were to transfer these funds to the United States, the Company could be required to accrue and pay additional taxes. We have not attempted to quantify the charges which might arise if we were to make this transaction. The charges would vary based upon tax legislation in the United States and the other overseas jurisdictions as well as the manner and timing in which MAXIMUS would make these transactions. The amount of taxes that may be applicable on earnings planned to be reinvested indefinitely outside the United States is not readily determinable given the various tax planning alternatives the Company could employ should it decide to repatriate these earnings.
The Company had $6.9 million of net operating loss carryforwards in the United States at September 30, 2013, resulting in a deferred tax asset of $3.1 million. This balance relates exclusively to the losses held by PSI upon their acquisition in 2012. Although the ability of the Company to use these loss carryforwards will be restricted to an annual allowance, the Company has sufficient profits and time within the jurisdictions where losses have arisen to ensure that these losses will be utilized in full. Accordingly, no reserve has been recorded against these balances. These net operating loss carryforwards expire between 2027 and 2031.
The Company had $3.9 million of net operating loss carryforwards in Canada at September 30, 2013, compared with $5.0 million at September 30, 2012. This results in a deferred tax asset of $1.0 million and $1.2 million, respectively. A reserve of $1.0 million and $1.1 million was applied to these balances at September 30, 2013 and 2012, respectively. These net operating loss carryforwards expire through 2027 to 2031.
At September 30, 2012, the Company had $3.4 million of net operating loss carryforwards relating to its United Kingdom subsidiary, resulting in a current deferred tax asset of $0.8 million. No valuation reserve was recorded against this balance and it was utilized during the 2013 fiscal year.
At September 30, 2012, the Company had $1.2 million of net operating loss carryforwards relating to its Saudi Arabian subsidiary, resulting in a deferred tax asset of $0.2 million. This asset was fully reserved and was utilized during the 2013 fiscal year.
Cash paid for income taxes during the years ended September 30, 2013, 2012, and 2011 was $58.2 million, $44.3 million and $45.2 million, respectively.
68
MAXIMUS, Inc.
Notes to Consolidated Financial Statements (Continued)
For the years ended September 30, 2013, 2012 and 2011
18. Income taxes (Continued)
The Company accounts for uncertain tax positions by recognizing the financial statement effects of a tax position only when, based upon the technical merits, it is "more-likely-than-not" that the position will be sustained upon examination. The Company's net unrecognized tax benefits totaled $1.0 million, $1.1 million and $1.2 million at September 30, 2013, 2012 and 2011, respectively. The total amount of unrecognized tax benefits that, if recognized, would affect the annual effective income tax rate was $1.0 million at September 30, 2013.
The Company reports interest and penalties as a component of income tax expense. In the fiscal years ending September 30, 2013, 2012 and 2011, the Company recognized interest expense relating to unrecognized tax benefits of less than $0.1 million in each year. The net liability balance at September 30, 2013, 2012 and 2011 includes approximately $0.5 million, $0.4 million and $0.3 million, respectively, of interest and penalties.
The Company recognizes and presents uncertain tax positions on a gross basis (i.e., without regard to likely offsets for deferred tax assets, deductions and/or credits that would result from payment of uncertain tax amounts). The reconciliation of the beginning and ending amount of gross unrecognized tax benefits was as follows (in thousands):
| |
Year Ended September 30 | |||||||||
|---|---|---|---|---|---|---|---|---|---|---|
| |
2013 | 2012 | 2011 | |||||||
Balance at beginning of year |
$ | 1,059 | $ | 1,172 | $ | 1,553 | ||||
Lapse of statute of limitation |
(230 | ) | (113 | ) | (381 | ) | ||||
Reductions for tax positions of prior years |
(17 | ) | — | — | ||||||
Balance at end of year |
$ | 812 | $ | 1,059 | $ | 1,172 | ||||
The Company files income tax returns in the United States federal jurisdiction and in various state and foreign jurisdictions. The Company is no longer subject to federal income tax examinations for years before 2010 and is no longer subject to state, and local income tax examinations by tax authorities for years before 2008. In international jurisdictions, similar rules apply to filed income tax returns, although the tax examination limitations and requirements may vary. The Company is no longer subject to audit by tax authorities for overseas jurisdictions for years prior to 2006.
19. Quarterly information (unaudited)
Set forth below are selected quarterly income statement data for the fiscal years ended September 30, 2013 and 2012. The Company derived this information from unaudited quarterly financial statements that include, in the opinion of Company's management, all adjustments necessary for a fair presentation of the information for such periods. Results of operations for any fiscal quarter are not necessarily indicative of results for any future period.
Earnings per share amounts are computed independently each quarter. As a result, the sum of each quarter's earnings per share amount may not equal the total earnings per share amount for the respective year.
69
MAXIMUS, Inc.
Notes to Consolidated Financial Statements (Continued)
For the years ended September 30, 2013, 2012 and 2011
19. Quarterly information (unaudited) (Continued)
All per share amounts have been adjusted for the two-for-one stock split in June 2013.
| |
Quarter Ended | ||||||||||||
|---|---|---|---|---|---|---|---|---|---|---|---|---|---|
| |
Dec. 31, 2012 |
March 31, 2013 |
June 30, 2013 |
Sept. 30, 2013 |
|||||||||
| |
(In thousands, except per share data) |
||||||||||||
Revenue |
$ | 286,266 | $ | 326,351 | $ | 334,323 | $ | 384,339 | |||||
Gross profit |
76,530 | 97,444 | 94,560 | 117,499 | |||||||||
Net income |
21,316 | 31,689 | 28,100 | 35,626 | |||||||||
Basic earnings per share: |
|||||||||||||
Income from continuing operations |
$ | 0.32 | $ | 0.47 | $ | 0.41 | $ | 0.52 | |||||
Loss from discontinued operations |
(0.01 | ) | (0.01 | ) | — | — | |||||||
Basic earnings per share |
$ | 0.31 | $ | 0.46 | $ | 0.41 | $ | 0.52 | |||||
Diluted earnings per share: |
|||||||||||||
Income from continuing operations |
$ | 0.31 | $ | 0.45 | $ | 0.40 | $ | 0.51 | |||||
Loss from discontinued operations |
— | — | — | — | |||||||||
Diluted earnings per share |
$ | 0.31 | $ | 0.45 | $ | 0.40 | $ | 0.51 | |||||
| |
Quarter Ended | ||||||||||||
|---|---|---|---|---|---|---|---|---|---|---|---|---|---|
| |
Dec. 31, 2011 |
March 31, 2012 |
June 30, 2012 |
Sept. 30, 2012 |
|||||||||
| |
(In thousands, except per share data) |
||||||||||||
Revenue |
$ | 239,603 | $ | 243,452 | $ | 266,353 | $ | 300,737 | |||||
Gross profit |
59,847 | 64,766 | 78,701 | 84,629 | |||||||||
Net income |
17,704 | 14,273 | 20,485 | 23,671 | |||||||||
Basic earnings per share: |
|||||||||||||
Income from continuing operations |
$ | 0.26 | $ | 0.21 | $ | 0.30 | $ | 0.35 | |||||
Loss from discontinued operations |
— | — | — | — | |||||||||
Basic earnings per share |
$ | 0.26 | $ | 0.21 | $ | 0.30 | $ | 0.35 | |||||
Diluted earnings per share: |
|||||||||||||
Income from continuing operations |
$ | 0.26 | $ | 0.21 | $ | 0.29 | $ | 0.34 | |||||
Loss from discontinued operations |
— | — | — | — | |||||||||
Diluted earnings per share |
$ | 0.26 | $ | 0.21 | $ | 0.29 | $ | 0.34 | |||||
20. Discontinued operations
During the year ended September 30, 2013, the Company incurred costs in legal proceedings related to a discontinued operation. See "Note 12. Commitments and contingencies" for more details on this matter.
The Company continues to record gains on the sale of Unison MAXIMUS, Inc., a business which was sold in May 2008. The consideration for the sale included a promissory note which is fully reserved. Small payments continue to be received on this note but owing to uncertainties over the
70
MAXIMUS, Inc.
Notes to Consolidated Financial Statements (Continued)
For the years ended September 30, 2013, 2012 and 2011
20. Discontinued operations (Continued)
collectability of the full balance, the Company has only recorded a gain on sale where recovery is considered assured, which is typically when cash payments are received. The Company recorded gains on sale of $0.4 million, $0.1 million and $0.3 million for the years ended September 30, 2013, 2012 and 2011, respectively.
The Company's results in fiscal year 2011 include the effects of the sale of our ERP business, which took place during fiscal year 2010. During fiscal year 2011, the Company resolved a dispute with the buyer of the business and recorded a pre-tax loss of $1.7 million.
The following table summarizes the operating results of the discontinued operations included in the Consolidated Statements of Operations (in thousands):
| |
Year Ended September 30, | |||||||||
|---|---|---|---|---|---|---|---|---|---|---|
| |
2013 | 2012 | 2011 | |||||||
Loss from operations before income taxes |
$ | (1,053 | ) | $ | — | $ | (219 | ) | ||
Benefit from income taxes |
(418 | ) | — | (86 | ) | |||||
Loss from discontinued operations |
$ | (635 | ) | $ | — | $ | (133 | ) | ||
Gain (loss) on disposal before income taxes |
$ | 398 | $ | 57 | $ | (1,390 | ) | |||
Provision for (benefit from) income taxes |
157 | 23 | (549 | ) | ||||||
Gain/(loss) on disposal |
$ | 241 | $ | 34 | $ | (841 | ) | |||
Income (loss) from discontinued operations |
$ | (394 | ) | $ | 34 | $ | (974 | ) | ||
The Company made net payments of approximately $0.7 million in fiscal 2011 related to discontinued operations. These payments principally related to the settlement of customer and employee payments following the sale of the ERP business.
21. Related party transactions
Governor James R. Thompson, one of our outside directors whom the Company's Board of Directors has determined to be independent, is Senior Chairman of the law firm of Winston & Strawn in Chicago. Winston & Strawn has provided certain legal services to the Company. Governor Thompson had no personal involvement in the services provided. In 2013, 2012 and 2011, the Company paid Winston & Strawn $0.2 million, $0.3 million and $0.2 million respectively.
22. Subsequent events
On October 4, 2013, the Company's Board of Directors declared a quarterly cash dividend of $0.045 for each share of the Company's common stock outstanding. The dividend will be paid on November 29, 2013 to shareholders of record on November 15, 2013. Based on the number of shares outstanding, the payment will be approximately $3.1 million.
71
ITEM 9. Changes in and Disagreements with Accountants on Accounting and Financial Disclosure.
None.
ITEM 9A. Controls and Procedures.
Evaluation of Disclosure Controls and Procedures. Our management, with the participation of our principal executive officer and principal financial officer, has evaluated the effectiveness of the design and operation of our disclosure controls and procedures (as defined in Rule 13a-15(e) under the Securities Exchange Act of 1934 (the "Exchange Act")) as of the end of the period covered by this Annual Report on Form 10-K. Based on this evaluation, our principal executive officer and principal financial officer concluded that our disclosure controls and procedures are effective and designed to ensure that the information required to be disclosed in our reports filed or submitted under the Exchange Act is recorded, processed, summarized and reported within the time periods specified by the SEC's rules and forms and that such information is accumulated and communicated to our management, including our principal executive officer and principal financial officer as appropriate, to allow timely decisions regarding required disclosure.
Management's Report on Internal Control Over Financial Reporting. Our management is responsible for establishing and maintaining adequate internal control over financial reporting (as defined in Rule 13a-15(f) under the Exchange Act). Our internal control over financial reporting is designed to provide reasonable assurance regarding the reliability of our financial reporting and the preparation of published financial statements in accordance with generally accepted accounting principles.
Because of its inherent limitations, internal control over financial reporting may not prevent or detect misstatements. Therefore, even those systems determined to be effective can provide only reasonable assurance with respect to financial statement preparation and presentation. Also, projections of any evaluation of effectiveness to future periods are subject to the risk that controls may become inadequate because of changes in conditions, or that the degree of compliance with the policies or procedures may deteriorate.
Management assessed the effectiveness of our internal control over financial reporting as of September 30, 2013. In making this assessment, management used the criteria set forth by the Committee of Sponsoring Organizations of the Treadway Commission (COSO) in Internal Control—Integrated Framework. Based on our assessment, we believe that as of September 30, 2013, our internal control over financial reporting was effective based on criteria set forth by COSO in Internal Control—Integrated Framework.
The attestation report concerning the effectiveness of our internal control over financial reporting as of September 30, 2013, issued by Ernst & Young LLP, the independent registered public accounting firm who also audited our consolidated financial statements, is included following this Item 9A.
Changes in Internal Control Over Financial Reporting. There was no change in our internal control over financial reporting (as defined in Rules 13a-15(f) and 15d-15(f) under the Exchange Act) identified in connection with the evaluation of our internal control that occurred during our fourth fiscal quarter of 2013 that has materially affected, or is reasonably likely to materially affect, our internal control over financial reporting.
72
REPORT OF INDEPENDENT REGISTERED PUBLIC ACCOUNTING FIRM
The Board of Directors and Shareholders of MAXIMUS, Inc.
We have audited MAXIMUS, Inc.'s internal control over financial reporting as of September 30, 2013, based on criteria established in Internal Control—Integrated Framework issued by the Committee of Sponsoring Organizations of the Treadway Commission (1992 framework) (the COSO criteria). MAXIMUS, Inc.'s management is responsible for maintaining effective internal control over financial reporting, and for its assessment of the effectiveness of internal control over financial reporting included in the accompanying Management Report on Internal Control Over Financial Reporting. Our responsibility is to express an opinion on the company's internal control over financial reporting based on our audit.
We conducted our audit in accordance with the standards of the Public Company Accounting Oversight Board (United States). Those standards require that we plan and perform the audit to obtain reasonable assurance about whether effective internal control over financial reporting was maintained in all material respects. Our audit included obtaining an understanding of internal control over financial reporting, assessing the risk that a material weakness exists, testing and evaluating the design and operating effectiveness of internal control based on the assessed risk, and performing such other procedures as we considered necessary in the circumstances. We believe that our audit provides a reasonable basis for our opinion.
A company's internal control over financial reporting is a process designed to provide reasonable assurance regarding the reliability of financial reporting and the preparation of financial statements for external purposes in accordance with generally accepted accounting principles. A company's internal control over financial reporting includes those policies and procedures that (1) pertain to the maintenance of records that, in reasonable detail, accurately and fairly reflect the transactions and dispositions of the assets of the company; (2) provide reasonable assurance that transactions are recorded as necessary to permit preparation of financial statements in accordance with generally accepted accounting principles, and that receipts and expenditures of the company are being made only in accordance with authorizations of management and directors of the company; and (3) provide reasonable assurance regarding prevention or timely detection of unauthorized acquisition, use, or disposition of the company's assets that could have a material effect on the financial statements.
Because of its inherent limitations, internal control over financial reporting may not prevent or detect misstatements. Also, projections of any evaluation of effectiveness to future periods are subject to the risk that controls may become inadequate because of changes in conditions, or that the degree of compliance with the policies or procedures may deteriorate.
In our opinion, MAXIMUS, Inc. maintained, in all material respects, effective internal control over financial reporting as of September 30, 2013, based on the COSO criteria.
We also have audited, in accordance with the standards of the Public Company Accounting Oversight Board (United States), the consolidated balance sheets of MAXIMUS, Inc. as of September 30, 2013 and 2012, and the related consolidated statements of operations, comprehensive income, shareholders' equity and cash flows for each of the three years in the period ended September 30, 2013 and our report dated November 18, 2013 expressed an unqualified opinion thereon.
|
/s/ Ernst & Young LLP |
McLean,
Virginia
November 18, 2013
73
The information required by Items 10, 11, 12, 13 and 14 of Part III of Form 10-K has been omitted in reliance on General Instruction G(3) to Form 10-K and is incorporated herein by reference to the Company's Proxy Statement relating to its 2013 Annual Meeting of Shareholders (the "Proxy Statement") to be filed with the SEC, except as otherwise indicated below:
ITEM 10. Directors, Executive Officers and Corporate Governance.
The information required by this Item is incorporated by reference to the Proxy Statement.
ITEM 11. Executive Compensation.
The information required by this Item is incorporated by reference to the Proxy Statement.
ITEM 12. Security Ownership of Certain Beneficial Owners and Management and Related Stockholder Matters.
Except for the information disclosed in this Item below, the information required by this Item is incorporated by reference to the Proxy Statement.
Securities Authorized for Issuance Under Equity Compensation Plans
The following table provides information as of September 30, 2013 with respect to shares of our common stock that may be issued under our existing equity compensation plans:
| |
Number of securities to be issued upon exercise of outstanding options, warrants and rights |
Weighted average exercise price of outstanding options, warrants and rights |
Number of securities remaining available for future issuance under equity compensation plans(1) |
|||||||
|---|---|---|---|---|---|---|---|---|---|---|
Equity compensation plans/arrangements approved by the shareholders(2) |
2,840,418 | $ | 1.31 | 2,846,683 | ||||||
Equity compensation plans/arrangements not approved by the shareholders |
— | — | — | |||||||
Total |
2,840,418 | $ | 1.31 | 2,846,683 | ||||||
ITEM 13. Certain Relationships and Related Transactions, and Director Independence.
The information required by this Item is incorporated by reference to the Proxy Statement.
ITEM 14. Principal Accounting Fees and Services.
The information required by this Item is incorporated by reference to the Proxy Statement.
74
ITEM 15. Exhibits, Financial Statement Schedules.
| (a) | 1. | Financial Statements. | ||
The consolidated financial statements are listed under Item 8 of this Annual Report on Form 10-K. |
||||
2. |
Financial Statement Schedules. |
|||
None. Financial statement schedules are either not required under the related instructions or are inapplicable and therefore have been omitted. |
||||
3. |
Exhibits. |
|||
The Exhibits filed as part of this Annual Report on Form 10-K are listed on the Exhibit Index immediately preceding such Exhibits, which Exhibit Index is incorporated herein by reference. |
||||
(b) |
Exhibits—see Item 15(a)(3) above. |
|||
(c) |
Financial Statement Schedules—see Item 15(a)(2) above. |
75
Pursuant to the requirements of Section 13 or 15(d) of the Securities Exchange Act of 1934, as amended, the registrant has duly caused this Annual Report on Form 10-K to be signed on its behalf by the undersigned, thereunto duly authorized.
| MAXIMUS, INC. | ||||
Dated: November 18, 2013 |
By: |
/s/ RICHARD A. MONTONI Richard A. Montoni Chief Executive Officer |
||
Pursuant to the requirements of the Securities Exchange Act of 1934, as amended, this Annual Report on Form 10-K has been signed below by the following persons on behalf of the registrant and in the capacities and on the dates indicated.
Signature
|
Title
|
Date
|
||
|---|---|---|---|---|
| /s/ RICHARD A. MONTONI Richard A. Montoni |
President, Chief Executive Officer and Director (principal executive officer) | November 18, 2013 | ||
/s/ DAVID N. WALKER David N. Walker |
Chief Financial Officer and Treasurer (principal financial and accounting officer) |
November 18, 2013 |
||
/s/ PETER B. POND Peter B. Pond |
Chairman of the Board of Directors |
November 18, 2013 |
||
/s/ RUSSELL A. BELIVEAU Russell A. Beliveau |
Director |
November 18, 2013 |
||
/s/ JOHN J. HALEY John J. Haley |
Director |
November 18, 2013 |
||
/s/ PAUL R. LEDERER Paul R. Lederer |
Director |
November 18, 2013 |
||
/s/ RAYMOND B. RUDDY Raymond B. Ruddy |
Director |
November 18, 2013 |
76
Signature
|
Title
|
Date
|
||
|---|---|---|---|---|
| /s/ MARILYN R. SEYMANN Marilyn R. Seymann |
Director | November 18, 2013 | ||
/s/ JAMES R. THOMPSON, JR. James R. Thompson, Jr. |
Director |
November 18, 2013 |
||
/s/ WELLINGTON E. WEBB Wellington E. Webb |
Director |
November 18, 2013 |
77
| Exhibit Number |
|
||
|---|---|---|---|
| 3.1 | Amended and Restated Articles of Incorporation of the Company, as amended.(1) | ||
3.2 |
Articles of Amendment of Amended and Restated Articles of Incorporation.(2) |
||
3.3 |
Amended and Restated Bylaws of the Company.(3) |
||
4.1 |
Specimen Common Stock Certificate.(4) |
||
10.1 |
1997 Equity Incentive Plan, as amended.(5)* |
||
10.2 |
First Amendment to the 1997 Equity Incentive Plan, as amended.(6)* |
||
10.3 |
1997 Director Stock Option Plan, as amended.(7)* |
||
10.4 |
1997 Employee Stock Purchase Plan, as amended.(8)* |
||
10.5 |
Executive Employment, Non-Compete and Confidentiality Agreement by and between the Company and Richard A. Montoni.(9)* |
||
10.6 |
First Amendment to the Executive Employment, Non-Compete and Confidentiality Agreement by and between the Company and Richard A. Montoni.(6)* |
||
10.7 |
Executive Employment, Non-Compete and Confidentiality Agreement by and between the Company and Bruce Caswell.(6)* |
||
10.8 |
First Amendment to the Executive Employment, Non-Compete and Confidentiality Agreement by and between the Company and Bruce Caswell.(6)* |
||
10.9 |
Form of Indemnification Agreement by and between the Company and each of the directors of the Company.(9)* |
||
10.10 |
Amended and Restated Income Continuity Program.(6)* |
||
10.11 |
Deferred Compensation Plan, as amended.(6)* |
||
10.12 |
1997 Equity Incentive Plan—Restricted Stock Units—Terms and Conditions.(11) |
||
10.13 |
1997 Equity Incentive Plan—Non-Qualified Stock Option—Terms and Conditions.(11) |
||
10.14 |
Purchase Agreement between MAXIMUS, Inc. and UBS AG, London Branch, dated November 15, 2007.(12) |
||
10.15 |
Extension of Employment Agreement of Richard A. Montoni, dated December 22, 2009.(14)* |
||
10.16 |
2011 Equity Incentive Plan.(15) |
||
10.17 |
Credit Agreement, dated as of March 15, 2013, among MAXIMUS, Inc., SunTrust Robinson Humphrey as Administrative Agent and other lenders party thereto.(16) |
||
10.18 |
Extension of Employment Agreement of Richard A. Montoni, dated October 7, 2013.(17)* |
||
21.1 |
Subsidiaries of the Company. Filed herewith. |
||
23.1 |
Consent of Independent Registered Public Accounting Firm. Filed herewith. |
||
31.1 |
Certification Pursuant to Section 302 of the Sarbanes-Oxley Act of 2002. Filed herewith. |
||
31.2 |
Certification Pursuant to Section 302 of the Sarbanes-Oxley Act of 2002. Filed herewith. |
||
32.1 |
Section 906 Principal Executive Officer Certification. Furnished herewith. |
||
32.2 |
Section 906 Principal Financial Officer Certification. Furnished herewith. |
||
78
| Exhibit Number |
|
||
|---|---|---|---|
| 99.1 | Special Considerations and Risk Factors. Filed herewith. | ||
101 |
The following materials from the MAXIMUS, Inc. Annual Report on Form 10-K for the year ended September 30, 2013 formatted in eXtensible Business Reporting Language (XBRL): (i) Consolidated Statements of Operations, (ii) Consolidated Statements of Comprehensive Income, (iii) Consolidated Balance Sheets, (iv) Consolidated Statements of Cash Flows, (v) Consolidated Statements of Changes in Shareholders' Equity and (vi) Notes to Consolidated Financial Statements. Filed electronically herewith. |
||
79