
| Maximus: Q2 FY23 Earnings Presentation1 May 4, 2023 Fiscal 2023 Second Quarter Earnings Call David Mutryn Chief Financial Officer
| Maximus: Q2 FY23 Earnings Presentation2 These slides should be read in conjunction with the Company’s most recent quarterly earnings press release, along with listening to or reading a transcript of the comments of Company management from our most recent quarterly earnings conference call. This document may contain non-GAAP financial information. Management uses this information in its internal analysis of results and believes that this information may be informative to investors in gauging the quality of our financial performance, identifying trends in our results, and providing meaningful period-to-period comparisons. These measures should be used in conjunction with, rather than instead of, their comparable GAAP measures. For a reconciliation of non-GAAP measures to the comparable GAAP measures presented in this document, see the Company’s most recent quarterly earnings press release. Included in this presentation are forward-looking statements within the meaning of the safe harbor provisions of the United States Private Securities Litigation Reform Act of 1995. Forward-looking statements can be identified by words such as: "anticipate," "intend," "plan," "goal," "seek," "opportunity," "could," "potential," "believe," "project," "estimate," "expect," "forecast," "strategy," "future," "likely," "may," "should," "will," and similar references to future periods. Forward-looking statements that are not historical facts, including statements about our confidence, strategies and initiatives and our expectations about revenues, results of operations, profitability, liquidity, market demand or the impact of the pandemic are forward-looking statements that involve risks and uncertainties such as those related to the impact of the pandemic and our recently-completed acquisitions. These risks could cause the Company’s actual results to differ materially from those indicated by such forward-looking statements. A summary of risk factors can be found in Item 1A, "Risk Factors" in our Annual Report on Form 10-K for the year ended September 30, 2022, which was filed with the Securities and Exchange Commission (SEC) on November 22, 2022. Any forward-looking statement made by us in this report is based only on information currently available to us and speaks only as of the date on which it is made. We undertake no obligation to publicly update any forward-looking statement, whether written or oral, that may be made from time to time, whether as a result of new information, future developments or otherwise. Throughout this presentation, numbers may not add due to rounding. Forward-looking Statements & Non-GAAP Information
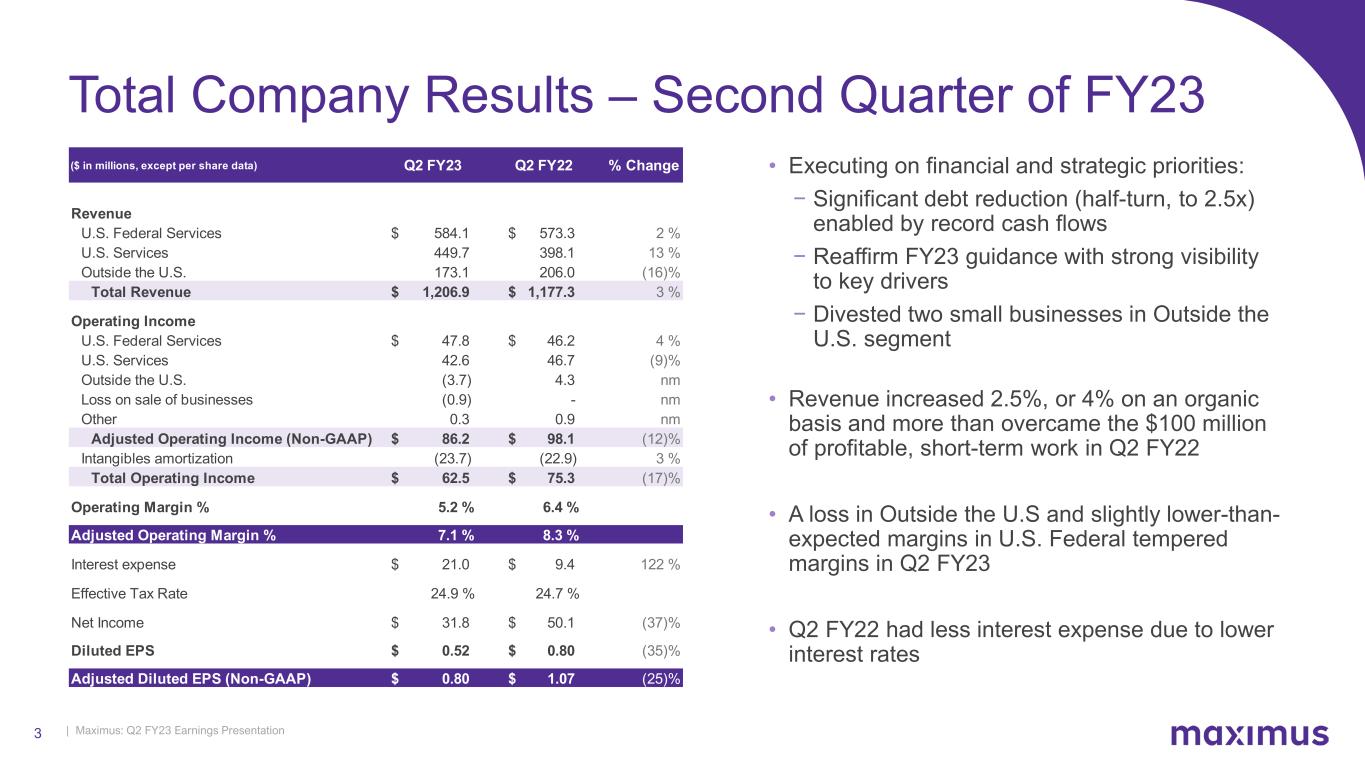
| Maximus: Q2 FY23 Earnings Presentation3 • Executing on financial and strategic priorities: − Significant debt reduction (half-turn, to 2.5x) enabled by record cash flows − Reaffirm FY23 guidance with strong visibility to key drivers − Divested two small businesses in Outside the U.S. segment • Revenue increased 2.5%, or 4% on an organic basis and more than overcame the $100 million of profitable, short-term work in Q2 FY22 • A loss in Outside the U.S and slightly lower-than- expected margins in U.S. Federal tempered margins in Q2 FY23 • Q2 FY22 had less interest expense due to lower interest rates Total Company Results – Second Quarter of FY23 ($ in millions, except per share data) Q2 FY23 Q2 FY22 % Change Revenue U.S. Federal Services $ 584.1 $ 573.3 2 % U.S. Services 449.7 398.1 13 % Outside the U.S. 173.1 206.0 (16)% Total Revenue $ 1,206.9 $ 1,177.3 3 % Operating Income U.S. Federal Services $ 47.8 $ 46.2 4 % U.S. Services 42.6 46.7 (9)% Outside the U.S. (3.7) 4.3 nm Loss on sale of businesses (0.9) - nm Other 0.3 0.9 nm Adjusted Operating Income (Non-GAAP) $ 86.2 $ 98.1 (12)% Intangibles amortization (23.7) (22.9) 3 % Total Operating Income $ 62.5 $ 75.3 (17)% Operating Margin % 5.2 % 6.4 % Adjusted Operating Margin % 7.1 % 8.3 % Interest expense $ 21.0 $ 9.4 122 % Effective Tax Rate 24.9 % 24.7 % Net Income $ 31.8 $ 50.1 (37)% Diluted EPS $ 0.52 $ 0.80 (35)% Adjusted Diluted EPS (Non-GAAP) $ 0.80 $ 1.07 (25)%
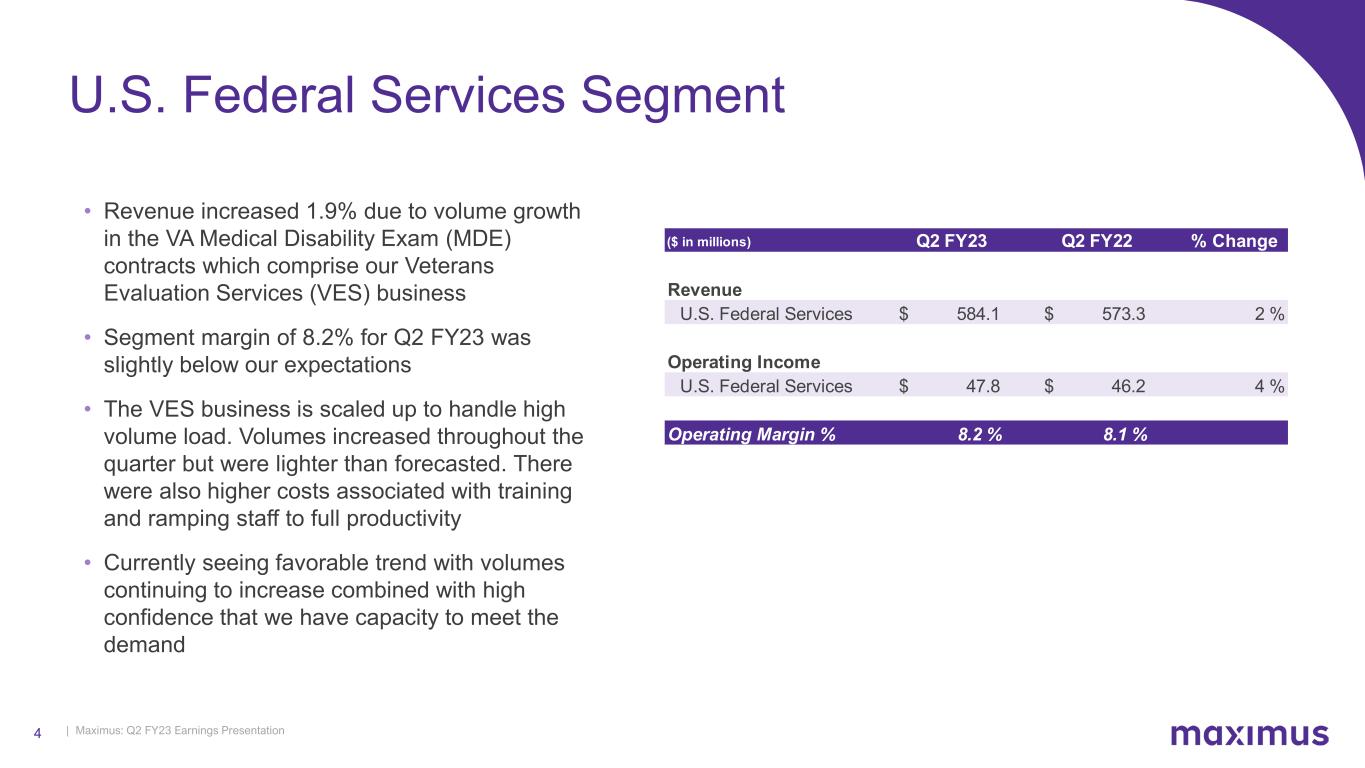
| Maximus: Q2 FY23 Earnings Presentation4 U.S. Federal Services Segment • Revenue increased 1.9% due to volume growth in the VA Medical Disability Exam (MDE) contracts which comprise our Veterans Evaluation Services (VES) business • Segment margin of 8.2% for Q2 FY23 was slightly below our expectations • The VES business is scaled up to handle high volume load. Volumes increased throughout the quarter but were lighter than forecasted. There were also higher costs associated with training and ramping staff to full productivity • Currently seeing favorable trend with volumes continuing to increase combined with high confidence that we have capacity to meet the demand ($ in millions) Q2 FY23 Q2 FY22 % Change Revenue U.S. Federal Services $ 584.1 $ 573.3 2 % Operating Income U.S. Federal Services $ 47.8 $ 46.2 4 % Operating Margin % 8.2 % 8.1 %
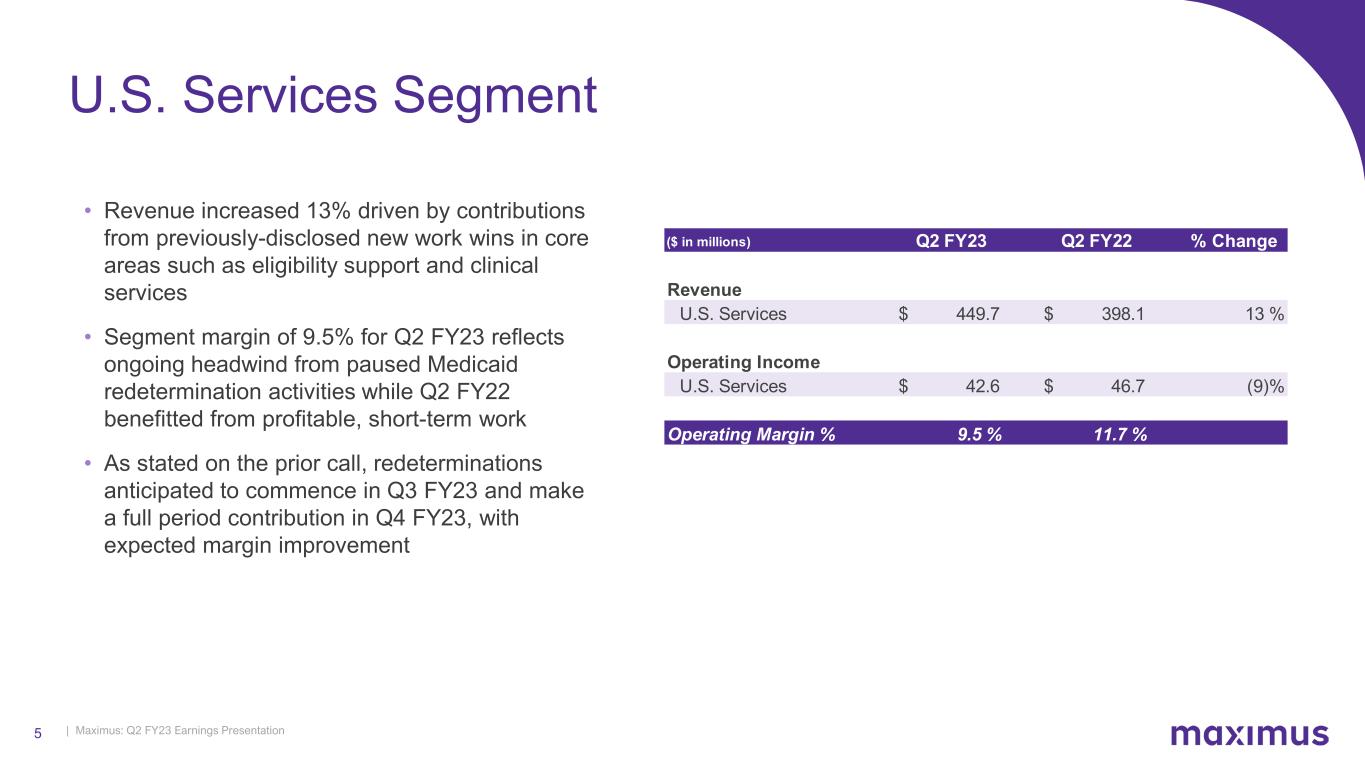
| Maximus: Q2 FY23 Earnings Presentation5 • Revenue increased 13% driven by contributions from previously-disclosed new work wins in core areas such as eligibility support and clinical services • Segment margin of 9.5% for Q2 FY23 reflects ongoing headwind from paused Medicaid redetermination activities while Q2 FY22 benefitted from profitable, short-term work • As stated on the prior call, redeterminations anticipated to commence in Q3 FY23 and make a full period contribution in Q4 FY23, with expected margin improvement U.S. Services Segment ($ in millions) Q2 FY23 Q2 FY22 % Change Revenue U.S. Services $ 449.7 $ 398.1 13 % Operating Income U.S. Services $ 42.6 $ 46.7 (9)% Operating Margin % 9.5 % 11.7 %
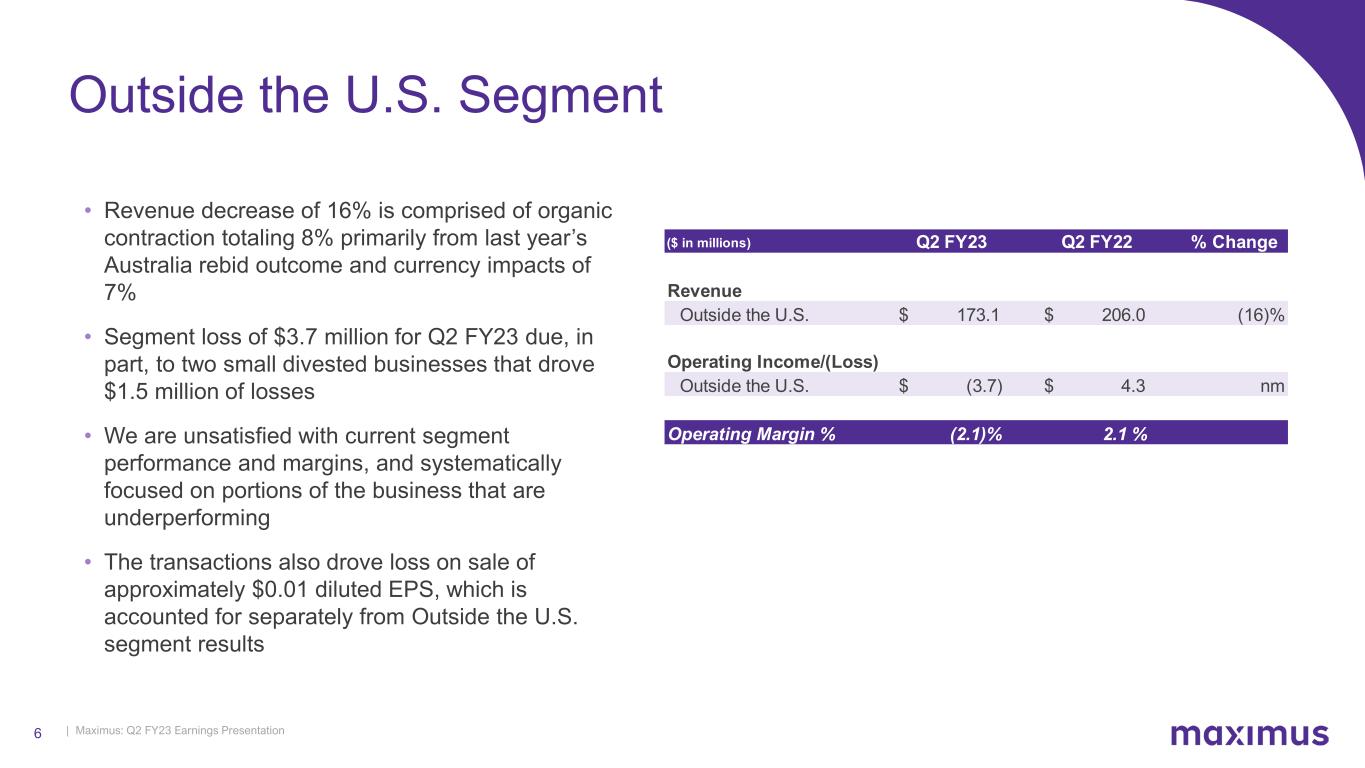
| Maximus: Q2 FY23 Earnings Presentation6 • Revenue decrease of 16% is comprised of organic contraction totaling 8% primarily from last year’s Australia rebid outcome and currency impacts of 7% • Segment loss of $3.7 million for Q2 FY23 due, in part, to two small divested businesses that drove $1.5 million of losses • We are unsatisfied with current segment performance and margins, and systematically focused on portions of the business that are underperforming • The transactions also drove loss on sale of approximately $0.01 diluted EPS, which is accounted for separately from Outside the U.S. segment results Outside the U.S. Segment ($ in millions) Q2 FY23 Q2 FY22 % Change Revenue Outside the U.S. $ 173.1 $ 206.0 (16)% Operating Income/(Loss) Outside the U.S. $ (3.7) $ 4.3 nm Operating Margin % (2.1)% 2.1 %
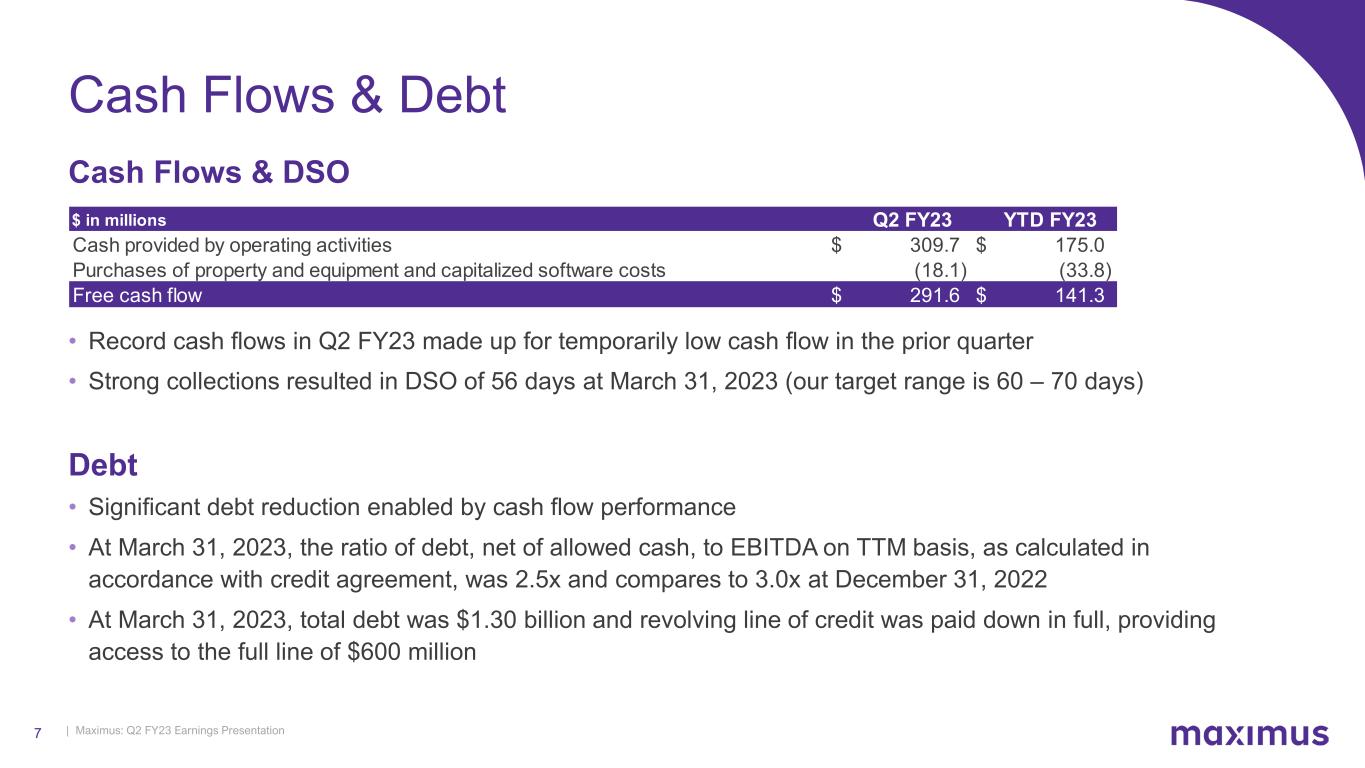
| Maximus: Q2 FY23 Earnings Presentation7 Cash Flows & Debt Cash Flows & DSO • Record cash flows in Q2 FY23 made up for temporarily low cash flow in the prior quarter • Strong collections resulted in DSO of 56 days at March 31, 2023 (our target range is 60 – 70 days) Debt • Significant debt reduction enabled by cash flow performance • At March 31, 2023, the ratio of debt, net of allowed cash, to EBITDA on TTM basis, as calculated in accordance with credit agreement, was 2.5x and compares to 3.0x at December 31, 2022 • At March 31, 2023, total debt was $1.30 billion and revolving line of credit was paid down in full, providing access to the full line of $600 million $ in millions Q2 FY23 YTD FY23 Cash provided by operating activities $ 309.7 $ 175.0 Purchases of property and equipment and capitalized software costs (18.1) (33.8) Free cash flow $ 291.6 $ 141.3
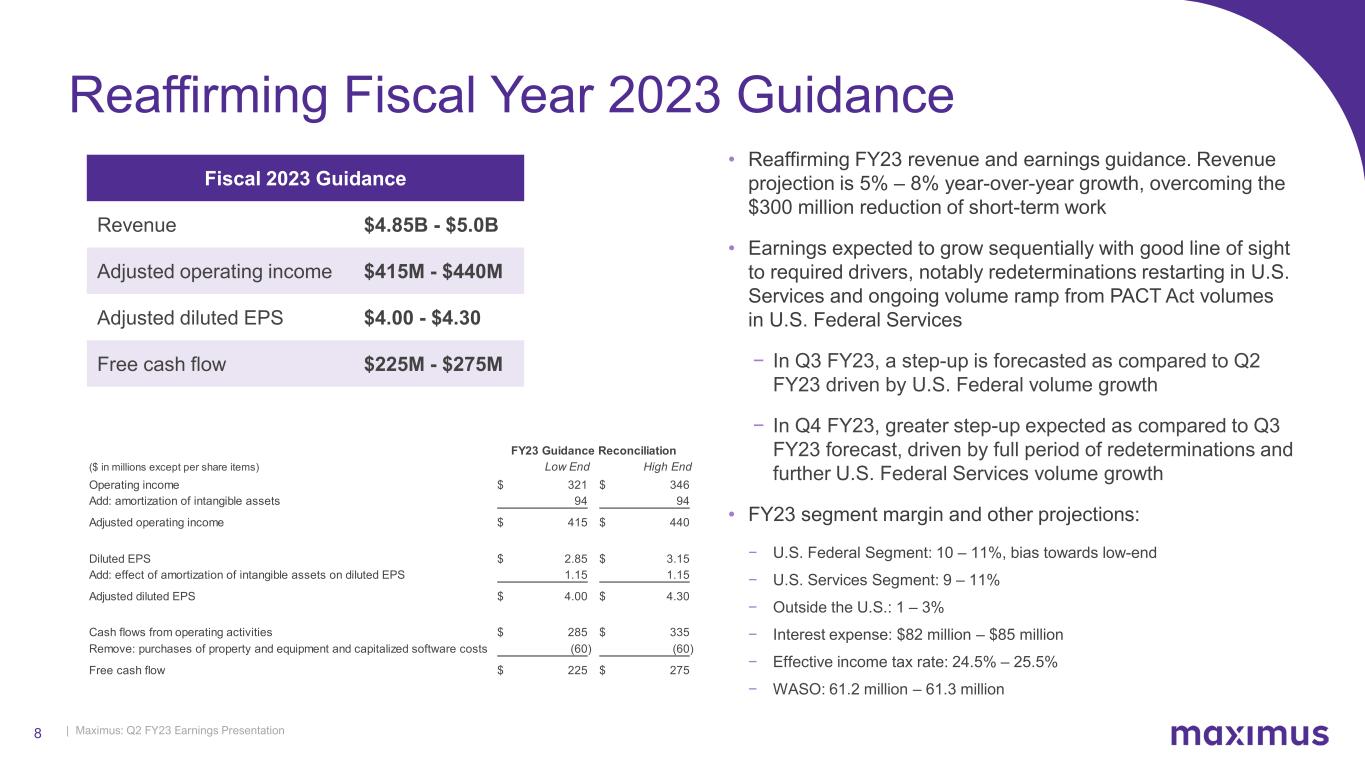
| Maximus: Q2 FY23 Earnings Presentation8 Reaffirming Fiscal Year 2023 Guidance Fiscal 2023 Guidance Revenue $4.85B - $5.0B Adjusted operating income $415M - $440M Adjusted diluted EPS $4.00 - $4.30 Free cash flow $225M - $275M • Reaffirming FY23 revenue and earnings guidance. Revenue projection is 5% – 8% year-over-year growth, overcoming the $300 million reduction of short-term work • Earnings expected to grow sequentially with good line of sight to required drivers, notably redeterminations restarting in U.S. Services and ongoing volume ramp from PACT Act volumes in U.S. Federal Services − In Q3 FY23, a step-up is forecasted as compared to Q2 FY23 driven by U.S. Federal volume growth − In Q4 FY23, greater step-up expected as compared to Q3 FY23 forecast, driven by full period of redeterminations and further U.S. Federal Services volume growth • FY23 segment margin and other projections: − U.S. Federal Segment: 10 – 11%, bias towards low-end − U.S. Services Segment: 9 – 11% − Outside the U.S.: 1 – 3% − Interest expense: $82 million – $85 million − Effective income tax rate: 24.5% – 25.5% − WASO: 61.2 million – 61.3 million ($ in millions except per share items) Low End High End Operating income 321$ 346$ Add: amortization of intangible assets 94 94 Adjusted operating income 415$ 440$ Diluted EPS 2.85$ 3.15$ Add: effect of amortization of intangible assets on diluted EPS 1.15 1.15 Adjusted diluted EPS 4.00$ 4.30$ Cash flows from operating activities 285$ 335$ Remove: purchases of property and equipment and capitalized software costs (60) (60) Free cash flow 225$ 275$ FY23 Guidance Reconciliation

| Maximus: Q2 FY23 Earnings Presentation9 May 4, 2023 Fiscal 2023 Second Quarter Earnings Call Bruce Caswell President & Chief Executive Officer
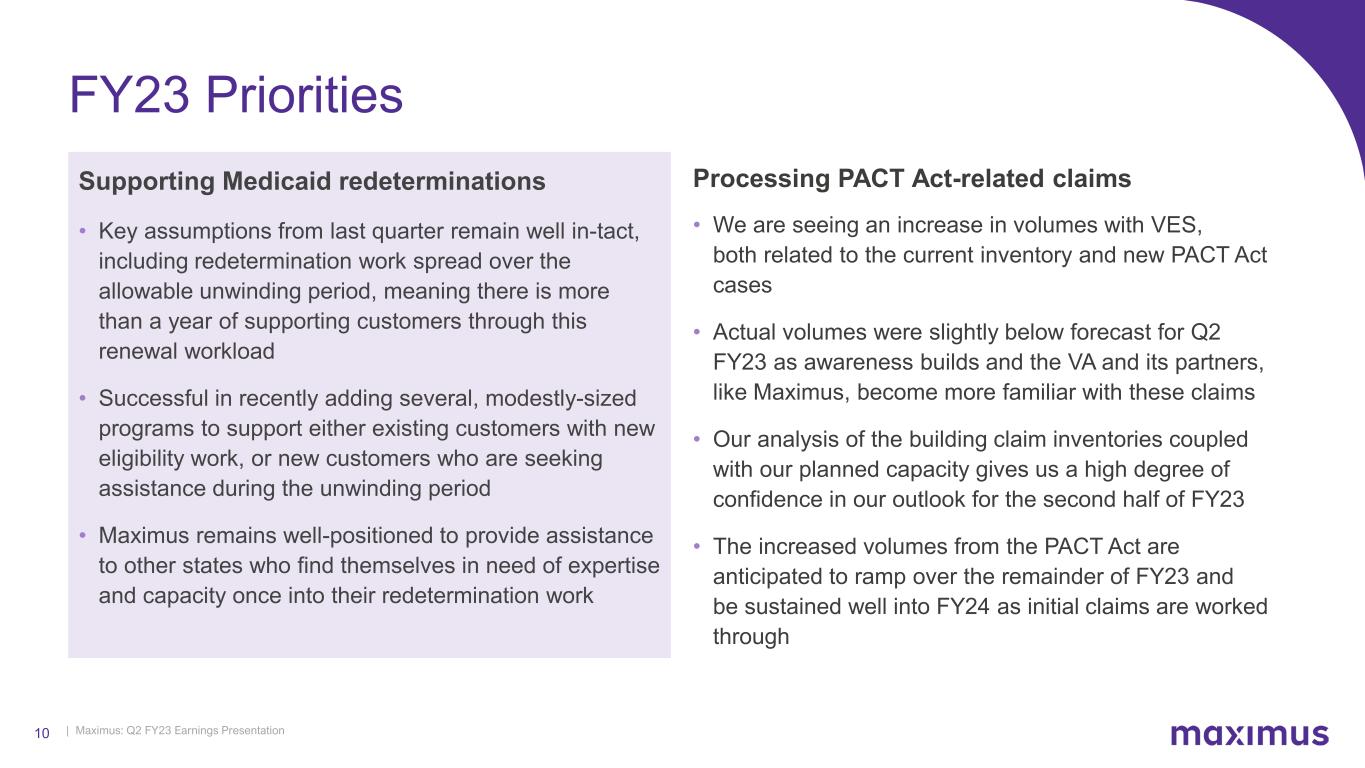
| Maximus: Q2 FY23 Earnings Presentation10 Processing PACT Act-related claims • We are seeing an increase in volumes with VES, both related to the current inventory and new PACT Act cases • Actual volumes were slightly below forecast for Q2 FY23 as awareness builds and the VA and its partners, like Maximus, become more familiar with these claims • Our analysis of the building claim inventories coupled with our planned capacity gives us a high degree of confidence in our outlook for the second half of FY23 • The increased volumes from the PACT Act are anticipated to ramp over the remainder of FY23 and be sustained well into FY24 as initial claims are worked through Supporting Medicaid redeterminations • Key assumptions from last quarter remain well in-tact, including redetermination work spread over the allowable unwinding period, meaning there is more than a year of supporting customers through this renewal workload • Successful in recently adding several, modestly-sized programs to support either existing customers with new eligibility work, or new customers who are seeking assistance during the unwinding period • Maximus remains well-positioned to provide assistance to other states who find themselves in need of expertise and capacity once into their redetermination work FY23 Priorities
| Maximus: Q2 FY23 Earnings Presentation11 • During the second quarter, we divested two small businesses in the Outside the U.S. Segment: a commercial division within the U.K. and the employment services business in Sweden Optimizing the Business • Both businesses were non-core to our three-to-five- year strategy and not meeting financial objectives • We routinely evaluate our portfolio of businesses in this way and will continue to do so, particularly in light of the Outside the U.S.’s performance this second quarter • Together, the annual revenue run rate for both divested businesses is ~$40 million • The financial effect, especially given the partial year, is not large enough to affect our guidance
| Maximus: Q2 FY23 Earnings Presentation12 Executing on Our Strategy Technology Modernization • Secured our place on the IRS Enterprise Development, Operations Services (EDOS) procurement following resolution of protest • The Blanket Purchase Agreement is worth up to $2.6 billion over 7 years for the resulting task orders which are expected in our fiscal year 2024 and beyond • We are proud to be supporting the long-term modernization and transformation of the IRS’s technology infrastructure Customer Services, Digitally Enabled • Aidvantage business awarded a position on Unified Servicing and Data Solutions (USDS), supporting student loan servicing work over the next decade • The new IDIQ under the Federal Student Aid (FSA) office spans 10 years including options and has awarded, potential value of $16 billion; more than $2 billion is the estimated, realizable value • Maximus offers the FSA a borrower-first servicing mentality and added agility of technology capabilities to improve the borrower experience • Now entrusted with over 9 million borrower accounts, or more than a quarter of the approximately 39 million Department of Education borrower accounts, which is up from the 5.8 million at the time of contract novation in October 2021
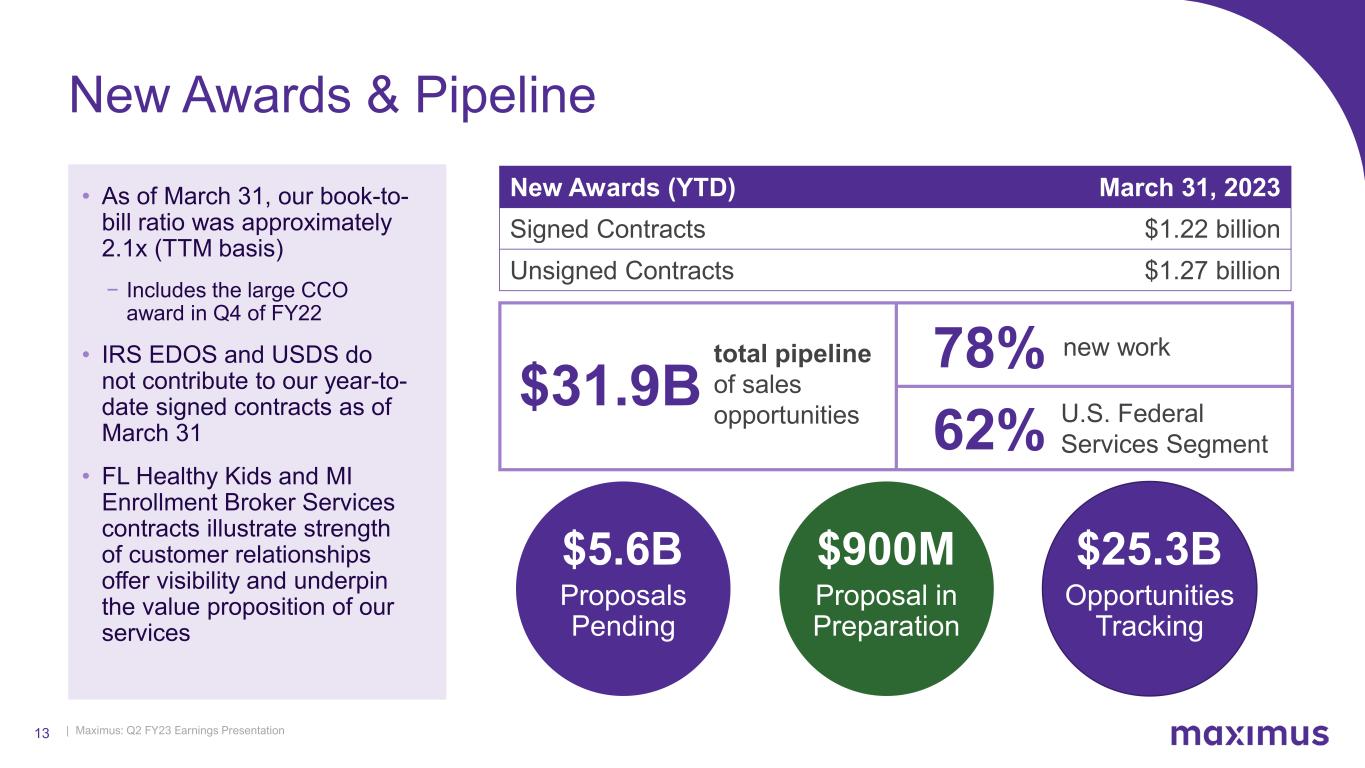
| Maximus: Q2 FY23 Earnings Presentation13 New Awards (YTD) March 31, 2023 Signed Contracts $1.22 billion Unsigned Contracts $1.27 billion Proposal in Preparation Opportunities Tracking New Awards & Pipeline • As of March 31, our book-to- bill ratio was approximately 2.1x (TTM basis) − Includes the large CCO award in Q4 of FY22 • IRS EDOS and USDS do not contribute to our year-to- date signed contracts as of March 31 • FL Healthy Kids and MI Enrollment Broker Services contracts illustrate strength of customer relationships offer visibility and underpin the value proposition of our services Proposals Pending $5.6B $900M $25.3B $31.9B total pipeline of sales opportunities 78% new work 62% U.S. Federal Services Segment
| Maximus: Q2 FY23 Earnings Presentation14 Closing Remarks • Our priorities for remainder of FY23 are clear: − Successful execution on ramping volumes in our core Medicaid eligibility and Veterans’ assessments markets − Focus on underperforming businesses − Disciplined capital allocation • Combination of recompete and new-work awards continue to position us to deliver reliable, mid- single-digit organic growth • Multiple multi-billion-dollar awards in the Federal space solidify Maximus as a proven, large-scale partner to the Federal government • Continued focus on optimizing our organizational model and processes to support the three-to-five- year strategy and our operating income margin commitments from Investor Day

| Maximus: Q2 FY23 Earnings Presentation15