
| Maximus: Q1 FY23 Earnings Presentation1 Fiscal 2023 First Quarter Earnings Call David Mutryn Chief Financial Officer February 9, 2023
| Maximus: Q1 FY23 Earnings Presentation2 These slides should be read in conjunction with the Company’s most recent quarterly earnings press release, along with listening to or reading a transcript of the comments of Company management from our most recent quarterly earnings conference call. This document may contain non-GAAP financial information. Management uses this information in its internal analysis of results and believes that this information may be informative to investors in gauging the quality of our financial performance, identifying trends in our results, and providing meaningful period-to-period comparisons. These measures should be used in conjunction with, rather than instead of, their comparable GAAP measures. For a reconciliation of non-GAAP measures to the comparable GAAP measures presented in this document, see the Company’s most recent quarterly earnings press release. Included in this presentation are forward-looking statements within the meaning of the safe harbor provisions of the United States Private Securities Litigation Reform Act of 1995. Forward-looking statements can be identified by words such as: "anticipate," "intend," "plan," "goal," "seek," "opportunity," "could," "potential," "believe," "project," "estimate," "expect," "forecast," "strategy," "future," "likely," "may," "should," "will," and similar references to future periods. Forward-looking statements that are not historical facts, including statements about our confidence, strategies and initiatives and our expectations about revenues, results of operations, profitability, liquidity, market demand or the impact of the pandemic are forward-looking statements that involve risks and uncertainties such as those related to the impact of the pandemic and our recently-completed acquisitions. These risks could cause the Company’s actual results to differ materially from those indicated by such forward-looking statements. A summary of risk factors can be found in Item 1A, "Risk Factors" in our Annual Report on Form 10-K for the year ended September 30, 2022, which was filed with the Securities and Exchange Commission (SEC) on November 22, 2022. Any forward-looking statement made by us in this report is based only on information currently available to us and speaks only as of the date on which it is made. We undertake no obligation to publicly update any forward-looking statement, whether written or oral, that may be made from time to time, whether as a result of new information, future developments or otherwise. Throughout this presentation, numbers may not add due to rounding. Forward-looking Statements & Non-GAAP Information
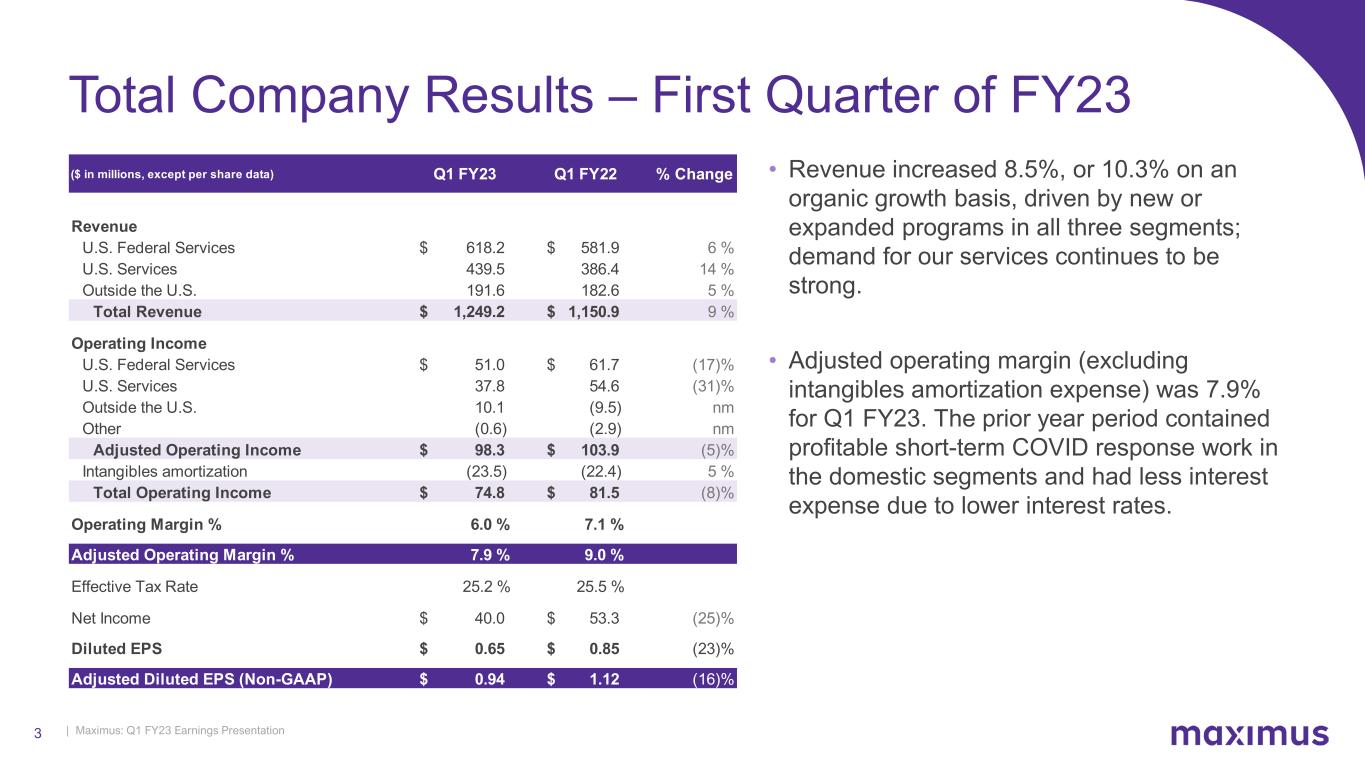
| Maximus: Q1 FY23 Earnings Presentation3 • Revenue increased 8.5%, or 10.3% on an organic growth basis, driven by new or expanded programs in all three segments; demand for our services continues to be strong. • Adjusted operating margin (excluding intangibles amortization expense) was 7.9% for Q1 FY23. The prior year period contained profitable short-term COVID response work in the domestic segments and had less interest expense due to lower interest rates. Total Company Results – First Quarter of FY23 ($ in millions, except per share data) Q1 FY23 Q1 FY22 % Change Revenue U.S. Federal Services $ 618.2 $ 581.9 6 % U.S. Services 439.5 386.4 14 % Outside the U.S. 191.6 182.6 5 % Total Revenue $ 1,249.2 $ 1,150.9 9 % Operating Income U.S. Federal Services $ 51.0 $ 61.7 (17)% U.S. Services 37.8 54.6 (31)% Outside the U.S. 10.1 (9.5) nm Other (0.6) (2.9) nm Adjusted Operating Income $ 98.3 $ 103.9 (5)% Intangibles amortization (23.5) (22.4) 5 % Total Operating Income $ 74.8 $ 81.5 (8)% Operating Margin % 6.0 % 7.1 % Adjusted Operating Margin % 7.9 % 9.0 % Effective Tax Rate 25.2 % 25.5 % Net Income $ 40.0 $ 53.3 (25)% Diluted EPS $ 0.65 $ 0.85 (23)% Adjusted Diluted EPS (Non-GAAP) $ 0.94 $ 1.12 (16)%
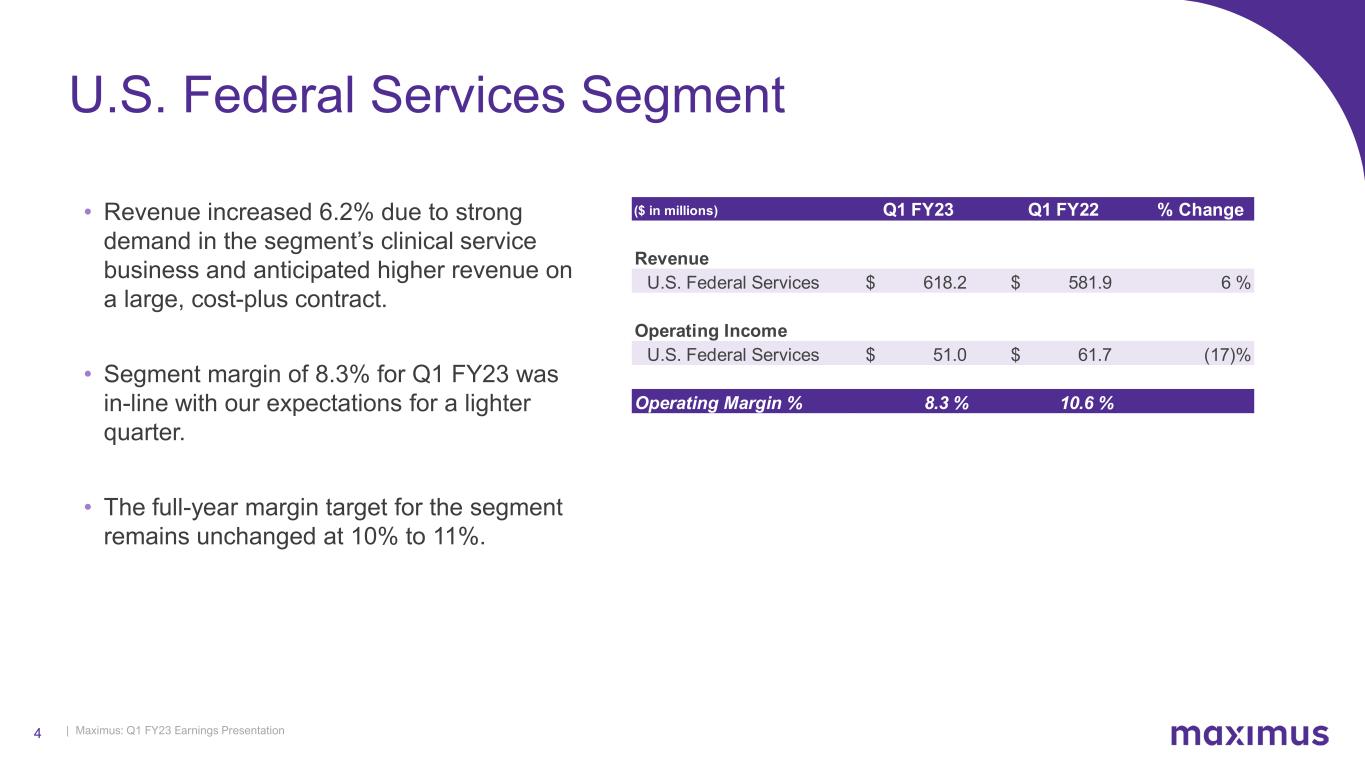
| Maximus: Q1 FY23 Earnings Presentation4 U.S. Federal Services Segment • Revenue increased 6.2% due to strong demand in the segment’s clinical service business and anticipated higher revenue on a large, cost-plus contract. • Segment margin of 8.3% for Q1 FY23 was in-line with our expectations for a lighter quarter. • The full-year margin target for the segment remains unchanged at 10% to 11%. ($ in millions) Q1 FY23 Q1 FY22 % Change Revenue U.S. Federal Services $ 618.2 $ 581.9 6 % Operating Income U.S. Federal Services $ 51.0 $ 61.7 (17)% Operating Margin % 8.3 % 10.6 %
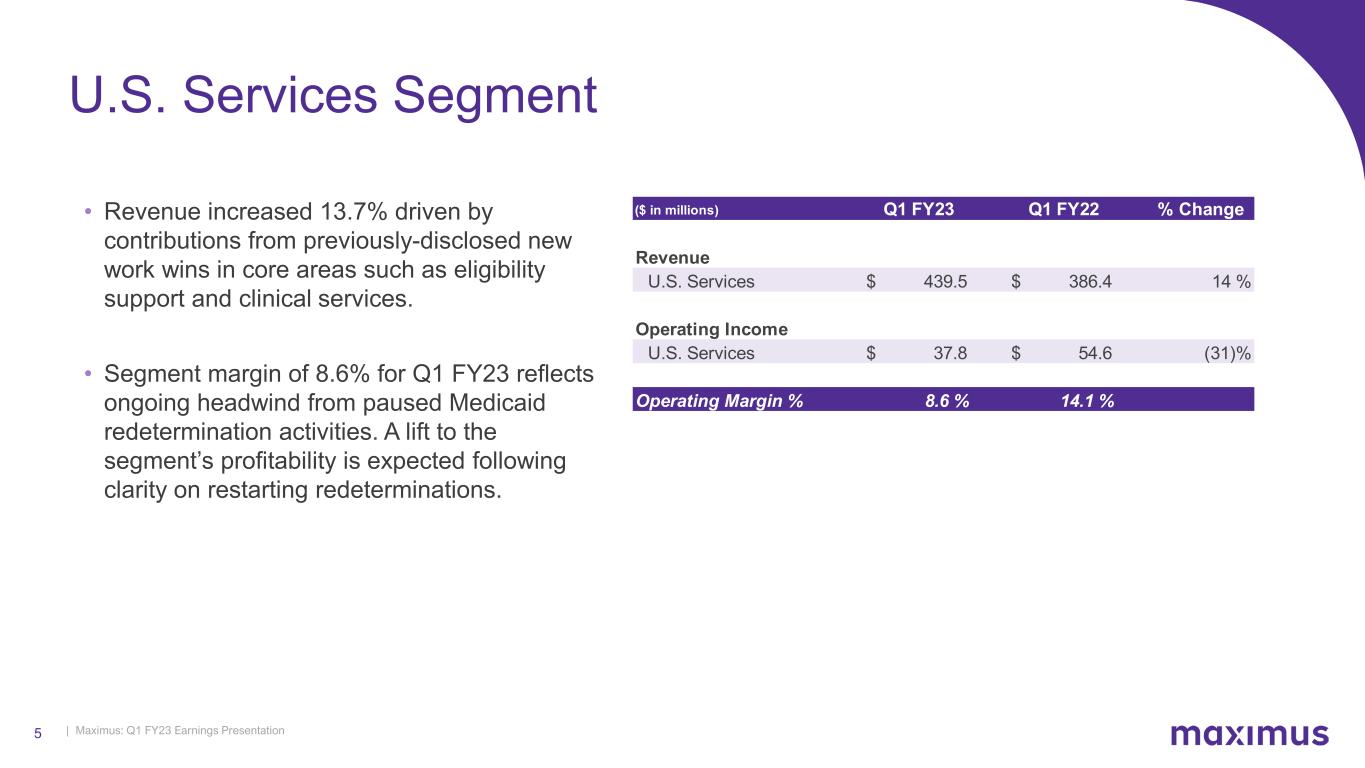
| Maximus: Q1 FY23 Earnings Presentation5 • Revenue increased 13.7% driven by contributions from previously-disclosed new work wins in core areas such as eligibility support and clinical services. • Segment margin of 8.6% for Q1 FY23 reflects ongoing headwind from paused Medicaid redetermination activities. A lift to the segment’s profitability is expected following clarity on restarting redeterminations. U.S. Services Segment ($ in millions) Q1 FY23 Q1 FY22 % Change Revenue U.S. Services $ 439.5 $ 386.4 14 % Operating Income U.S. Services $ 37.8 $ 54.6 (31)% Operating Margin % 8.6 % 14.1 %
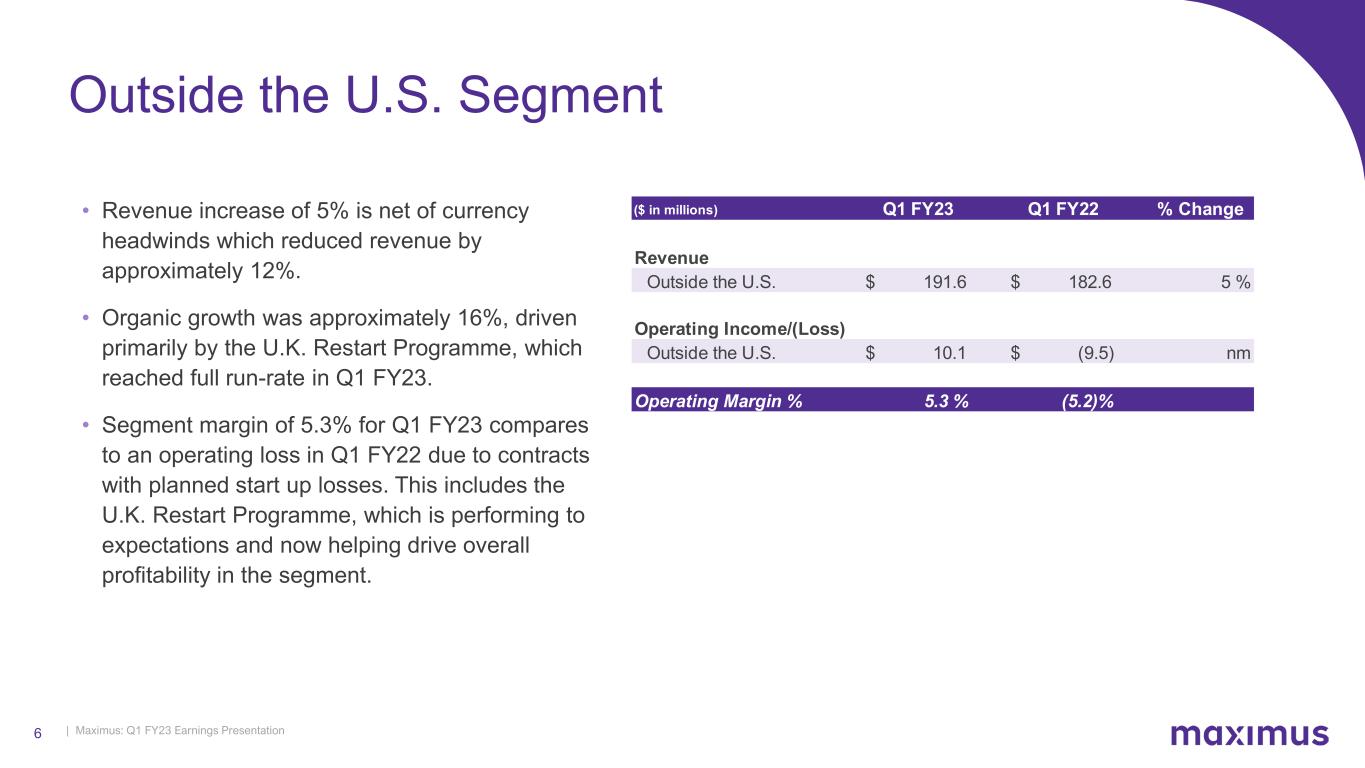
| Maximus: Q1 FY23 Earnings Presentation6 • Revenue increase of 5% is net of currency headwinds which reduced revenue by approximately 12%. • Organic growth was approximately 16%, driven primarily by the U.K. Restart Programme, which reached full run-rate in Q1 FY23. • Segment margin of 5.3% for Q1 FY23 compares to an operating loss in Q1 FY22 due to contracts with planned start up losses. This includes the U.K. Restart Programme, which is performing to expectations and now helping drive overall profitability in the segment. Outside the U.S. Segment ($ in millions) Q1 FY23 Q1 FY22 % Change Revenue Outside the U.S. $ 191.6 $ 182.6 5 % Operating Income/(Loss) Outside the U.S. $ 10.1 $ (9.5) nm Operating Margin % 5.3 % (5.2)%
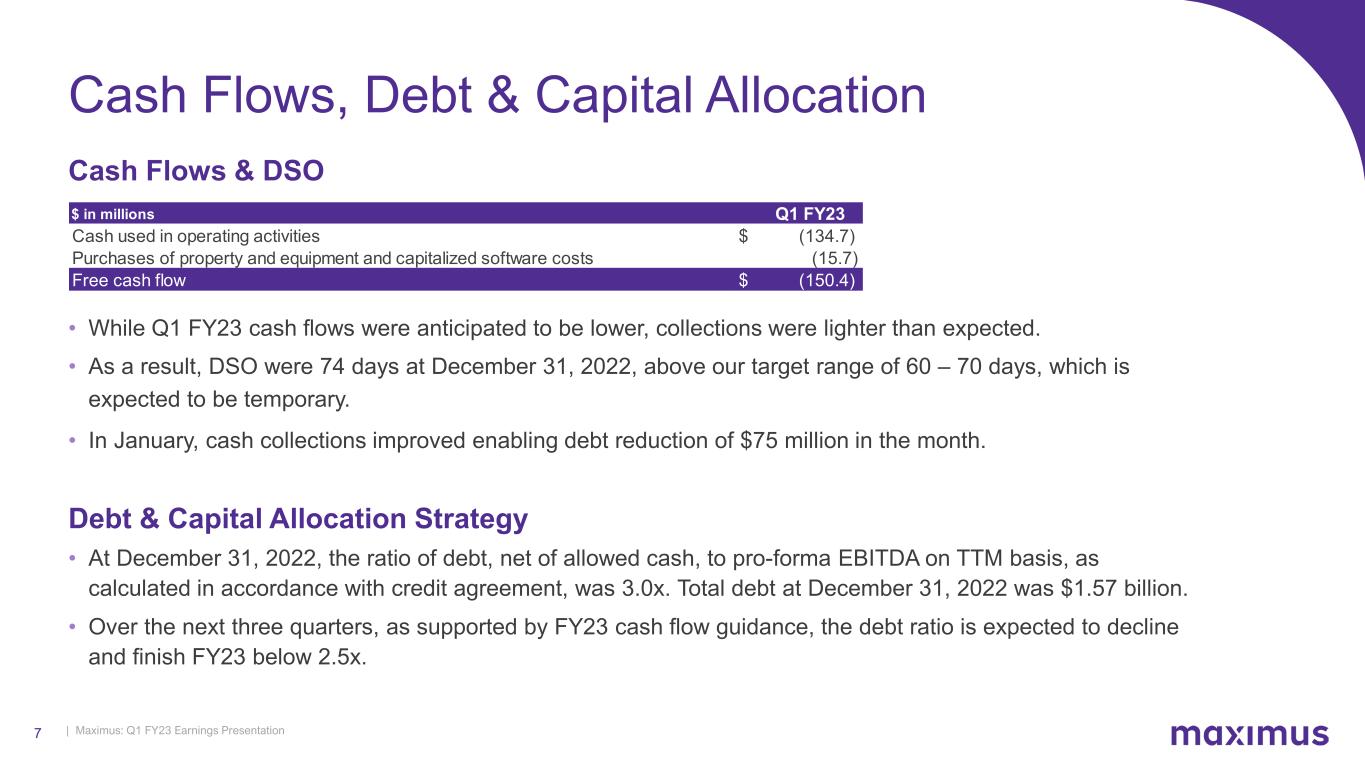
| Maximus: Q1 FY23 Earnings Presentation7 Cash Flows, Debt & Capital Allocation Cash Flows & DSO • While Q1 FY23 cash flows were anticipated to be lower, collections were lighter than expected. • As a result, DSO were 74 days at December 31, 2022, above our target range of 60 – 70 days, which is expected to be temporary. • In January, cash collections improved enabling debt reduction of $75 million in the month. Debt & Capital Allocation Strategy • At December 31, 2022, the ratio of debt, net of allowed cash, to pro-forma EBITDA on TTM basis, as calculated in accordance with credit agreement, was 3.0x. Total debt at December 31, 2022 was $1.57 billion. • Over the next three quarters, as supported by FY23 cash flow guidance, the debt ratio is expected to decline and finish FY23 below 2.5x. $ in millions Q1 FY23 Cash used in operating activities $ (134.7) Purchases of property and equipment and capitalized software costs (15.7) Free cash flow $ (150.4)
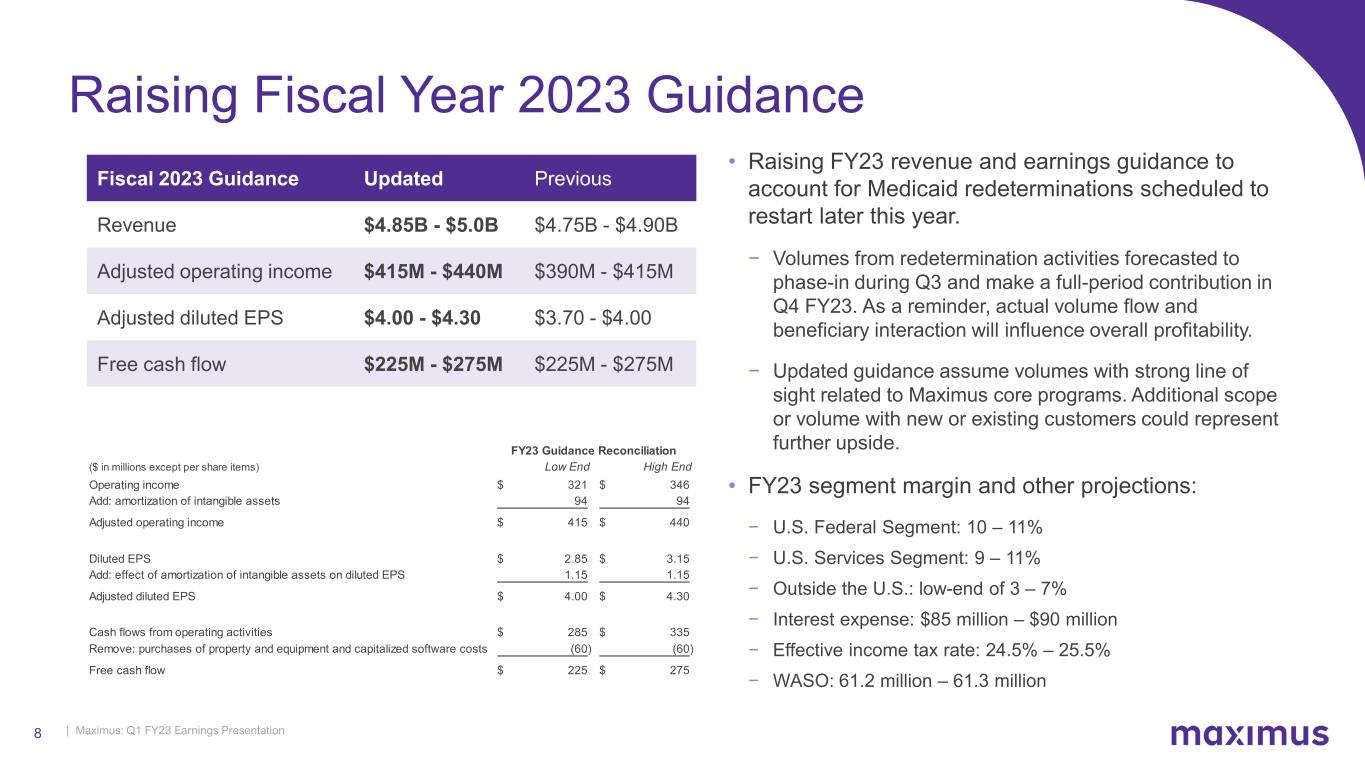
| Maximus: Q1 FY23 Earnings Presentation8 Raising Fiscal Year 2023 Guidance Fiscal 2023 Guidance Updated Previous Revenue $4.85B - $5.0B $4.75B - $4.90B Adjusted operating income $415M - $440M $390M - $415M Adjusted diluted EPS $4.00 - $4.30 $3.70 - $4.00 Free cash flow $225M - $275M $225M - $275M • Raising FY23 revenue and earnings guidance to account for Medicaid redeterminations scheduled to restart later this year. − Volumes from redetermination activities forecasted to phase-in during Q3 and make a full-period contribution in Q4 FY23. As a reminder, actual volume flow and beneficiary interaction will influence overall profitability. − Updated guidance assume volumes with strong line of sight related to Maximus core programs. Additional scope or volume with new or existing customers could represent further upside. • FY23 segment margin and other projections: − U.S. Federal Segment: 10 – 11% − U.S. Services Segment: 9 – 11% − Outside the U.S.: low-end of 3 – 7% − Interest expense: $85 million – $90 million − Effective income tax rate: 24.5% – 25.5% − WASO: 61.2 million – 61.3 million ($ in millions except per share items) Low End High End Operating income 321$ 346$ Add: amortization of intangible assets 94 94 Adjusted operating income 415$ 440$ Diluted EPS 2.85$ 3.15$ Add: effect of amortization of intangible assets on diluted EPS 1.15 1.15 Adjusted diluted EPS 4.00$ 4.30$ Cash flows from operating activities 285$ 335$ Remove: purchases of property and equipment and capitalized software costs (60) (60) Free cash flow 225$ 275$ FY23 Guidance Reconciliation

| Maximus: Q1 FY23 Earnings Presentation9 Fiscal 2023 First Quarter Earnings Call Bruce Caswell President & Chief Executive Officer February 9, 2023
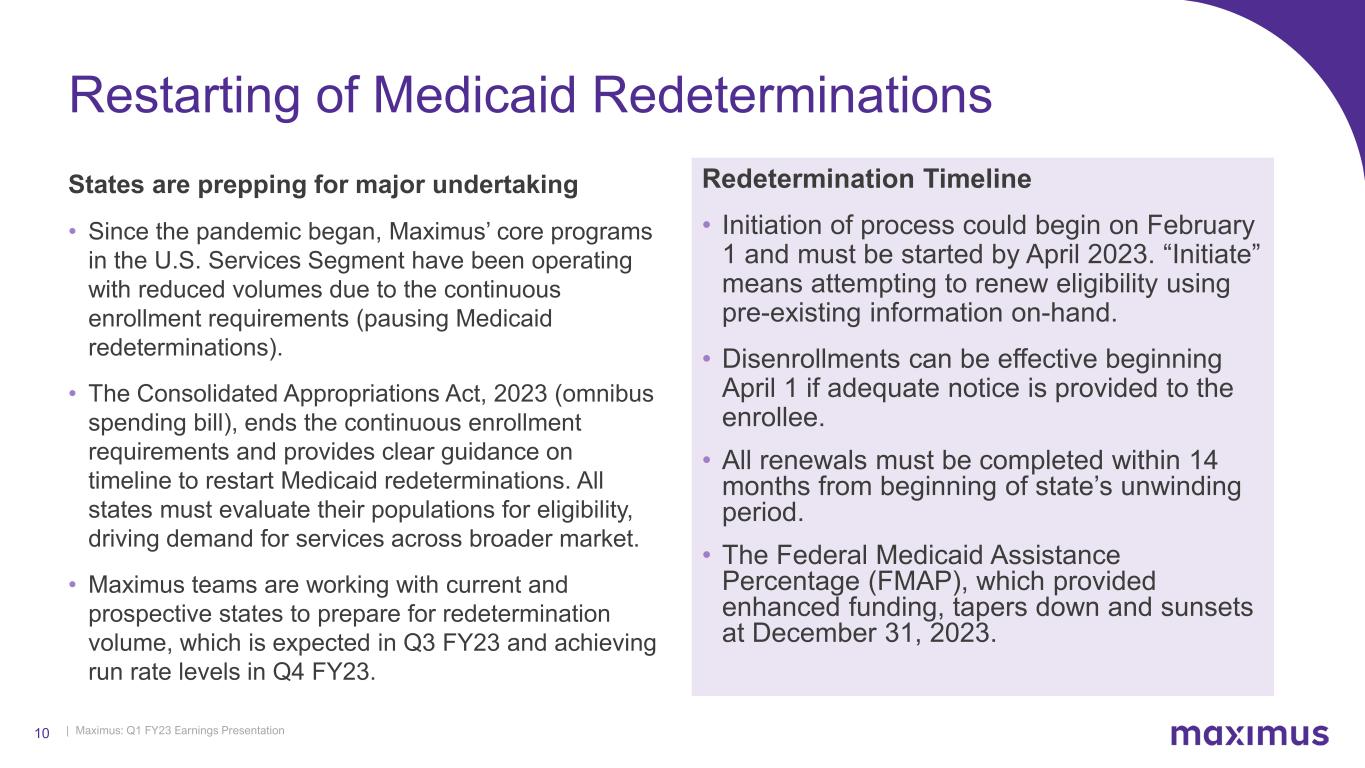
| Maximus: Q1 FY23 Earnings Presentation10 Redetermination Timeline • Initiation of process could begin on February 1 and must be started by April 2023. “Initiate” means attempting to renew eligibility using pre-existing information on-hand. • Disenrollments can be effective beginning April 1 if adequate notice is provided to the enrollee. • All renewals must be completed within 14 months from beginning of state’s unwinding period. • The Federal Medicaid Assistance Percentage (FMAP), which provided enhanced funding, tapers down and sunsets at December 31, 2023. States are prepping for major undertaking • Since the pandemic began, Maximus’ core programs in the U.S. Services Segment have been operating with reduced volumes due to the continuous enrollment requirements (pausing Medicaid redeterminations). • The Consolidated Appropriations Act, 2023 (omnibus spending bill), ends the continuous enrollment requirements and provides clear guidance on timeline to restart Medicaid redeterminations. All states must evaluate their populations for eligibility, driving demand for services across broader market. • Maximus teams are working with current and prospective states to prepare for redetermination volume, which is expected in Q3 FY23 and achieving run rate levels in Q4 FY23. Restarting of Medicaid Redeterminations
| Maximus: Q1 FY23 Earnings Presentation11 • New win in Q1 FY23 in U.S. Services for clinical work with long-standing state customer. • Our clinicians will be performing variety of complex health assessments, including level of care and Preadmission Screening and Resident Review (PASRR) assessments. • TCV of $129 million over a four-year base period demonstrates successfully expanding into adjacent services areas with long-term customers as program policy and needs evolve. • Maximus selected as one of two organizations for the IRS Enterprise Development, Operations Services (EDOS) contract vehicle. The IT services scope across a broad range of categories is delivered via successive task orders. • As a strategic win, it demonstrates our deep understanding of current IRS challenges and capability to support their future modernization journey. • The contract (across all awardees) has a ceiling of $2.6 billion over 7 years. The award is currently under protest with a resolution expected by mid-April 2023. Given the uncertainty, no contributions are assumed in FY23 and updates will be provided as the procurement process moves toward completion. New Wins Deliver on Strategy Future of Health Technology Modernization
| Maximus: Q1 FY23 Earnings Presentation12 Diversification and Growth Drivers • In Outside the U.S. Segment, Maximus was recently awarded new contract in the Gulf region to perform annual surveys for ~500K social welfare beneficiary households to ensure new eligibility rules are consistently applied. • Contract is for a 5-year base period worth $215 million. • Represents expansion of service into adjacent program domain where the customer has trusted Maximus for more than a decade. • As planned, the Veterans Evaluation Services (VES) business is beginning to see PACT Act-related volume, which are anticipated to sustain well into FY24 for the initial claims. • The PACT Act expands certain conditions under which Veterans would presumptively qualify for benefits resulting in increases in medical disability exam (MDE) volumes. Expanding Our Services VES
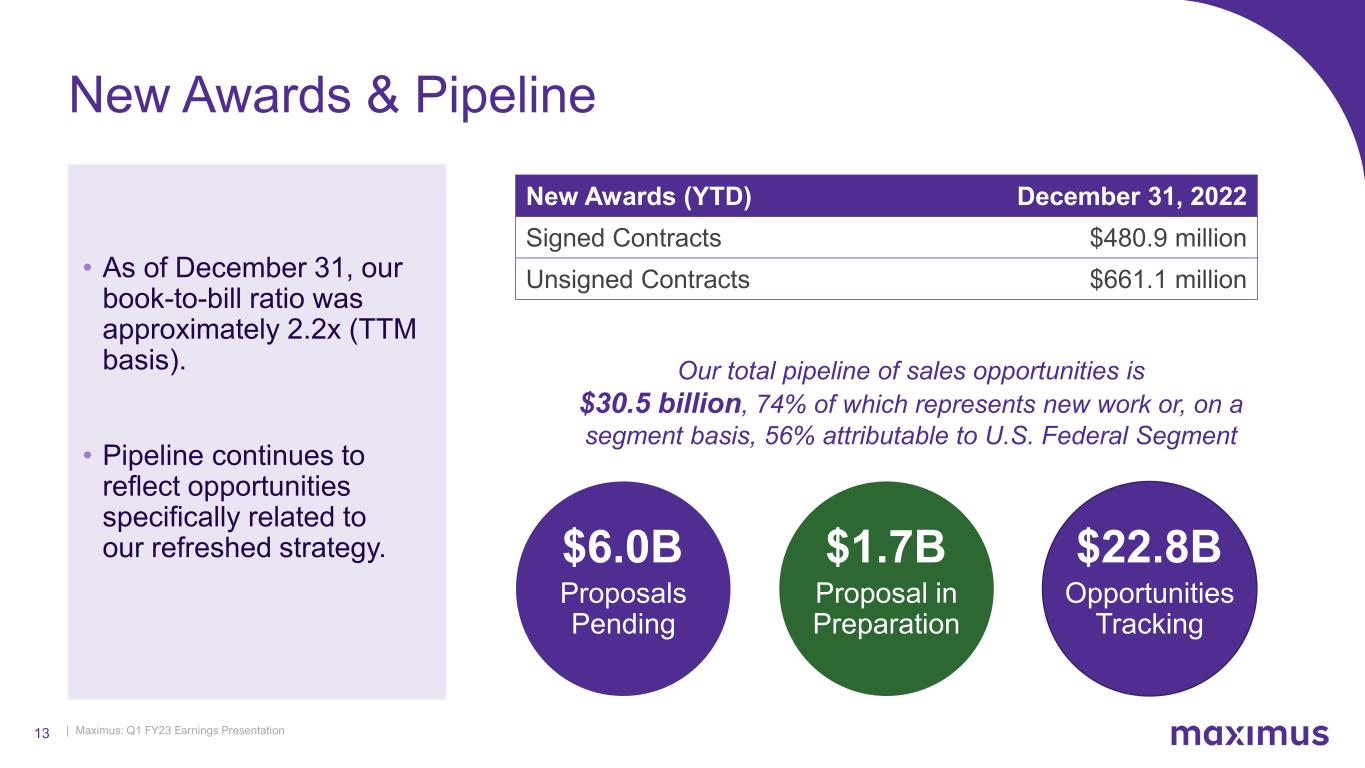
| Maximus: Q1 FY23 Earnings Presentation13 New Awards (YTD) December 31, 2022 Signed Contracts $480.9 million Unsigned Contracts $661.1 million Proposal in Preparation Opportunities Tracking New Awards & Pipeline • As of December 31, our book-to-bill ratio was approximately 2.2x (TTM basis). • Pipeline continues to reflect opportunities specifically related to our refreshed strategy. Proposals Pending $6.0B $1.7B $22.8B Our total pipeline of sales opportunities is $30.5 billion, 74% of which represents new work or, on a segment basis, 56% attributable to U.S. Federal Segment
| Maximus: Q1 FY23 Earnings Presentation14 Closing Remarks • We entered FY23 with momentum, including record backlog, healthy pipeline, strong core business delivery, minimal near-term rebid risk, and solid progress de-levering the business in a tough interest rate environment. • Building on that, we see improved visibility that previously presented the greatest forward-looking uncertainty, including the nationwide redetermination of more than 90 million individuals on Medicaid and CHIP, and evidence of PACT Act volumes ramping. • Pleased to see “green shoots” as we embrace our three-to-five-year strategic plan, including in the areas of clinical assessments and technology modernization. Scale is again building in the business, and we are executing our plans to structure the company optimally for the future and deliver on margin expectations. • Thank you to our Maximus employees for their contributions to a very successful open enrollment season for our customers, and in advance for their upcoming work on Medicaid redeterminations. We take great pride in being of service in support of some of the most critical government programs here and abroad.

| Maximus: Q1 FY23 Earnings Presentation15