
| Maximus: Q4 FY22 Earnings Presentation1 Fiscal 2022 Year End Earnings Call David Mutryn Chief Financial Officer November 22, 2022
| Maximus: Q4 FY22 Earnings Presentation2 These slides should be read in conjunction with the Company’s most recent quarterly earnings press release, along with listening to or reading a transcript of the comments of Company management from our most recent quarterly earnings conference call. This document may contain non-GAAP financial information. Management uses this information in its internal analysis of results and believes that this information may be informative to investors in gauging the quality of our financial performance, identifying trends in our results, and providing meaningful period-to-period comparisons. These measures should be used in conjunction with, rather than instead of, their comparable GAAP measures. For a reconciliation of non-GAAP measures to the comparable GAAP measures presented in this document, see the Company’s most recent quarterly earnings press release. In this presentation, we use terms such as “normalized organic growth.” We calculate this number by removing the estimated revenues from COVID-19 response work, the benefit from our acquisitions and the period-over-period currency effects from our revenue. We believe normalized organic growth allows our investors to understand the effect on our revenue and revenue growth of various key drivers whose effects will vary from year to year. It should be used to complement analysis of our revenue and revenue growth. Included in this presentation are forward-looking statements within the meaning of the safe harbor provisions of the United States Private Securities Litigation Reform Act of 1995. Forward-looking statements can be identified by words such as: "anticipate," "intend," "plan," "goal," "seek," "opportunity," "could," "potential," "believe," "project," "estimate," "expect," "forecast," "strategy," "future," "likely," "may," "should," "will," and similar references to future periods. Forward-looking statements that are not historical facts, including statements about our confidence, strategies and initiatives and our expectations about revenues, results of operations, profitability, liquidity, market demand or the impact of the pandemic are forward-looking statements that involve risks and uncertainties such as those related to the impact of the pandemic and our recently-completed acquisitions. These risks could cause the Company’s actual results to differ materially from those indicated by such forward-looking statements. A summary of risk factors can be found in Item 1A, "Risk Factors" in our Annual Report on Form 10-K for the year ended September 30, 2022, which will be filed with the Securities and Exchange Commission (SEC) on November 22, 2022. Any forward-looking statement made by us in this report is based only on information currently available to us and speaks only as of the date on which it is made. We undertake no obligation to publicly update any forward-looking statement, whether written or oral, that may be made from time to time, whether as a result of new information, future developments or otherwise. Throughout this presentation, numbers may not add due to rounding. Forward-looking Statements & Non-GAAP Information
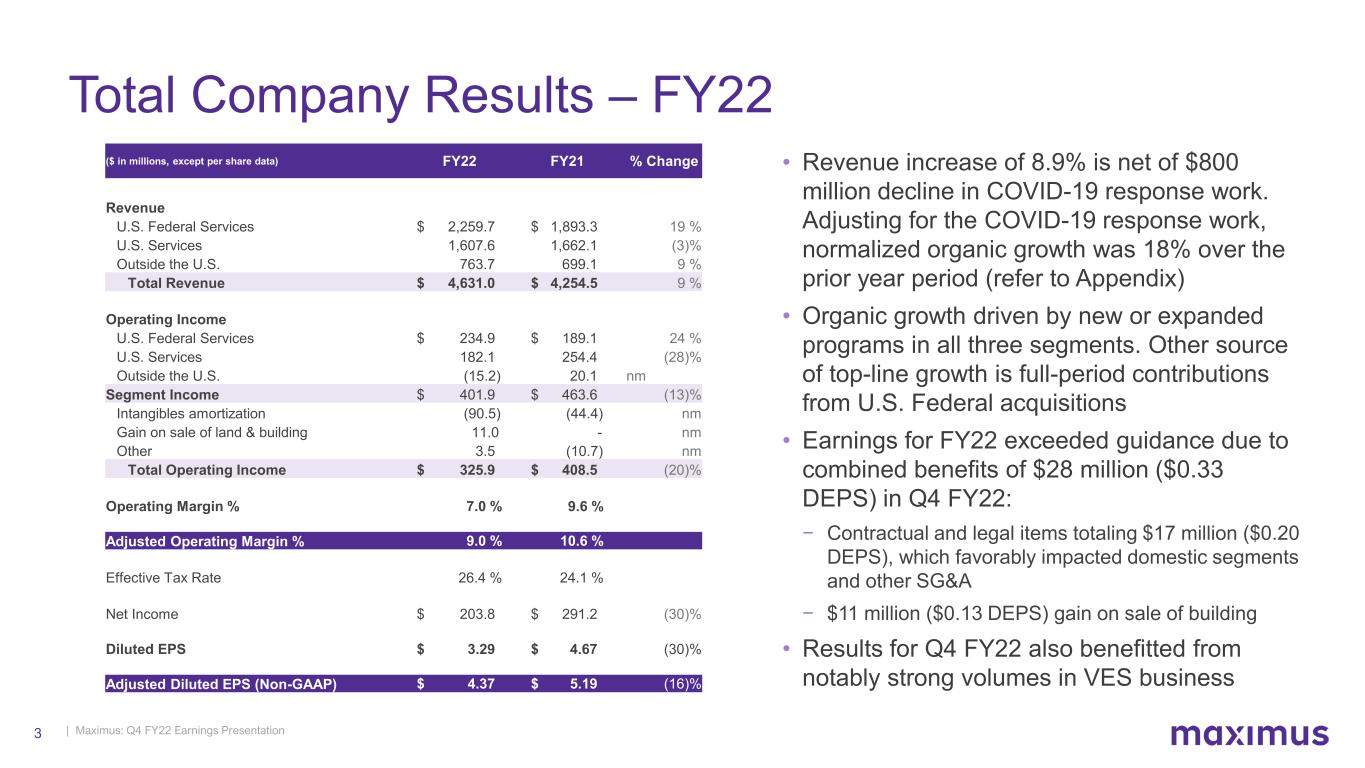
| Maximus: Q4 FY22 Earnings Presentation3 • Revenue increase of 8.9% is net of $800 million decline in COVID-19 response work. Adjusting for the COVID-19 response work, normalized organic growth was 18% over the prior year period (refer to Appendix) • Organic growth driven by new or expanded programs in all three segments. Other source of top-line growth is full-period contributions from U.S. Federal acquisitions • Earnings for FY22 exceeded guidance due to combined benefits of $28 million ($0.33 DEPS) in Q4 FY22: − Contractual and legal items totaling $17 million ($0.20 DEPS), which favorably impacted domestic segments and other SG&A − $11 million ($0.13 DEPS) gain on sale of building • Results for Q4 FY22 also benefitted from notably strong volumes in VES business Total Company Results – FY22 ($ in millions, except per share data) FY22 FY21 % Change Revenue U.S. Federal Services $ 2,259.7 $ 1,893.3 19 % U.S. Services 1,607.6 1,662.1 (3)% Outside the U.S. 763.7 699.1 9 % Total Revenue $ 4,631.0 $ 4,254.5 9 % Operating Income U.S. Federal Services $ 234.9 $ 189.1 24 % U.S. Services 182.1 254.4 (28)% Outside the U.S. (15.2) 20.1 nm Segment Income $ 401.9 $ 463.6 (13)% Intangibles amortization (90.5) (44.4) nm Gain on sale of land & building 11.0 - nm Other 3.5 (10.7) nm Total Operating Income $ 325.9 $ 408.5 (20)% Operating Margin % 7.0 % 9.6 % Adjusted Operating Margin % 9.0 % 10.6 % Effective Tax Rate 26.4 % 24.1 % Net Income $ 203.8 $ 291.2 (30)% Diluted EPS $ 3.29 $ 4.67 (30)% Adjusted Diluted EPS (Non-GAAP) $ 4.37 $ 5.19 (16)%
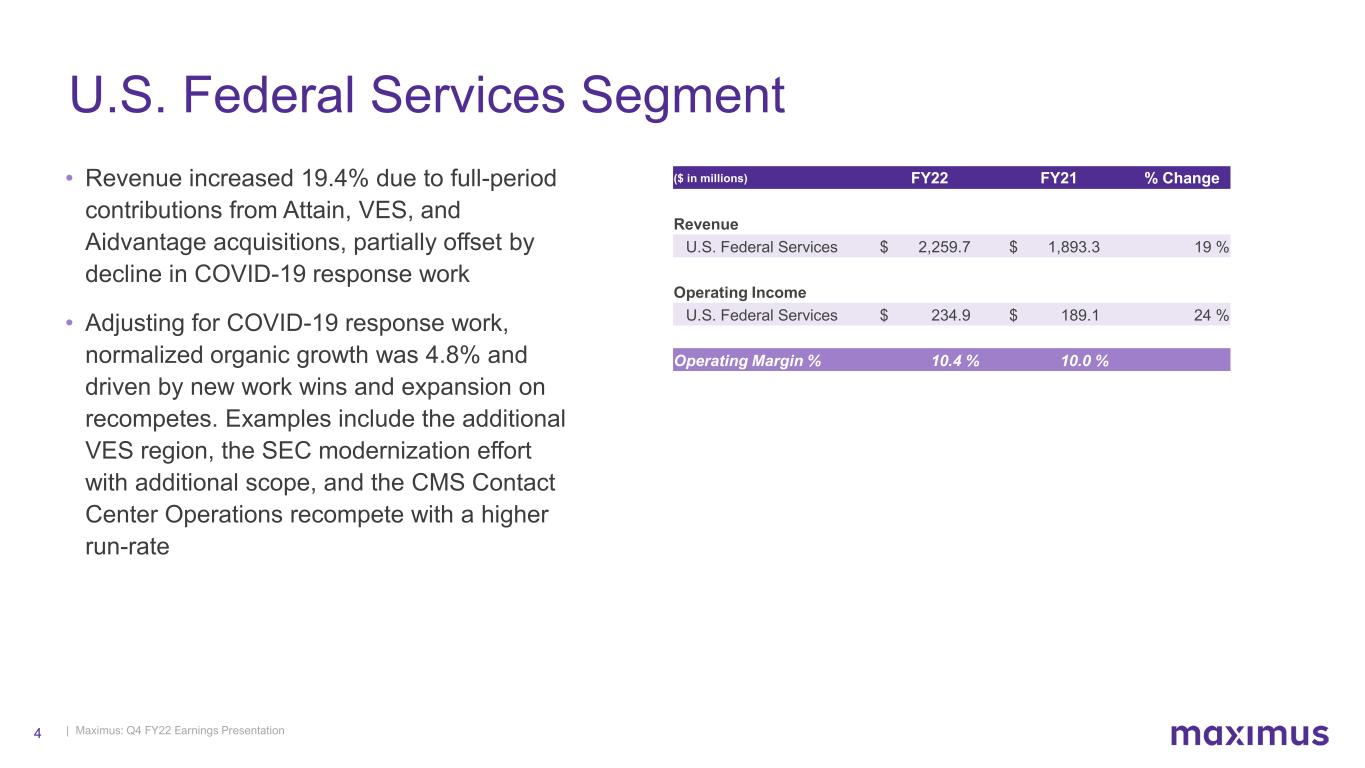
| Maximus: Q4 FY22 Earnings Presentation4 U.S. Federal Services Segment • Revenue increased 19.4% due to full-period contributions from Attain, VES, and Aidvantage acquisitions, partially offset by decline in COVID-19 response work • Adjusting for COVID-19 response work, normalized organic growth was 4.8% and driven by new work wins and expansion on recompetes. Examples include the additional VES region, the SEC modernization effort with additional scope, and the CMS Contact Center Operations recompete with a higher run-rate ($ in millions) FY22 FY21 % Change Revenue U.S. Federal Services $ 2,259.7 $ 1,893.3 19 % Operating Income U.S. Federal Services $ 234.9 $ 189.1 24 % Operating Margin % 10.4 % 10.0 %
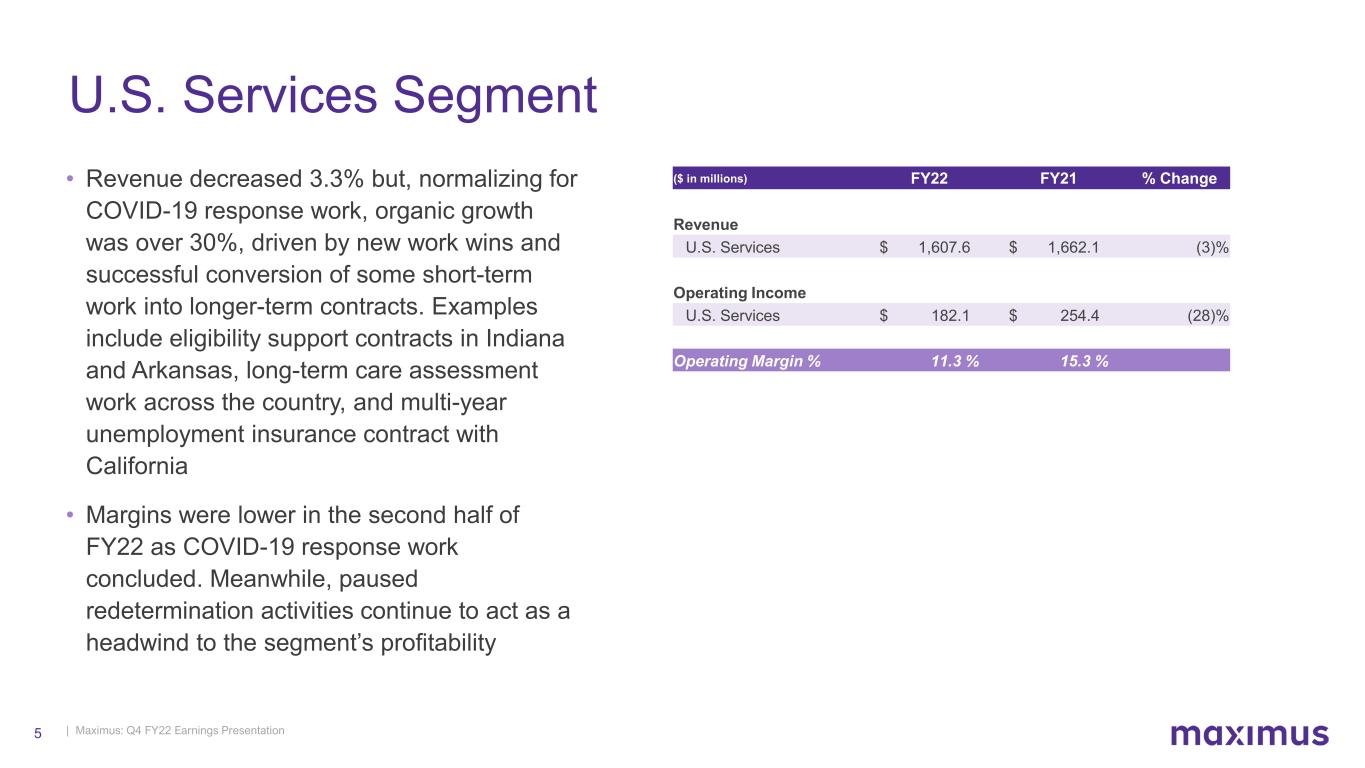
| Maximus: Q4 FY22 Earnings Presentation5 • Revenue decreased 3.3% but, normalizing for COVID-19 response work, organic growth was over 30%, driven by new work wins and successful conversion of some short-term work into longer-term contracts. Examples include eligibility support contracts in Indiana and Arkansas, long-term care assessment work across the country, and multi-year unemployment insurance contract with California • Margins were lower in the second half of FY22 as COVID-19 response work concluded. Meanwhile, paused redetermination activities continue to act as a headwind to the segment’s profitability U.S. Services Segment ($ in millions) FY22 FY21 % Change Revenue U.S. Services $ 1,607.6 $ 1,662.1 (3)% Operating Income U.S. Services $ 182.1 $ 254.4 (28)% Operating Margin % 11.3 % 15.3 %
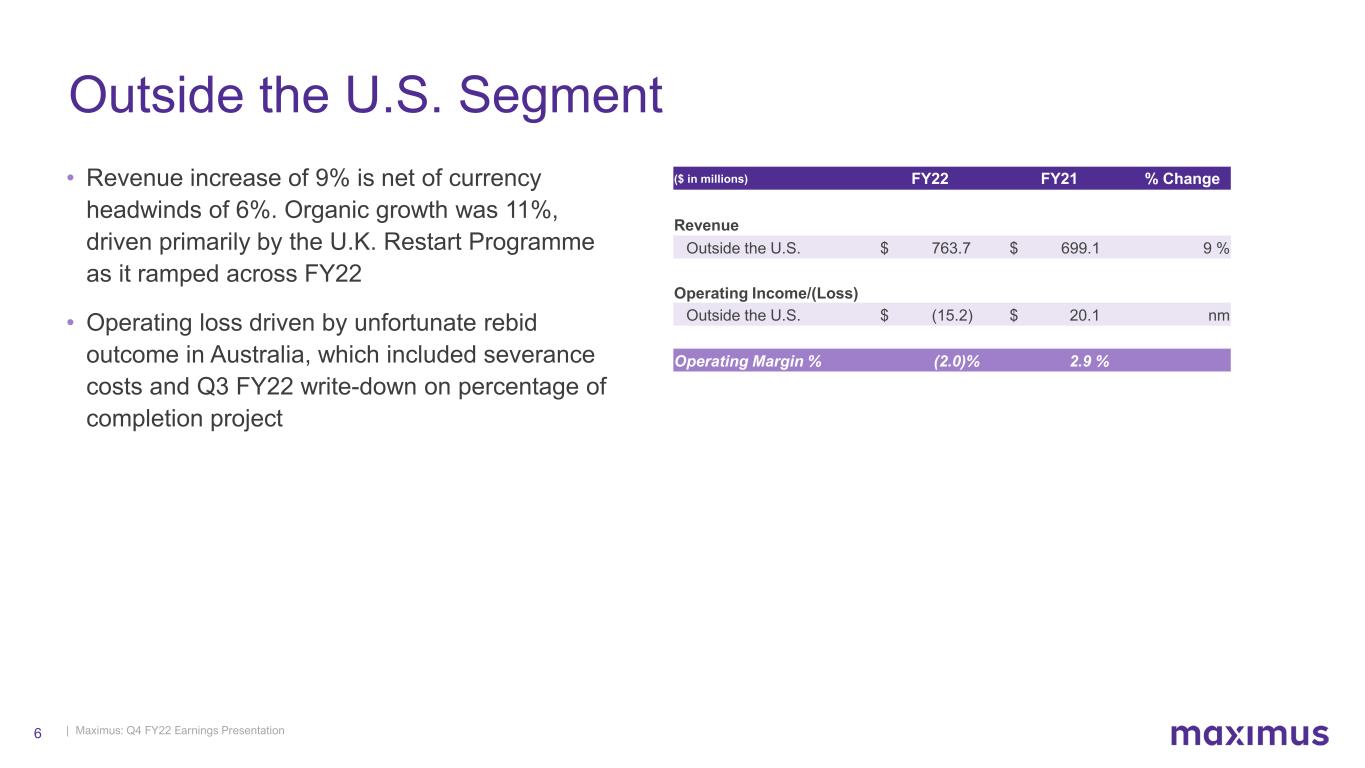
| Maximus: Q4 FY22 Earnings Presentation6 • Revenue increase of 9% is net of currency headwinds of 6%. Organic growth was 11%, driven primarily by the U.K. Restart Programme as it ramped across FY22 • Operating loss driven by unfortunate rebid outcome in Australia, which included severance costs and Q3 FY22 write-down on percentage of completion project Outside the U.S. Segment ($ in millions) FY22 FY21 % Change Revenue Outside the U.S. $ 763.7 $ 699.1 9 % Operating Income/(Loss) Outside the U.S. $ (15.2) $ 20.1 nm Operating Margin % (2.0)% 2.9 %
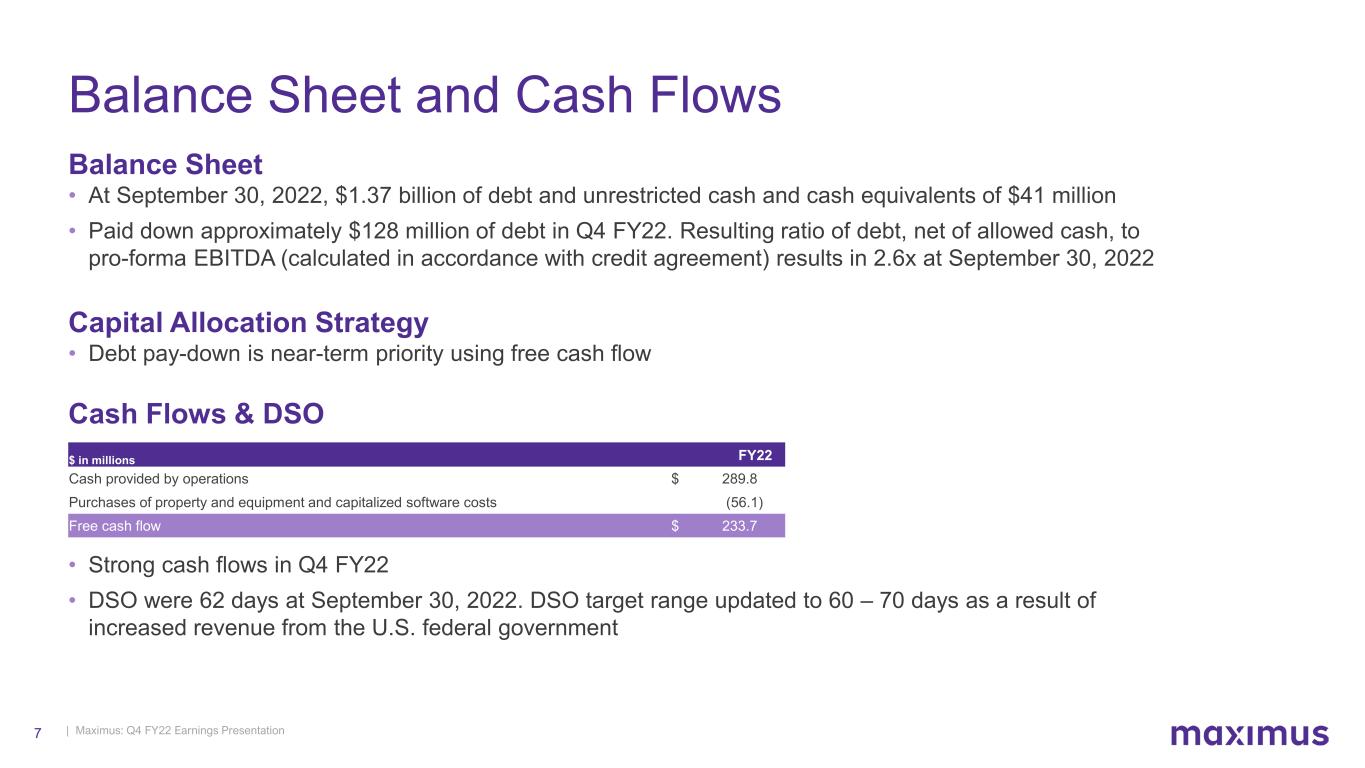
| Maximus: Q4 FY22 Earnings Presentation7 Balance Sheet and Cash Flows Balance Sheet • At September 30, 2022, $1.37 billion of debt and unrestricted cash and cash equivalents of $41 million • Paid down approximately $128 million of debt in Q4 FY22. Resulting ratio of debt, net of allowed cash, to pro-forma EBITDA (calculated in accordance with credit agreement) results in 2.6x at September 30, 2022 Capital Allocation Strategy • Debt pay-down is near-term priority using free cash flow Cash Flows & DSO • Strong cash flows in Q4 FY22 • DSO were 62 days at September 30, 2022. DSO target range updated to 60 – 70 days as a result of increased revenue from the U.S. federal government $ in millions FY22 Cash provided by operations $ 289.8 Purchases of property and equipment and capitalized software costs (56.1) Free cash flow $ 233.7
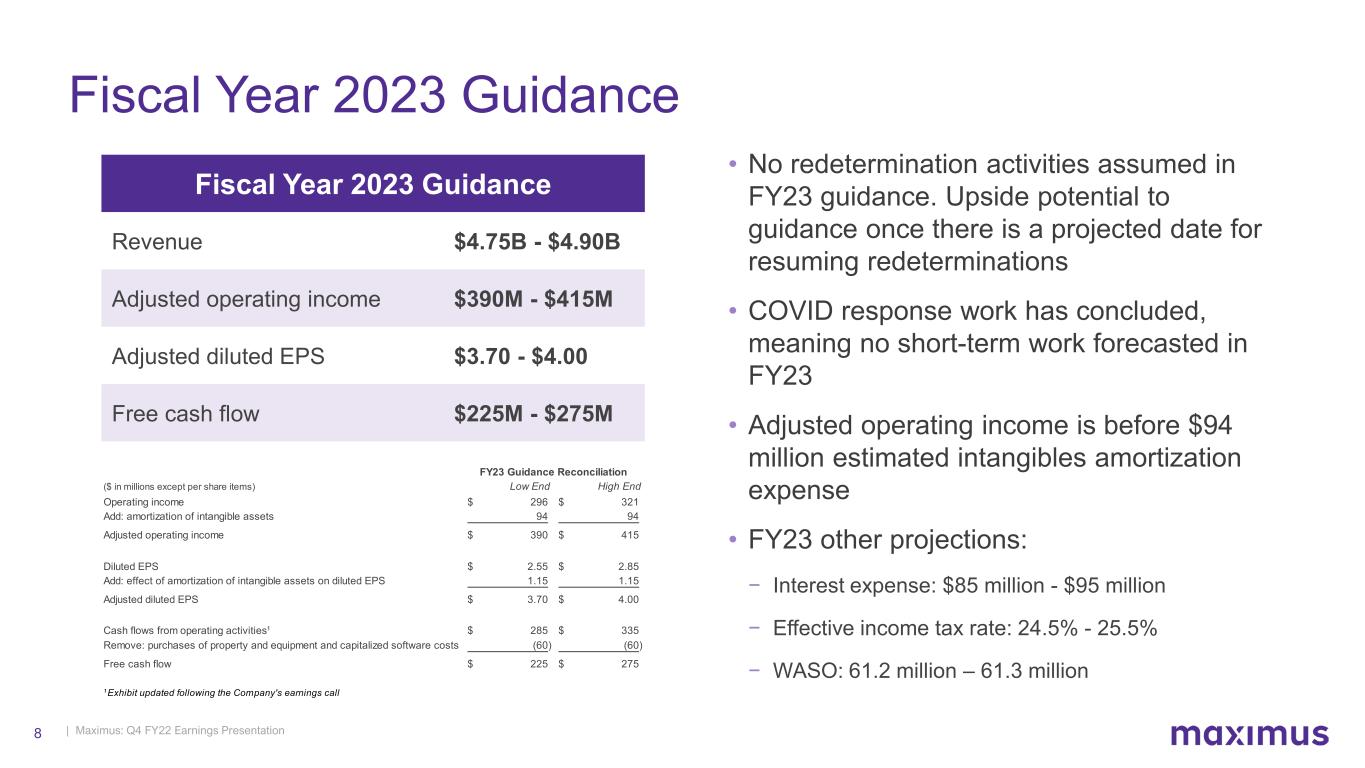
| Maximus: Q4 FY22 Earnings Presentation8 Fiscal Year 2023 Guidance Fiscal Year 2023 Guidance Revenue $4.75B - $4.90B Adjusted operating income $390M - $415M Adjusted diluted EPS $3.70 - $4.00 Free cash flow $225M - $275M • No redetermination activities assumed in FY23 guidance. Upside potential to guidance once there is a projected date for resuming redeterminations • COVID response work has concluded, meaning no short-term work forecasted in FY23 • Adjusted operating income is before $94 million estimated intangibles amortization expense • FY23 other projections: − Interest expense: $85 million - $95 million − Effective income tax rate: 24.5% - 25.5% − WASO: 61.2 million – 61.3 million ($ in millions except per share items) Low End High End Operating income 296$ 321$ Add: amortization of intangible assets 94 94 Adjusted operating income 390$ 415$ Diluted EPS 2.55$ 2.85$ Add: effect of amortization of intangible assets on diluted EPS 1.15 1.15 Adjusted diluted EPS 3.70$ 4.00$ Cash flows from operating activities¹ 285$ 335$ Remove: purchases of property and equipment and capitalized software costs (60) (60) Free cash flow 225$ 275$ ¹ Exhibit updated following the Company's earnings call FY23 Guidance Reconciliation
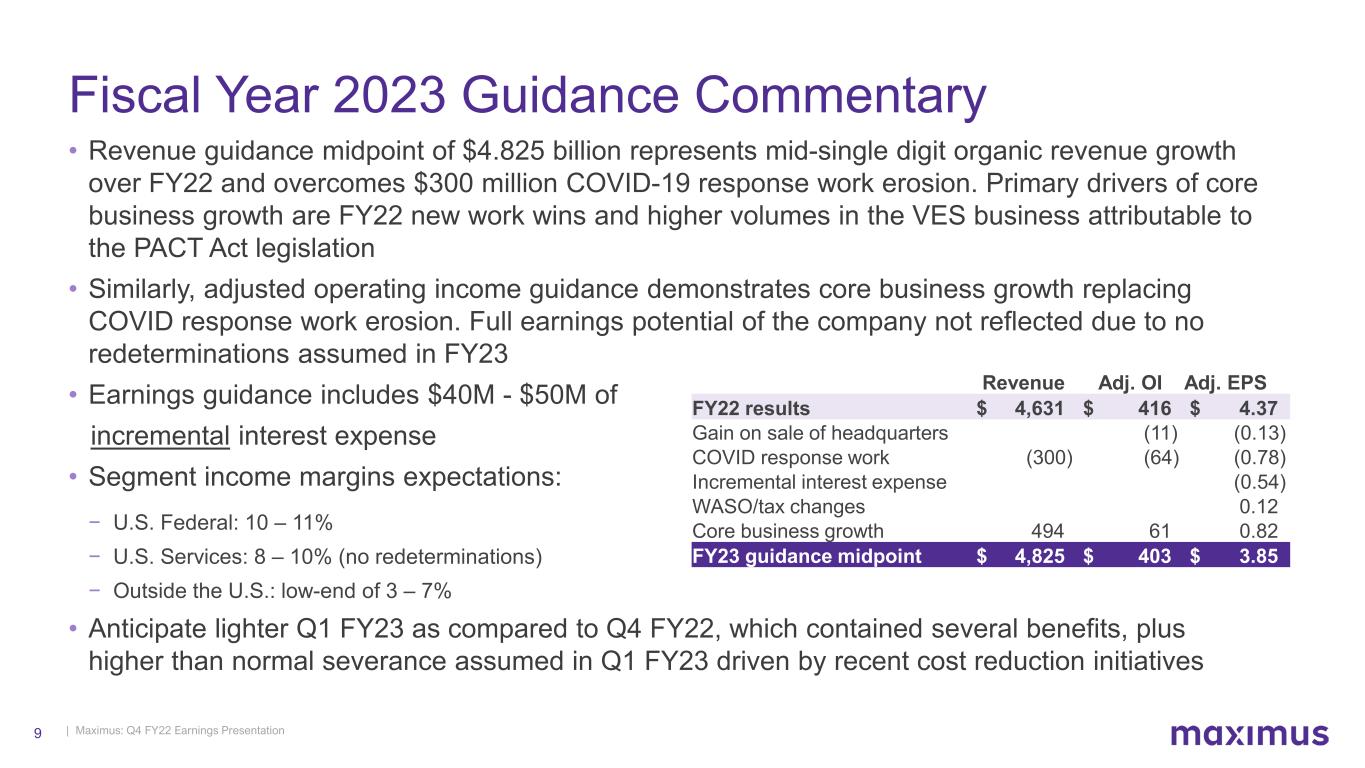
| Maximus: Q4 FY22 Earnings Presentation9 Fiscal Year 2023 Guidance Commentary • Revenue guidance midpoint of $4.825 billion represents mid-single digit organic revenue growth over FY22 and overcomes $300 million COVID-19 response work erosion. Primary drivers of core business growth are FY22 new work wins and higher volumes in the VES business attributable to the PACT Act legislation • Similarly, adjusted operating income guidance demonstrates core business growth replacing COVID response work erosion. Full earnings potential of the company not reflected due to no redeterminations assumed in FY23 • Earnings guidance includes $40M - $50M of incremental interest expense • Segment income margins expectations: − U.S. Federal: 10 – 11% − U.S. Services: 8 – 10% (no redeterminations) − Outside the U.S.: low-end of 3 – 7% • Anticipate lighter Q1 FY23 as compared to Q4 FY22, which contained several benefits, plus higher than normal severance assumed in Q1 FY23 driven by recent cost reduction initiatives Revenue Adj. OI Adj. EPS FY22 results $ 4,631 $ 416 $ 4.37 Gain on sale of headquarters (11) (0.13) COVID response work (300) (64) (0.78) Incremental interest expense (0.54) WASO/tax changes 0.12 Core business growth 494 61 0.82 FY23 guidance midpoint $ 4,825 $ 403 $ 3.85

| Maximus: Q4 FY22 Earnings Presentation10 Fiscal 2022 Year End Earnings Call 10 Bruce Caswell President & Chief Executive Officer November 22, 2022
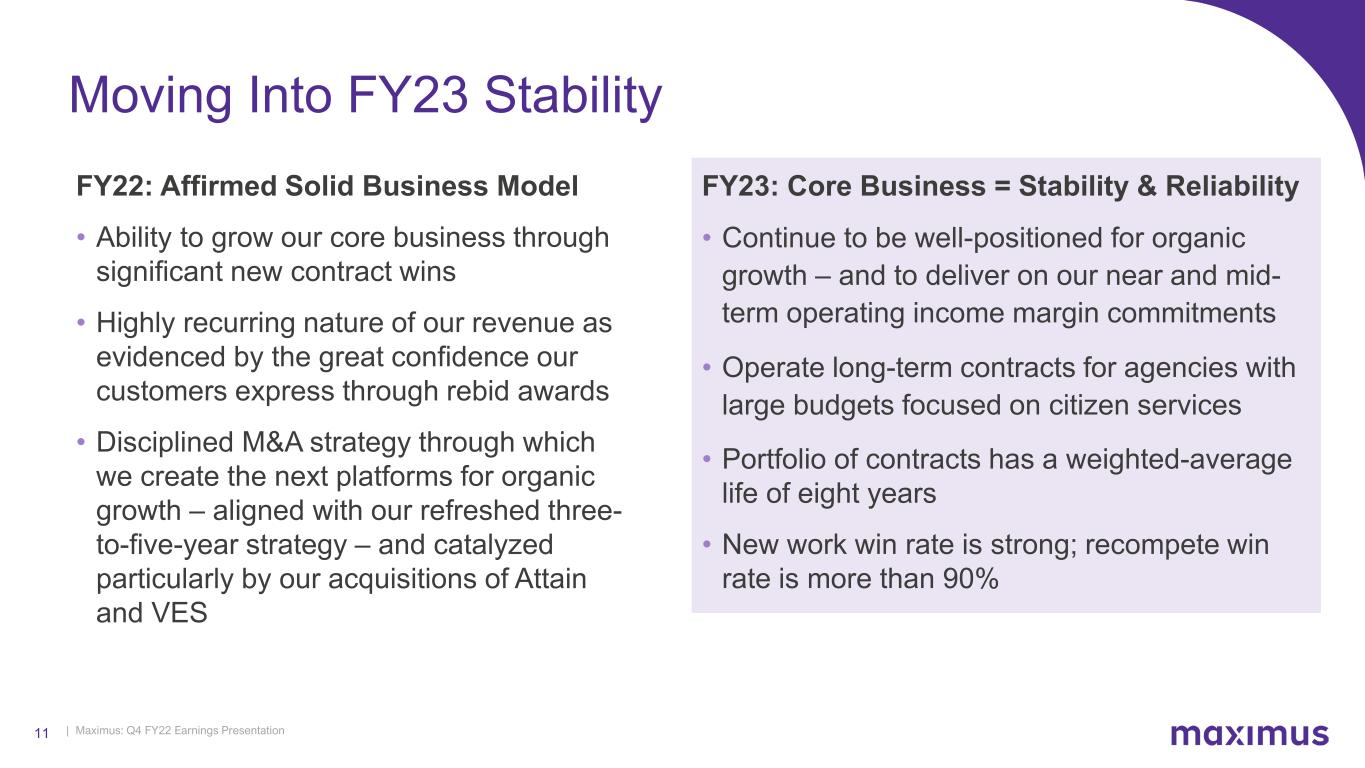
| Maximus: Q4 FY22 Earnings Presentation11 FY23: Core Business = Stability & Reliability • Continue to be well-positioned for organic growth – and to deliver on our near and mid- term operating income margin commitments • Operate long-term contracts for agencies with large budgets focused on citizen services • Portfolio of contracts has a weighted-average life of eight years • New work win rate is strong; recompete win rate is more than 90% FY22: Affirmed Solid Business Model • Ability to grow our core business through significant new contract wins • Highly recurring nature of our revenue as evidenced by the great confidence our customers express through rebid awards • Disciplined M&A strategy through which we create the next platforms for organic growth – aligned with our refreshed three- to-five-year strategy – and catalyzed particularly by our acquisitions of Attain and VES Moving Into FY23 Stability
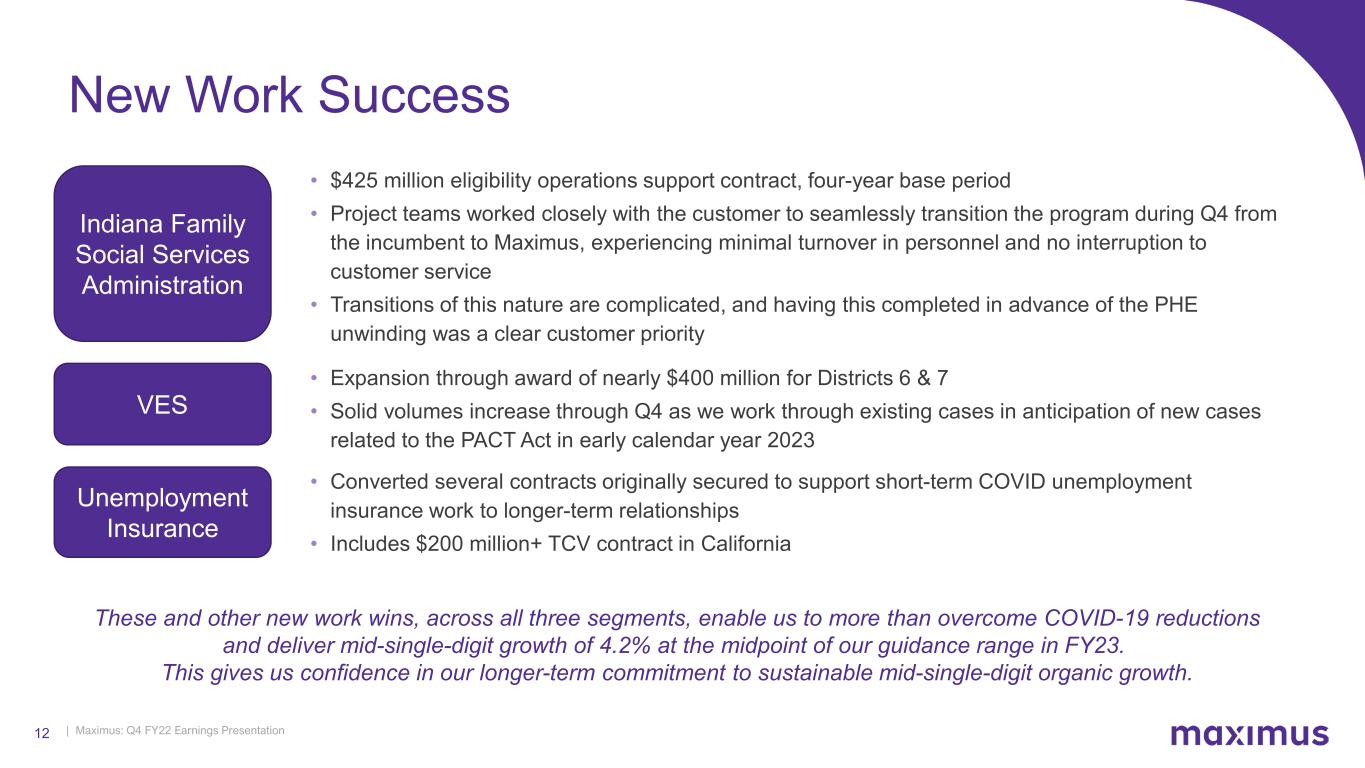
| Maximus: Q4 FY22 Earnings Presentation12 New Work Success • $425 million eligibility operations support contract, four-year base period • Project teams worked closely with the customer to seamlessly transition the program during Q4 from the incumbent to Maximus, experiencing minimal turnover in personnel and no interruption to customer service • Transitions of this nature are complicated, and having this completed in advance of the PHE unwinding was a clear customer priority Indiana Family Social Services Administration VES • Expansion through award of nearly $400 million for Districts 6 & 7 • Solid volumes increase through Q4 as we work through existing cases in anticipation of new cases related to the PACT Act in early calendar year 2023 Unemployment Insurance • Converted several contracts originally secured to support short-term COVID unemployment insurance work to longer-term relationships • Includes $200 million+ TCV contract in California These and other new work wins, across all three segments, enable us to more than overcome COVID-19 reductions and deliver mid-single-digit growth of 4.2% at the midpoint of our guidance range in FY23. This gives us confidence in our longer-term commitment to sustainable mid-single-digit organic growth.
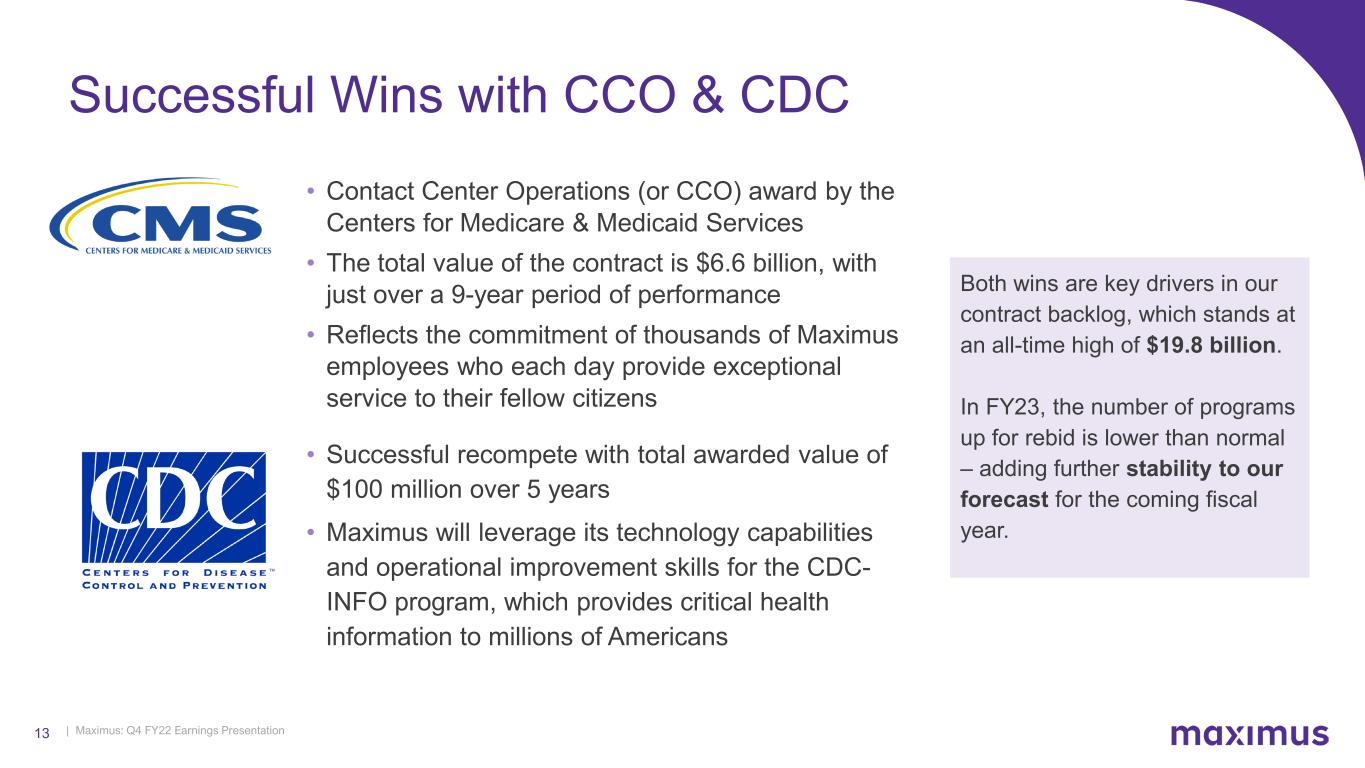
| Maximus: Q4 FY22 Earnings Presentation13 Successful Wins with CCO & CDC • Contact Center Operations (or CCO) award by the Centers for Medicare & Medicaid Services • The total value of the contract is $6.6 billion, with just over a 9-year period of performance • Reflects the commitment of thousands of Maximus employees who each day provide exceptional service to their fellow citizens Both wins are key drivers in our contract backlog, which stands at an all-time high of $19.8 billion. In FY23, the number of programs up for rebid is lower than normal – adding further stability to our forecast for the coming fiscal year. • Successful recompete with total awarded value of $100 million over 5 years • Maximus will leverage its technology capabilities and operational improvement skills for the CDC- INFO program, which provides critical health information to millions of Americans
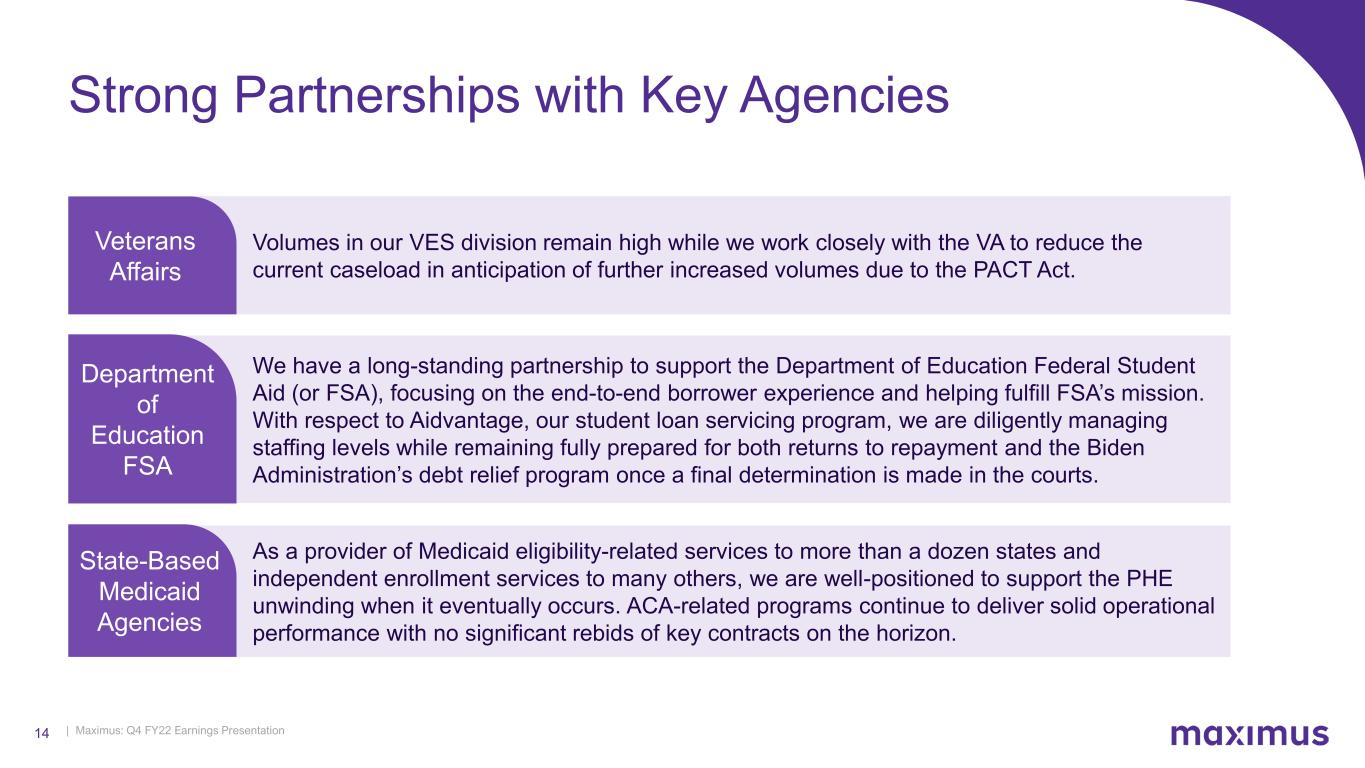
| Maximus: Q4 FY22 Earnings Presentation14 Strong Partnerships with Key Agencies Volumes in our VES division remain high while we work closely with the VA to reduce the current caseload in anticipation of further increased volumes due to the PACT Act. Veterans Affairs We have a long-standing partnership to support the Department of Education Federal Student Aid (or FSA), focusing on the end-to-end borrower experience and helping fulfill FSA’s mission. With respect to Aidvantage, our student loan servicing program, we are diligently managing staffing levels while remaining fully prepared for both returns to repayment and the Biden Administration’s debt relief program once a final determination is made in the courts. Department of Education FSA As a provider of Medicaid eligibility-related services to more than a dozen states and independent enrollment services to many others, we are well-positioned to support the PHE unwinding when it eventually occurs. ACA-related programs continue to deliver solid operational performance with no significant rebids of key contracts on the horizon. State-Based Medicaid Agencies
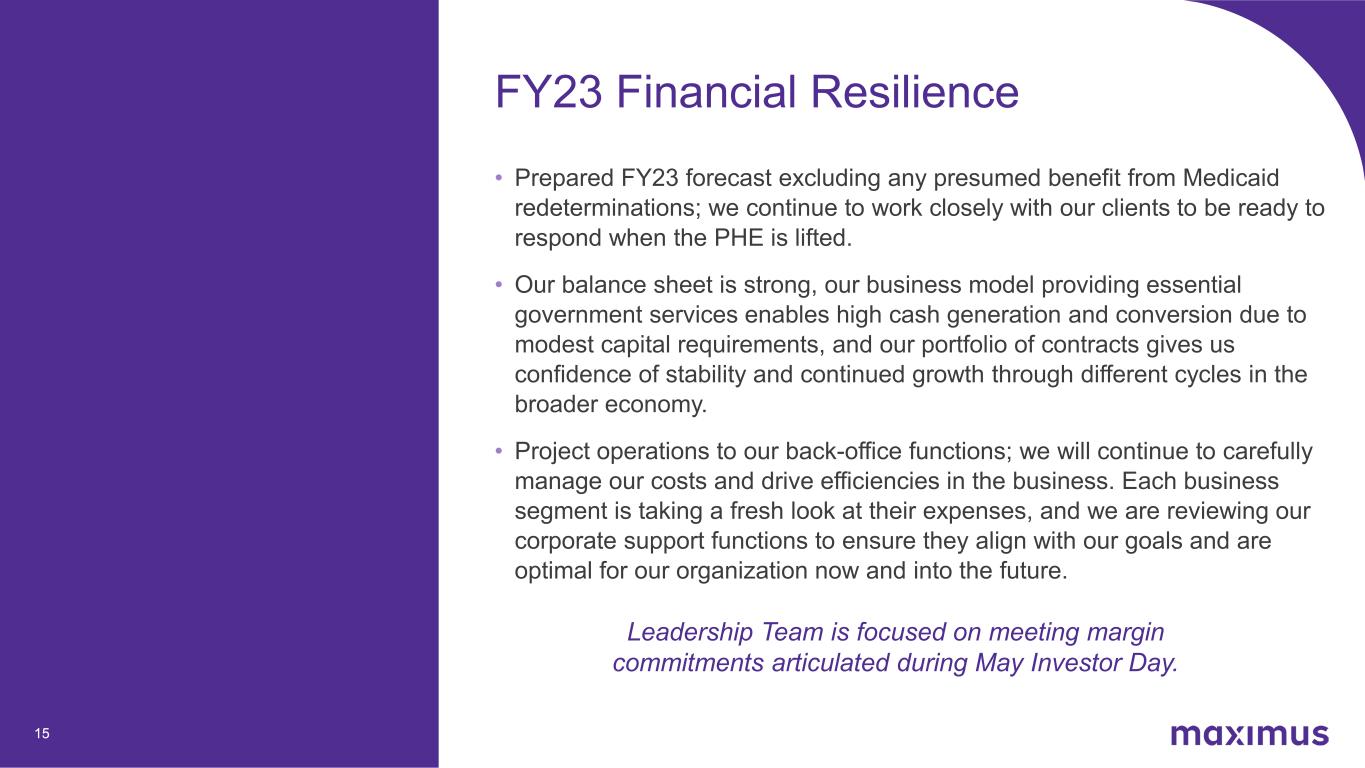
| Maximus: Q4 FY22 Earnings Presentation15 • Prepared FY23 forecast excluding any presumed benefit from Medicaid redeterminations; we continue to work closely with our clients to be ready to respond when the PHE is lifted. • Our balance sheet is strong, our business model providing essential government services enables high cash generation and conversion due to modest capital requirements, and our portfolio of contracts gives us confidence of stability and continued growth through different cycles in the broader economy. • Project operations to our back-office functions; we will continue to carefully manage our costs and drive efficiencies in the business. Each business segment is taking a fresh look at their expenses, and we are reviewing our corporate support functions to ensure they align with our goals and are optimal for our organization now and into the future. FY23 Financial Resilience Leadership Team is focused on meeting margin commitments articulated during May Investor Day.
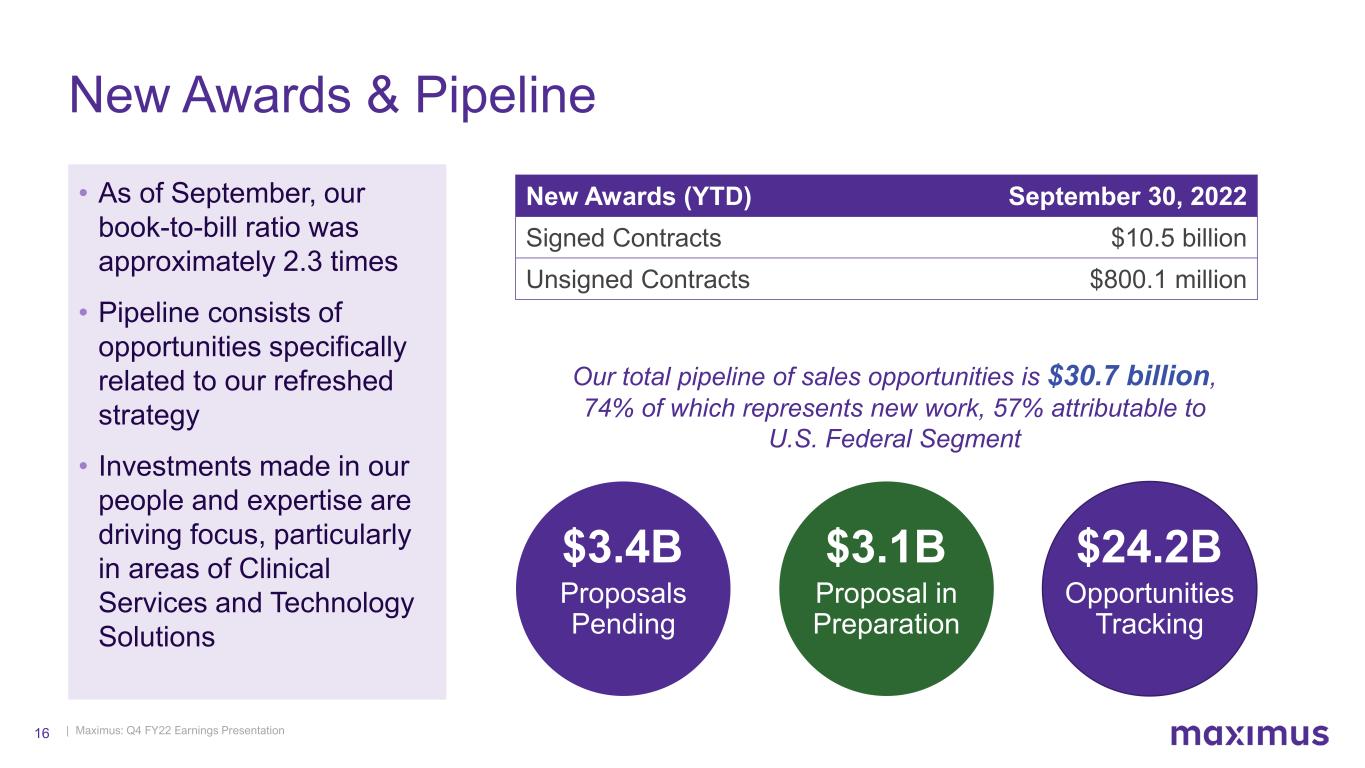
| Maximus: Q4 FY22 Earnings Presentation16 New Awards (YTD) September 30, 2022 Signed Contracts $10.5 billion Unsigned Contracts $800.1 million • As of September, our book-to-bill ratio was approximately 2.3 times • Pipeline consists of opportunities specifically related to our refreshed strategy • Investments made in our people and expertise are driving focus, particularly in areas of Clinical Services and Technology Solutions Proposals Pending Proposal in Preparation Opportunities Tracking New Awards & Pipeline $3.4B $3.1B $24.2B Our total pipeline of sales opportunities is $30.7 billion, 74% of which represents new work, 57% attributable to U.S. Federal Segment
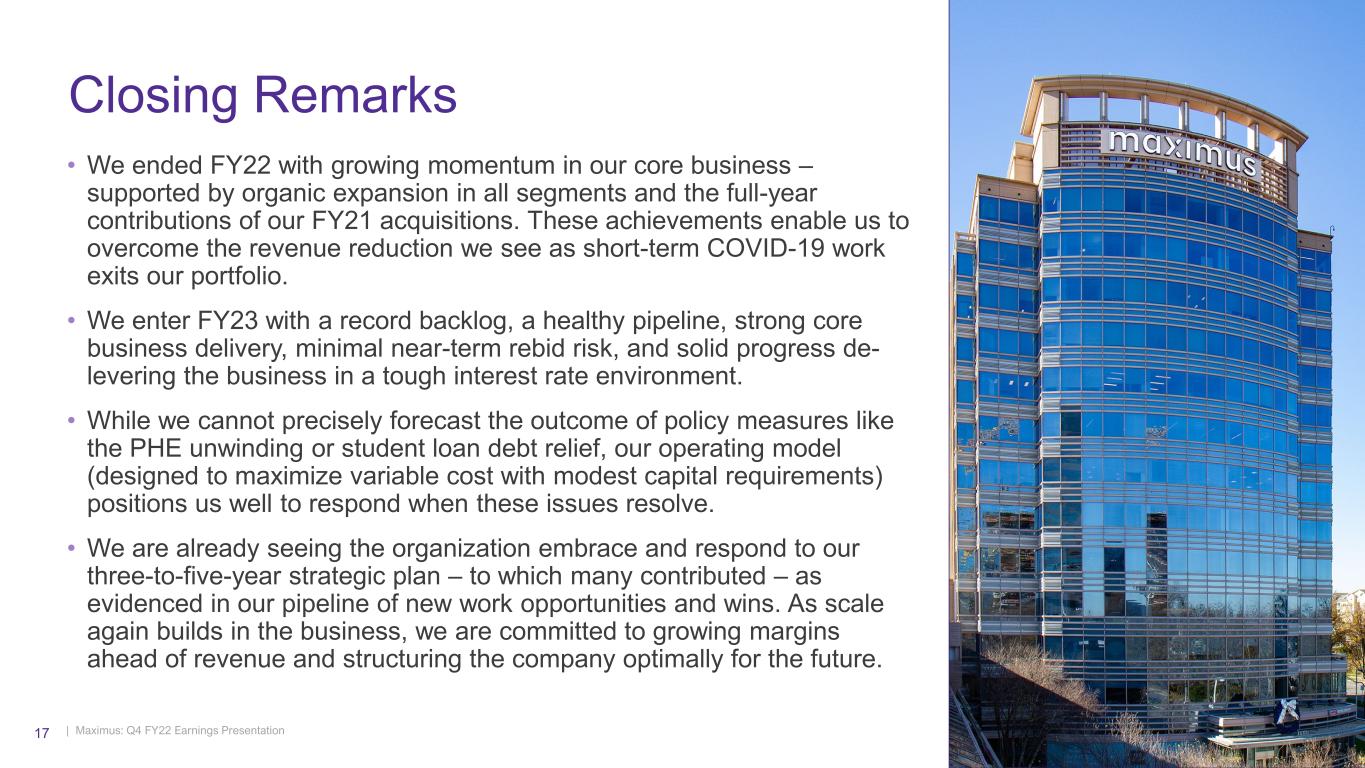
| Maximus: Q4 FY22 Earnings Presentation17 Closing Remarks • We ended FY22 with growing momentum in our core business – supported by organic expansion in all segments and the full-year contributions of our FY21 acquisitions. These achievements enable us to overcome the revenue reduction we see as short-term COVID-19 work exits our portfolio. • We enter FY23 with a record backlog, a healthy pipeline, strong core business delivery, minimal near-term rebid risk, and solid progress de- levering the business in a tough interest rate environment. • While we cannot precisely forecast the outcome of policy measures like the PHE unwinding or student loan debt relief, our operating model (designed to maximize variable cost with modest capital requirements) positions us well to respond when these issues resolve. • We are already seeing the organization embrace and respond to our three-to-five-year strategic plan – to which many contributed – as evidenced in our pipeline of new work opportunities and wins. As scale again builds in the business, we are committed to growing margins ahead of revenue and structuring the company optimally for the future.

| Maximus: Q4 FY22 Earnings Presentation18 APPENDIX
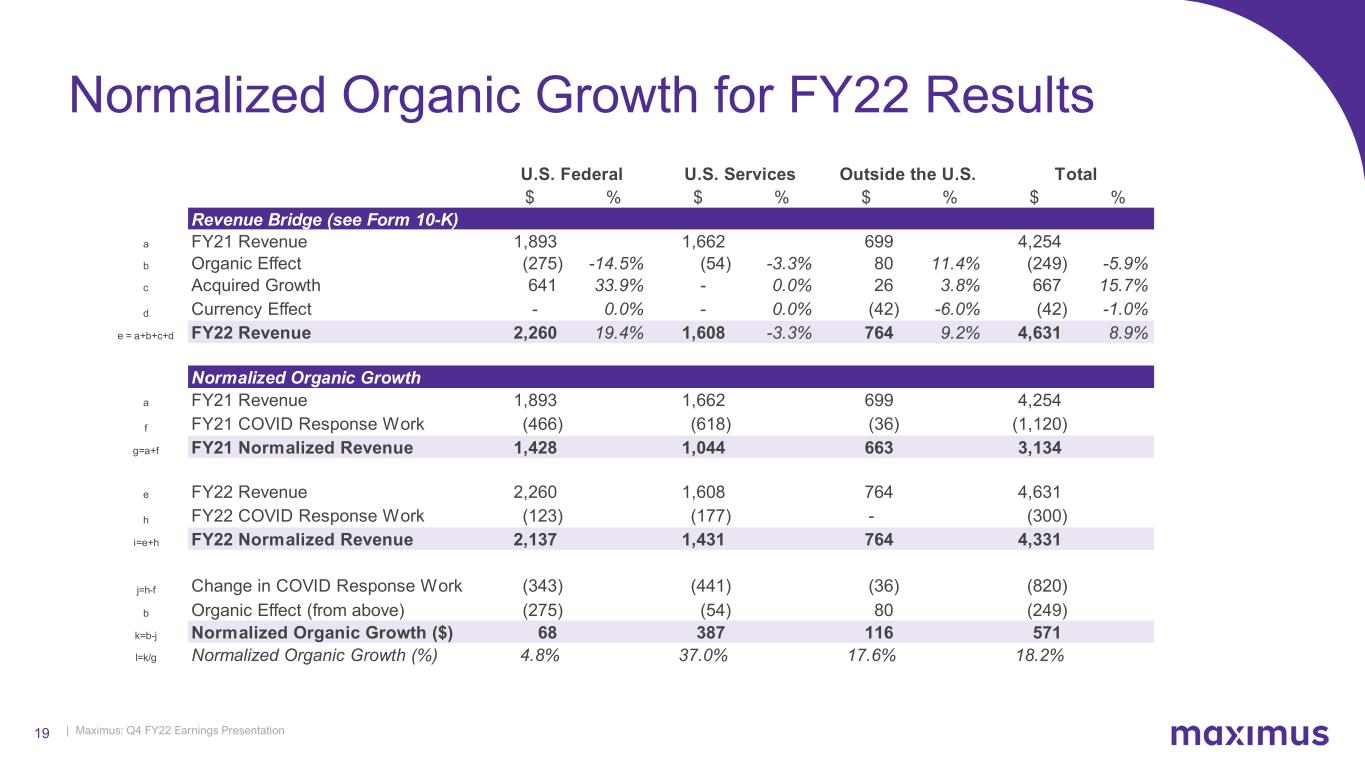
| Maximus: Q4 FY22 Earnings Presentation19 Normalized Organic Growth for FY22 Results $ % $ % $ % $ % Revenue Bridge (see Form 10-K) a FY21 Revenue 1,893 1,662 699 4,254 b Organic Effect (275) -14.5% (54) -3.3% 80 11.4% (249) -5.9% c Acquired Growth 641 33.9% - 0.0% 26 3.8% 667 15.7% d Currency Effect - 0.0% - 0.0% (42) -6.0% (42) -1.0% e = a+b+c+d FY22 Revenue 2,260 19.4% 1,608 -3.3% 764 9.2% 4,631 8.9% Normalized Organic Growth a FY21 Revenue 1,893 1,662 699 4,254 f FY21 COVID Response Work (466) (618) (36) (1,120) g=a+f FY21 Normalized Revenue 1,428 1,044 663 3,134 e FY22 Revenue 2,260 1,608 764 4,631 h FY22 COVID Response Work (123) (177) - (300) i=e+h FY22 Normalized Revenue 2,137 1,431 764 4,331 j=h-f Change in COVID Response Work (343) (441) (36) (820) b Organic Effect (from above) (275) (54) 80 (249) k=b-j Normalized Organic Growth ($) 68 387 116 571 l=k/g Normalized Organic Growth (%) 4.8% 37.0% 17.6% 18.2% TotalU.S. ServicesU.S. Federal Outside the U.S.

| Maximus: Q4 FY22 Earnings Presentation20