
1 | Maximus: Q4 FY21 Earnings Presentation Rick Nadeau Chief Financial Officer David Mutryn Senior Vice President, Finance Fiscal 2021 Year End Earnings Call November 18, 2021
2 | Maximus: Q4 FY21 Earnings Presentation These slides should be read in conjunction with the Company’s most recent quarterly earnings press release, along with listening to or reading a transcript of the comments of Company management from our most recent quarterly earnings conference call. This document may contain non-GAAP financial information. Management uses this information in its internal analysis of results and believes that this information may be informative to investors in gauging the quality of our financial performance, identifying trends in our results, and providing meaningful period-to-period comparisons. These measures should be used in conjunction with, rather than instead of, their comparable GAAP measures. For a reconciliation of non-GAAP measures to the comparable GAAP measures presented in this document, see the Company’s most recent quarterly earnings press release. In this presentation, we use terms such as “normalized organic growth.” We calculate this number by removing the effects of the U.S. Census contract, the estimated revenues from COVID-19 response work, the benefit from our acquisitions and the period-over-period currency effects from our revenue. We have provided a reconciliation from our reported and forecasted revenue to normalized organic growth. We believe normalized organic growth allows our investors to understand the effect on our revenue and revenue growth of various key drivers whose effects will vary from year to year. It should be used to complement analysis of our revenue and revenue growth. Included in this presentation are forward-looking statements within the meaning of the safe harbor provisions of the United States Private Securities Litigation Reform Act of 1995. Forward-looking statements can be identified by words such as: “anticipate,” “intend,” “plan,” “goal,” “seek,” “opportunity,” “could,” “potential,” “believe,” “project,” “estimate,” “expect,” “strategy,” “future,” “likely,” “may,” “should,” “will,” and similar references to future periods. Forward-looking statements that are not historical facts, including statements about our confidence, strategies and initiatives and our expectations about revenues, results of operations, profitability, liquidity, market demand or the impact of the pandemic are forward-looking statements that involve risks and uncertainties such as those related to the impact of the pandemic and our recently-completed acquisitions. These risks could cause the Company’s actual results to differ materially from those indicated by such forward-looking statements. A summary of risk factors can be found in Item 1A, "Risk Factors" in our Annual Report on Form 10-K for the year ended September 30, 2021, which will be filed with the Securities and Exchange Commission (SEC) on November 18, 2021. Any forward-looking statement made by us in this report is based only on information currently available to us and speaks only as of the date on which it is made. We undertake no obligation to publicly update any forward-looking statement, whether written or oral, that may be made from time to time, whether as a result of new information, future developments or otherwise. Throughout this presentation, numbers may not add due to rounding. Forward-looking Statements & Non-GAAP Information
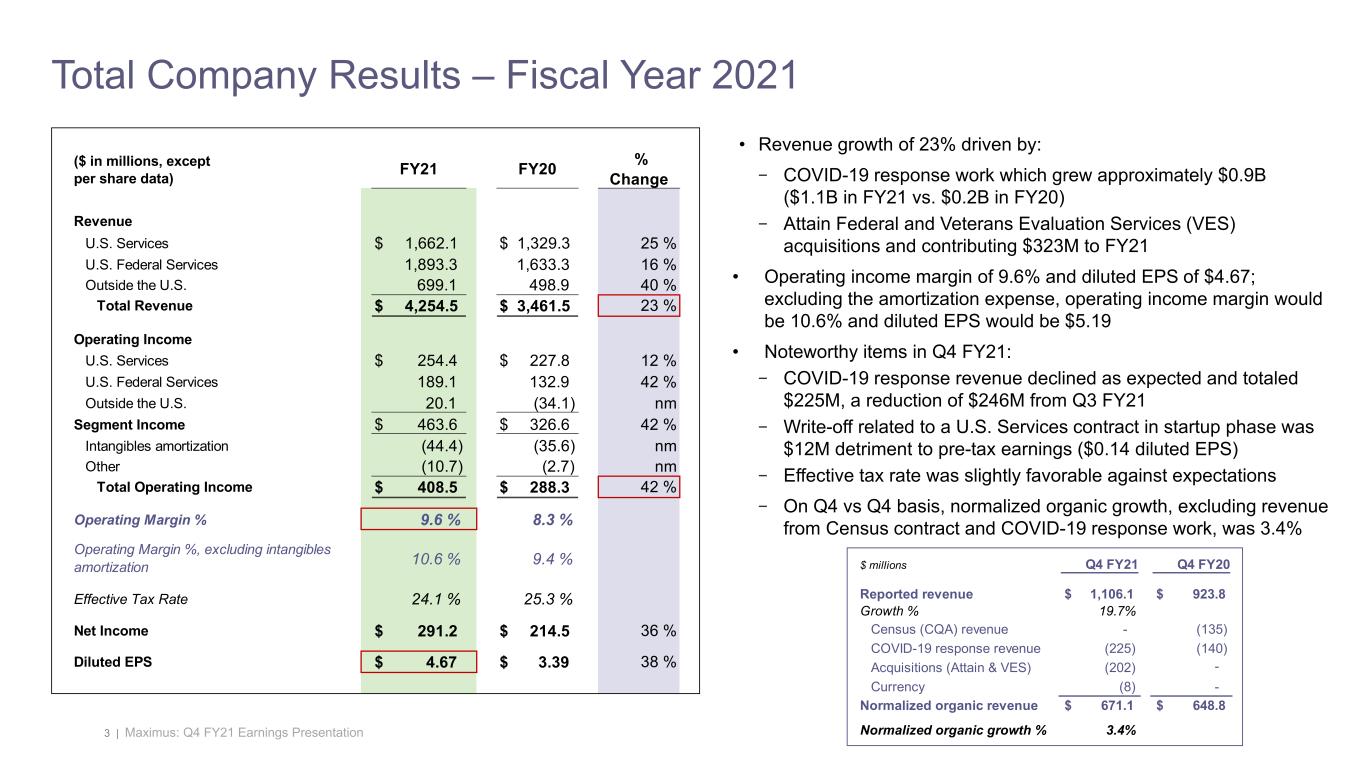
3 | Maximus: Q4 FY21 Earnings Presentation Total Company Results – Fiscal Year 2021 • Revenue growth of 23% driven by: − COVID-19 response work which grew approximately $0.9B ($1.1B in FY21 vs. $0.2B in FY20) − Attain Federal and Veterans Evaluation Services (VES) acquisitions and contributing $323M to FY21 • Operating income margin of 9.6% and diluted EPS of $4.67; excluding the amortization expense, operating income margin would be 10.6% and diluted EPS would be $5.19 • Noteworthy items in Q4 FY21: − COVID-19 response revenue declined as expected and totaled $225M, a reduction of $246M from Q3 FY21 − Write-off related to a U.S. Services contract in startup phase was $12M detriment to pre-tax earnings ($0.14 diluted EPS) − Effective tax rate was slightly favorable against expectations − On Q4 vs Q4 basis, normalized organic growth, excluding revenue from Census contract and COVID-19 response work, was 3.4% $ millions Q4 FY21 Q4 FY20 Reported revenue $ 1,106.1 $ 923.8 Growth % 19.7% Census (CQA) revenue - (135) COVID-19 response revenue (225) (140) Acquisitions (Attain & VES) (202) - Currency (8) - Normalized organic revenue $ 671.1 $ 648.8 Normalized organic growth % 3.4% ($ in millions, except per share data) FY21 FY20 % Change Revenue U.S. Services $ 1,662.1 $ 1,329.3 25 % U.S. Federal Services 1,893.3 1,633.3 16 % Outside the U.S. 699.1 498.9 40 % Total Revenue $ 4,254.5 $ 3,461.5 23 % Operating Income U.S. Services $ 254.4 $ 227.8 12 % U.S. Federal Services 189.1 132.9 42 % Outside the U.S. 20.1 (34.1) nm Segment Income $ 463.6 $ 326.6 42 % Intangibles amortization (44.4) (35.6) nm Other (10.7) (2.7) nm Total Operating Income $ 408.5 $ 288.3 42 % Operating Margin % 9.6 % 8.3 % Operating Margin %, excluding intangibles amortization 10.6 % 9.4 % Effective Tax Rate 24.1 % 25.3 % Net Income $ 291.2 $ 214.5 36 % Diluted EPS $ 4.67 $ 3.39 38 %
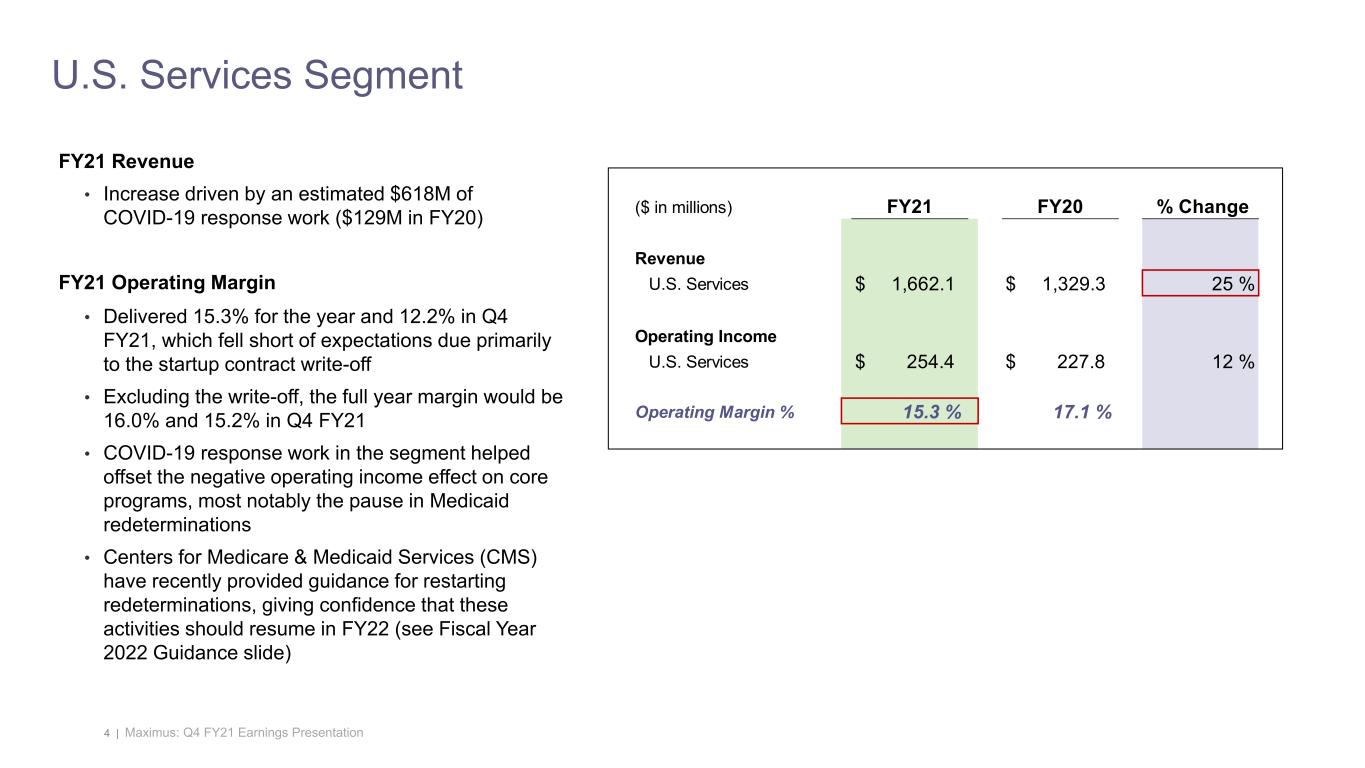
4 | Maximus: Q4 FY21 Earnings Presentation FY21 Revenue • Increase driven by an estimated $618M of COVID-19 response work ($129M in FY20) FY21 Operating Margin • Delivered 15.3% for the year and 12.2% in Q4 FY21, which fell short of expectations due primarily to the startup contract write-off • Excluding the write-off, the full year margin would be 16.0% and 15.2% in Q4 FY21 • COVID-19 response work in the segment helped offset the negative operating income effect on core programs, most notably the pause in Medicaid redeterminations • Centers for Medicare & Medicaid Services (CMS) have recently provided guidance for restarting redeterminations, giving confidence that these activities should resume in FY22 (see Fiscal Year 2022 Guidance slide) U.S. Services Segment ($ in millions) FY21 FY20 % Change Revenue U.S. Services $ 1,662.1 $ 1,329.3 25 % Operating Income U.S. Services $ 254.4 $ 227.8 12 % Operating Margin % 15.3 % 17.1 %
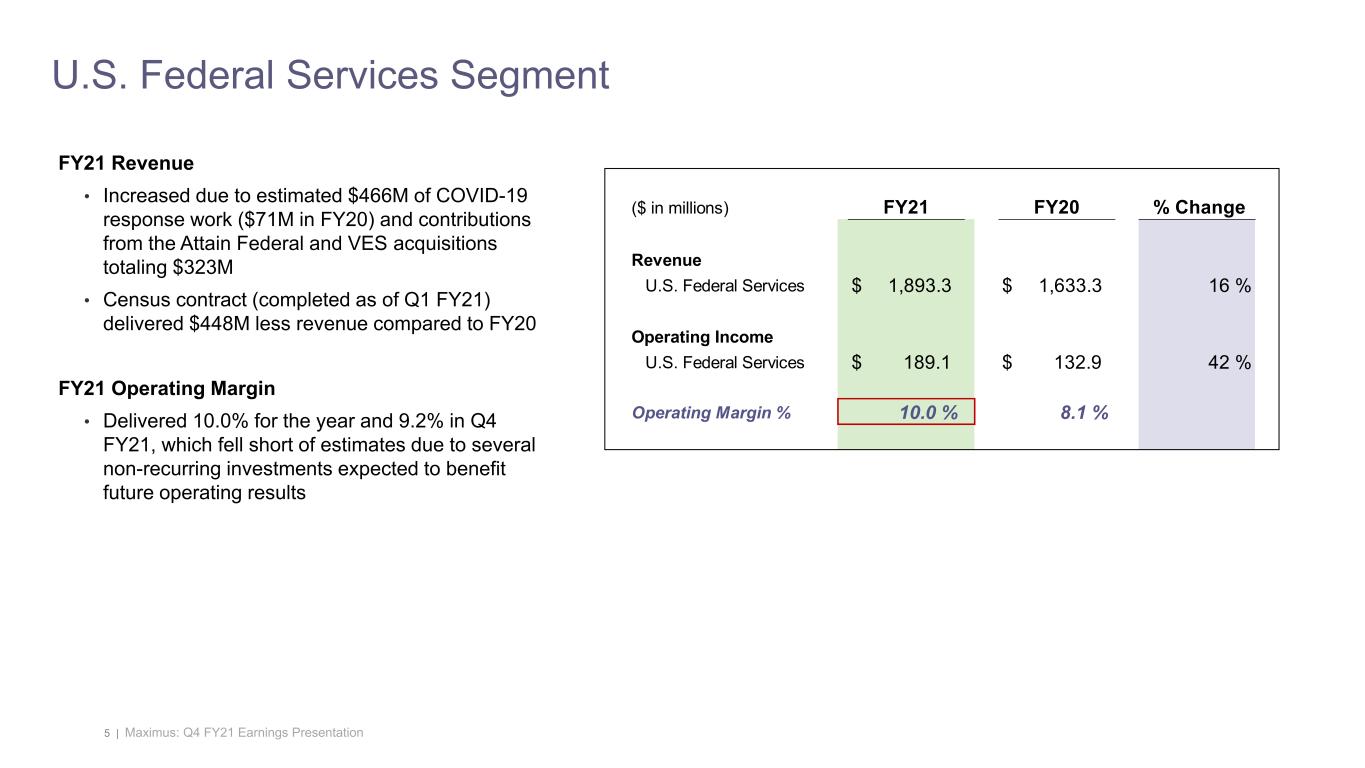
5 | Maximus: Q4 FY21 Earnings Presentation U.S. Federal Services Segment FY21 Revenue • Increased due to estimated $466M of COVID-19 response work ($71M in FY20) and contributions from the Attain Federal and VES acquisitions totaling $323M • Census contract (completed as of Q1 FY21) delivered $448M less revenue compared to FY20 FY21 Operating Margin • Delivered 10.0% for the year and 9.2% in Q4 FY21, which fell short of estimates due to several non-recurring investments expected to benefit future operating results ($ in millions) FY21 FY20 % Change Revenue U.S. Federal Services $ 1,893.3 $ 1,633.3 16 % Operating Income U.S. Federal Services $ 189.1 $ 132.9 42 % Operating Margin % 10.0 % 8.1 %
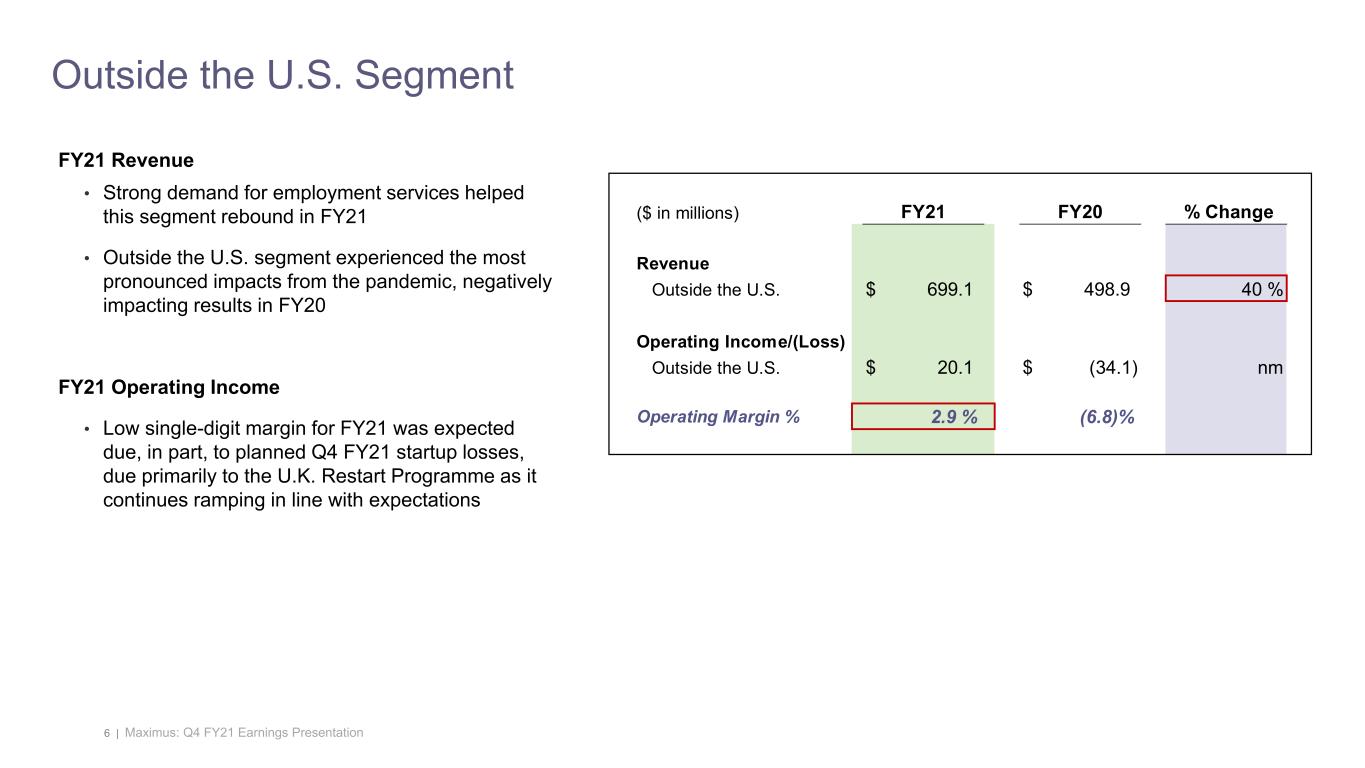
6 | Maximus: Q4 FY21 Earnings Presentation ($ in millions) FY21 FY20 % Change Revenue Outside the U.S. $ 699.1 $ 498.9 40 % Operating Income/(Loss) Outside the U.S. $ 20.1 $ (34.1) nm Operating Margin % 2.9 % (6.8)% Outside the U.S. Segment FY21 Revenue • Strong demand for employment services helped this segment rebound in FY21 • Outside the U.S. segment experienced the most pronounced impacts from the pandemic, negatively impacting results in FY20 FY21 Operating Income • Low single-digit margin for FY21 was expected due, in part, to planned Q4 FY21 startup losses, due primarily to the U.K. Restart Programme as it continues ramping in line with expectations
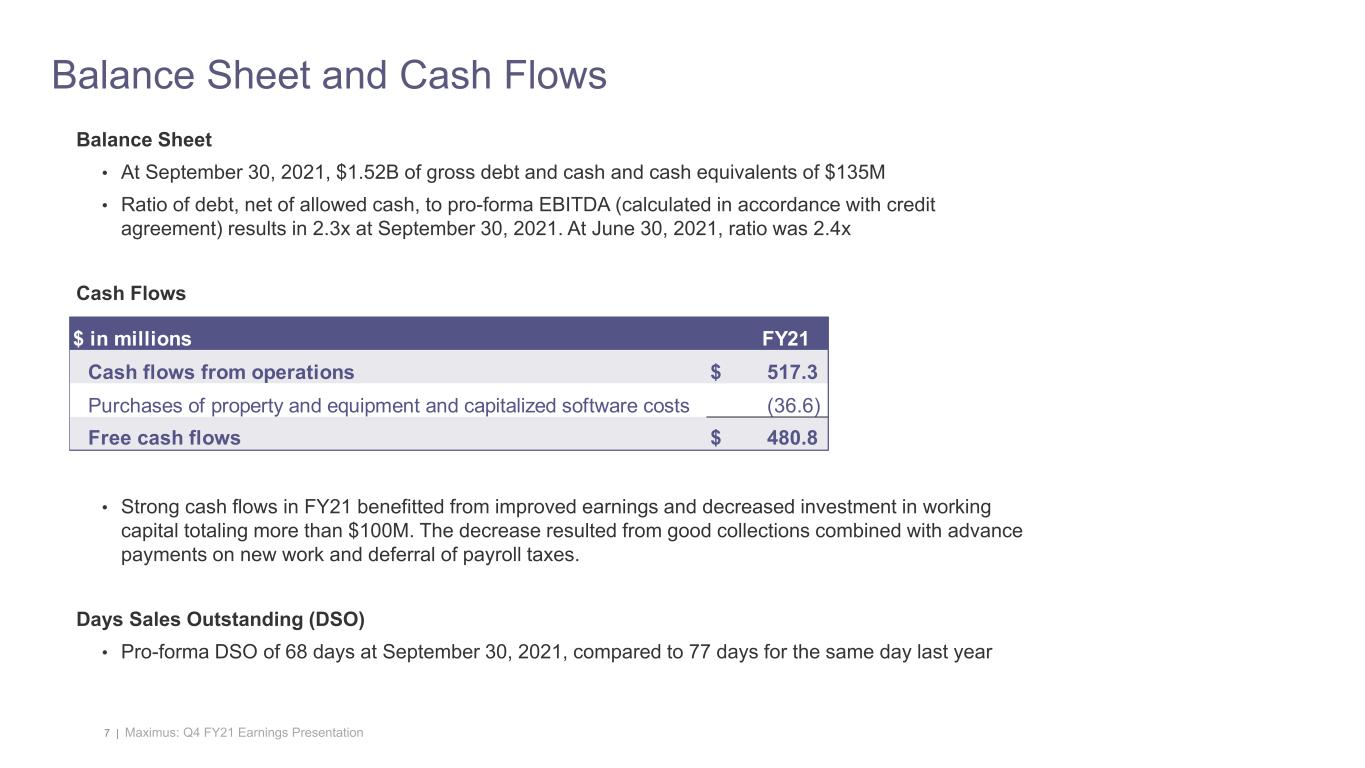
7 | Maximus: Q4 FY21 Earnings Presentation Balance Sheet • At September 30, 2021, $1.52B of gross debt and cash and cash equivalents of $135M • Ratio of debt, net of allowed cash, to pro-forma EBITDA (calculated in accordance with credit agreement) results in 2.3x at September 30, 2021. At June 30, 2021, ratio was 2.4x Cash Flows • Strong cash flows in FY21 benefitted from improved earnings and decreased investment in working capital totaling more than $100M. The decrease resulted from good collections combined with advance payments on new work and deferral of payroll taxes. Days Sales Outstanding (DSO) • Pro-forma DSO of 68 days at September 30, 2021, compared to 77 days for the same day last year Balance Sheet and Cash Flows $ in millions FY21 Cash flows from operations $ 517.3 Purchases of property and equipment and capitalized software costs (36.6) Free cash flows $ 480.8
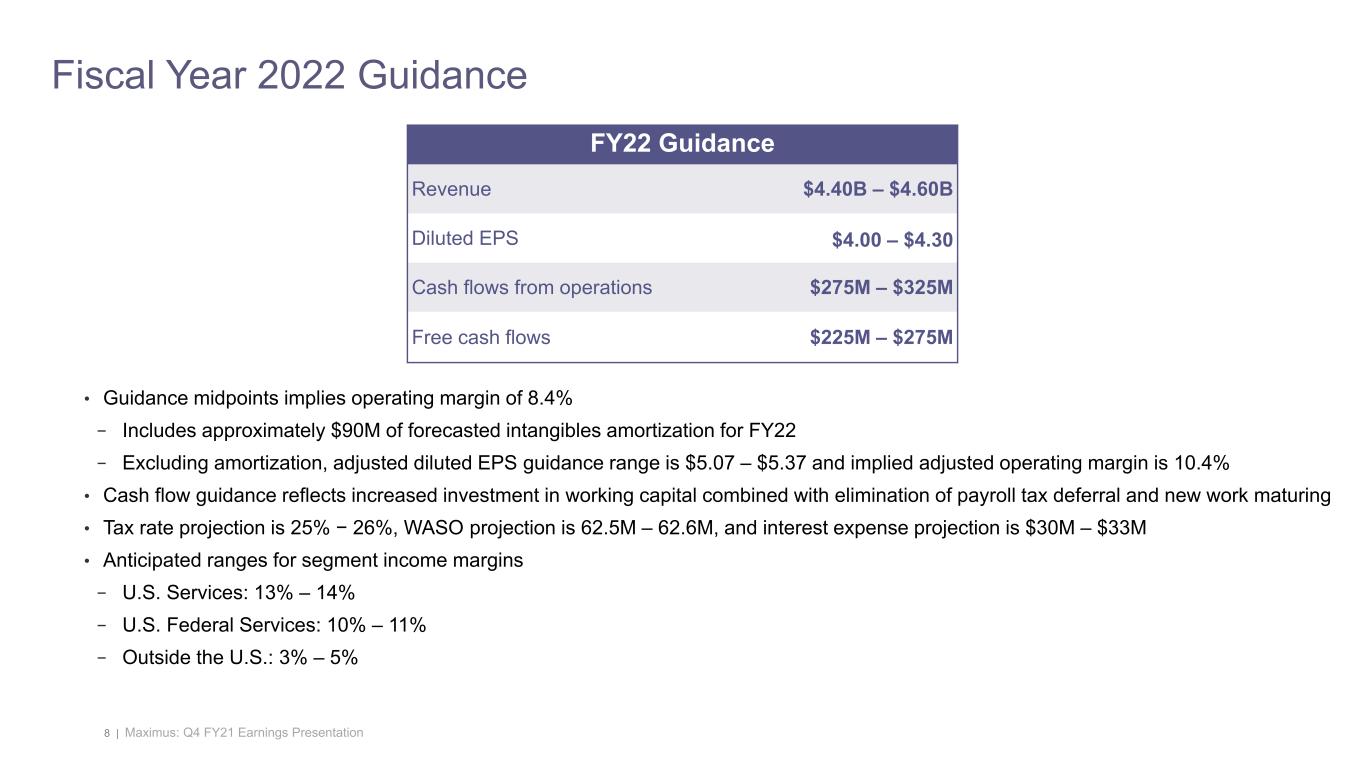
8 | Maximus: Q4 FY21 Earnings Presentation Fiscal Year 2022 Guidance • Guidance midpoints implies operating margin of 8.4% − Includes approximately $90M of forecasted intangibles amortization for FY22 − Excluding amortization, adjusted diluted EPS guidance range is $5.07 – $5.37 and implied adjusted operating margin is 10.4% • Cash flow guidance reflects increased investment in working capital combined with elimination of payroll tax deferral and new work maturing • Tax rate projection is 25% − 26%, WASO projection is 62.5M – 62.6M, and interest expense projection is $30M – $33M • Anticipated ranges for segment income margins − U.S. Services: 13% – 14% − U.S. Federal Services: 10% – 11% − Outside the U.S.: 3% – 5% FY22 Guidance Revenue $4.40B – $4.60B Diluted EPS $4.00 – $4.30 Cash flows from operations $275M – $325M Free cash flows $225M – $275M
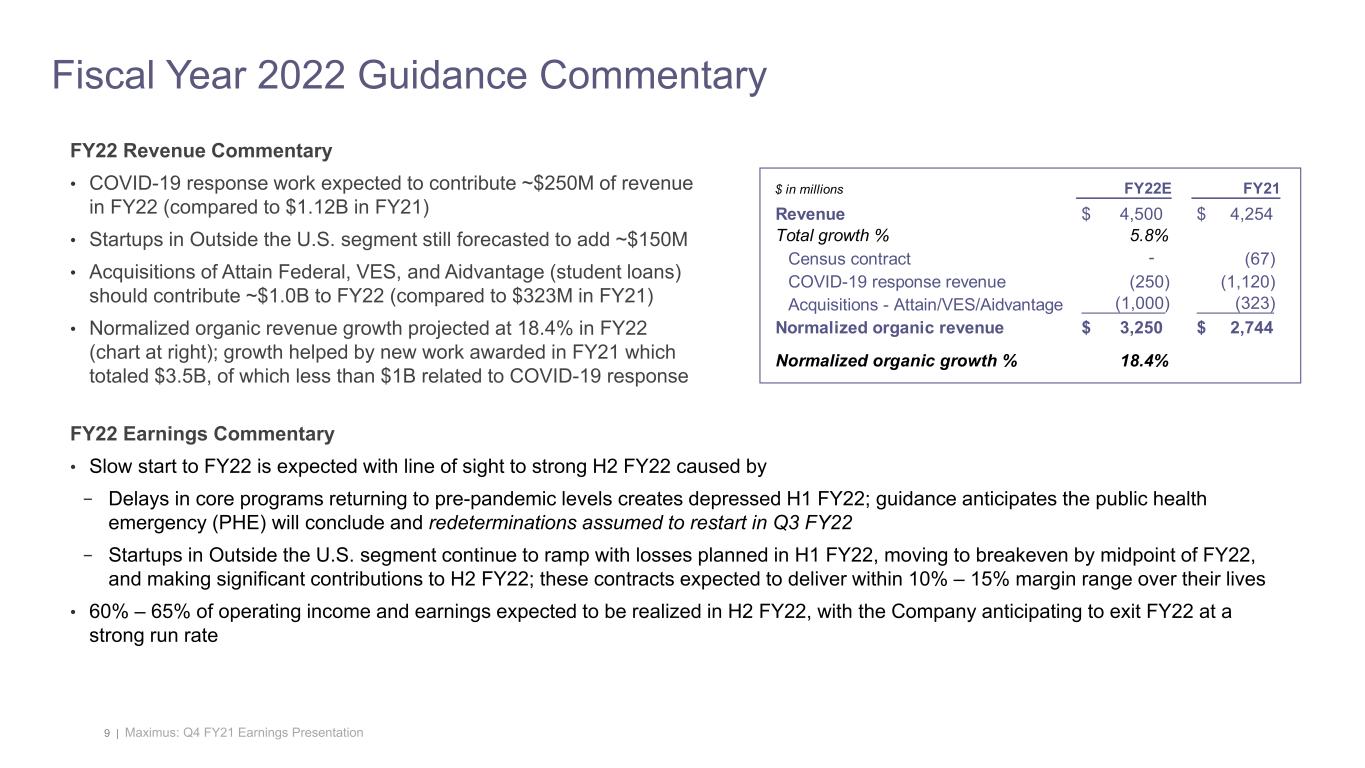
9 | Maximus: Q4 FY21 Earnings Presentation Fiscal Year 2022 Guidance Commentary FY22 Earnings Commentary • Slow start to FY22 is expected with line of sight to strong H2 FY22 caused by − Delays in core programs returning to pre-pandemic levels creates depressed H1 FY22; guidance anticipates the public health emergency (PHE) will conclude and redeterminations assumed to restart in Q3 FY22 − Startups in Outside the U.S. segment continue to ramp with losses planned in H1 FY22, moving to breakeven by midpoint of FY22, and making significant contributions to H2 FY22; these contracts expected to deliver within 10% – 15% margin range over their lives • 60% – 65% of operating income and earnings expected to be realized in H2 FY22, with the Company anticipating to exit FY22 at a strong run rate FY22 Revenue Commentary • COVID-19 response work expected to contribute ~$250M of revenue in FY22 (compared to $1.12B in FY21) • Startups in Outside the U.S. segment still forecasted to add ~$150M • Acquisitions of Attain Federal, VES, and Aidvantage (student loans) should contribute ~$1.0B to FY22 (compared to $323M in FY21) • Normalized organic revenue growth projected at 18.4% in FY22 (chart at right); growth helped by new work awarded in FY21 which totaled $3.5B, of which less than $1B related to COVID-19 response $ in millions FY22E FY21 Revenue $ 4,500 $ 4,254 Total growth % 5.8% Census contract - (67) COVID-19 response revenue (250) (1,120) Acquisitions - Attain/VES/Aidvantage (1,000) (323) Normalized organic revenue $ 3,250 $ 2,744 Normalized organic growth % 18.4%

10 | Maximus: Q4 FY21 Earnings Presentation Bruce Caswell President & Chief Executive Officer Fiscal 2021 Year End Earnings Call November 18, 2021
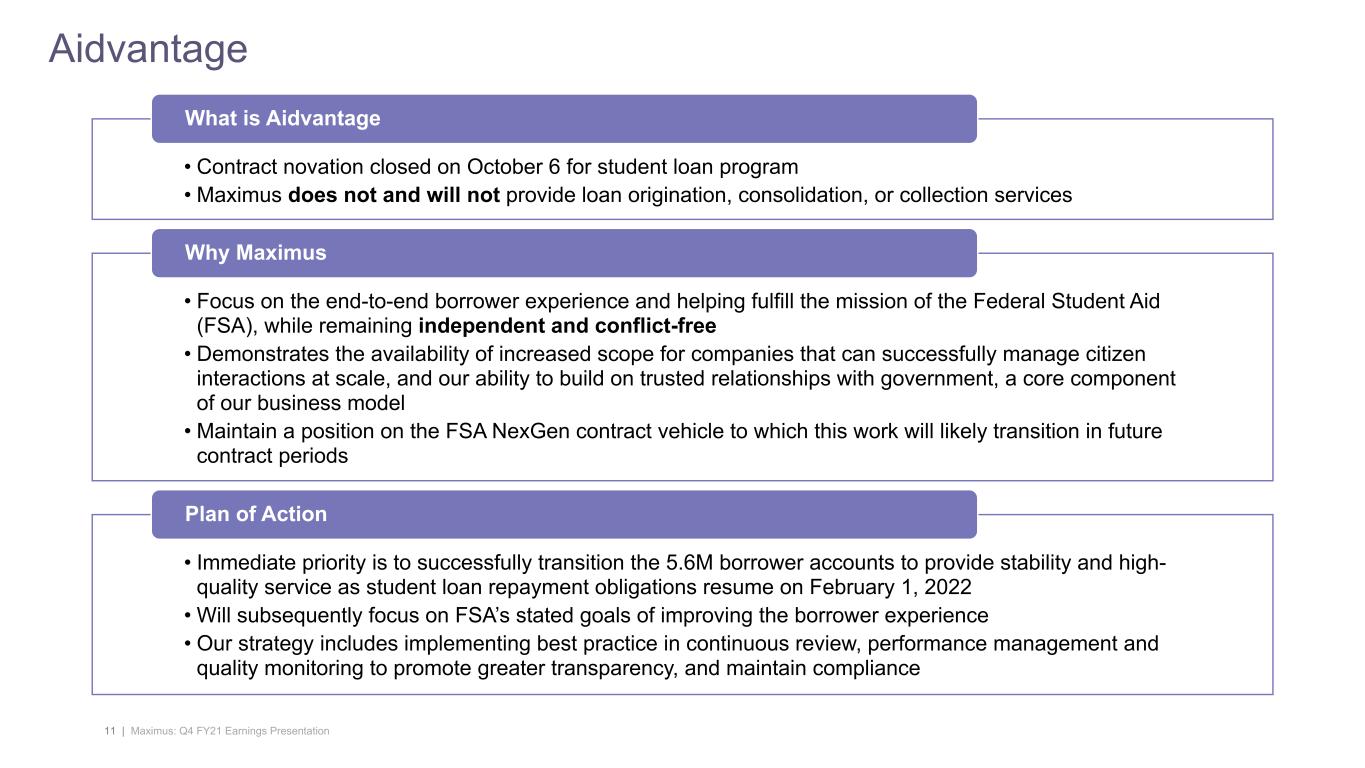
11 | Maximus: Q4 FY21 Earnings Presentation Aidvantage • Contract novation closed on October 6 for student loan program • Maximus does not and will not provide loan origination, consolidation, or collection services What is Aidvantage • Focus on the end-to-end borrower experience and helping fulfill the mission of the Federal Student Aid (FSA), while remaining independent and conflict-free • Demonstrates the availability of increased scope for companies that can successfully manage citizen interactions at scale, and our ability to build on trusted relationships with government, a core component of our business model • Maintain a position on the FSA NexGen contract vehicle to which this work will likely transition in future contract periods Why Maximus • Immediate priority is to successfully transition the 5.6M borrower accounts to provide stability and high- quality service as student loan repayment obligations resume on February 1, 2022 • Will subsequently focus on FSA’s stated goals of improving the borrower experience • Our strategy includes implementing best practice in continuous review, performance management and quality monitoring to promote greater transparency, and maintain compliance Plan of Action
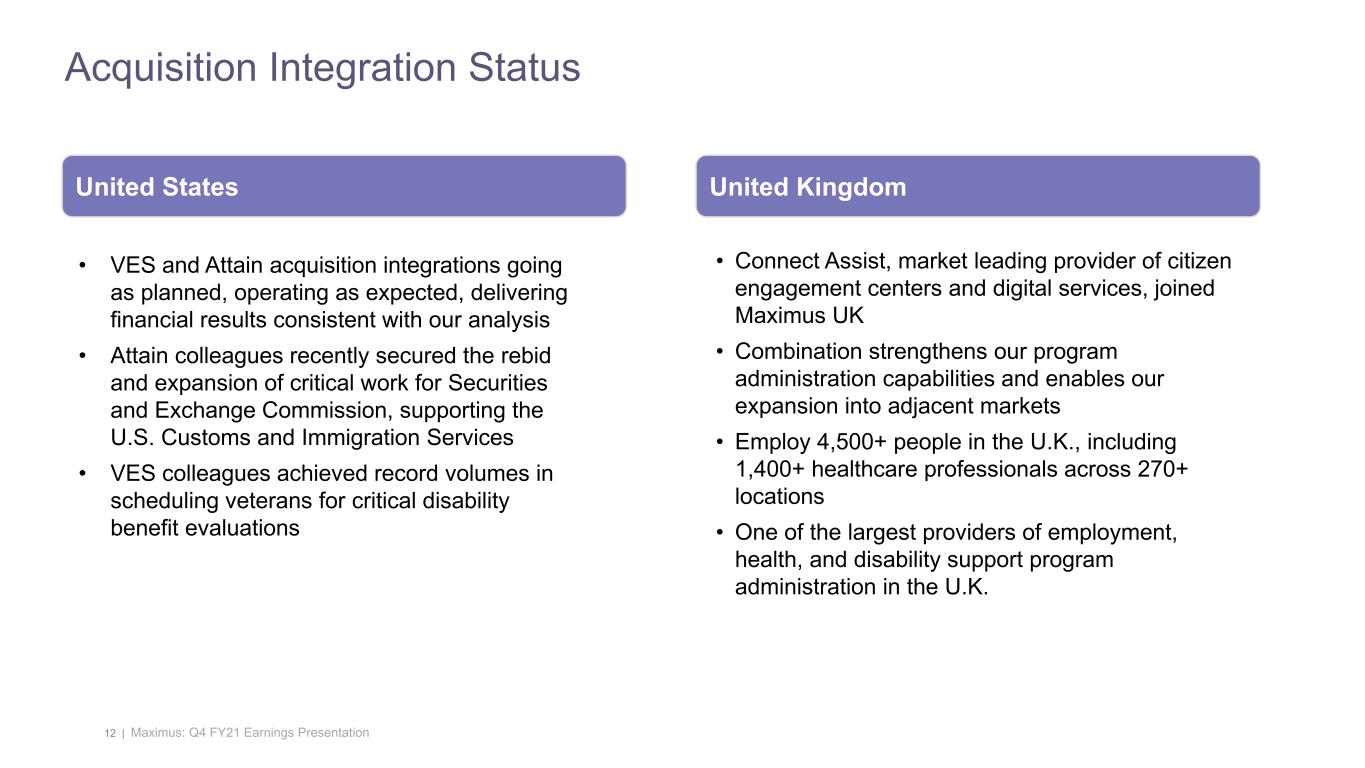
12 | Maximus: Q4 FY21 Earnings Presentation Acquisition Integration Status United States • VES and Attain acquisition integrations going as planned, operating as expected, delivering financial results consistent with our analysis • Attain colleagues recently secured the rebid and expansion of critical work for Securities and Exchange Commission, supporting the U.S. Customs and Immigration Services • VES colleagues achieved record volumes in scheduling veterans for critical disability benefit evaluations United Kingdom • Connect Assist, market leading provider of citizen engagement centers and digital services, joined Maximus UK • Combination strengthens our program administration capabilities and enables our expansion into adjacent markets • Employ 4,500+ people in the U.K., including 1,400+ healthcare professionals across 270+ locations • One of the largest providers of employment, health, and disability support program administration in the U.K.
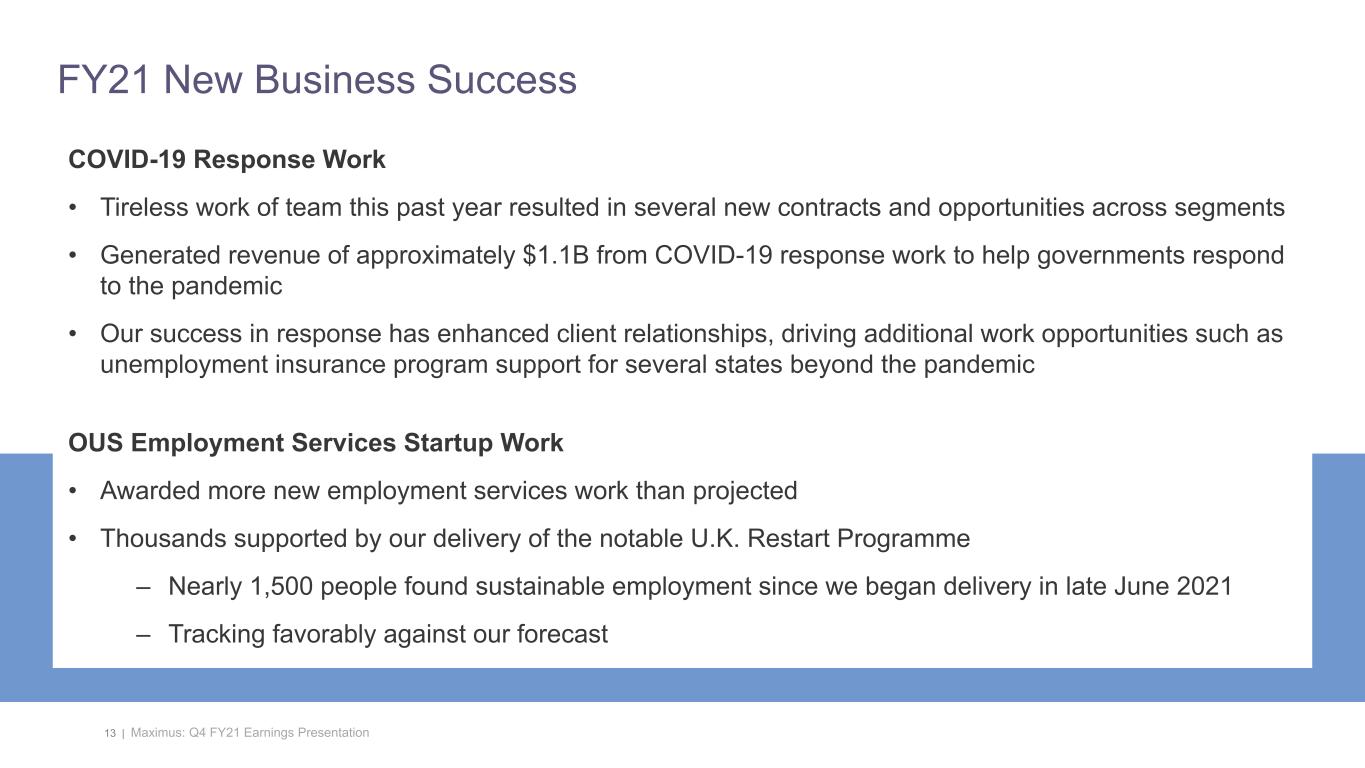
13 | Maximus: Q4 FY21 Earnings Presentation FY21 New Business Success COVID-19 Response Work • Tireless work of team this past year resulted in several new contracts and opportunities across segments • Generated revenue of approximately $1.1B from COVID-19 response work to help governments respond to the pandemic • Our success in response has enhanced client relationships, driving additional work opportunities such as unemployment insurance program support for several states beyond the pandemic OUS Employment Services Startup Work • Awarded more new employment services work than projected • Thousands supported by our delivery of the notable U.K. Restart Programme – Nearly 1,500 people found sustainable employment since we began delivery in late June 2021 – Tracking favorably against our forecast
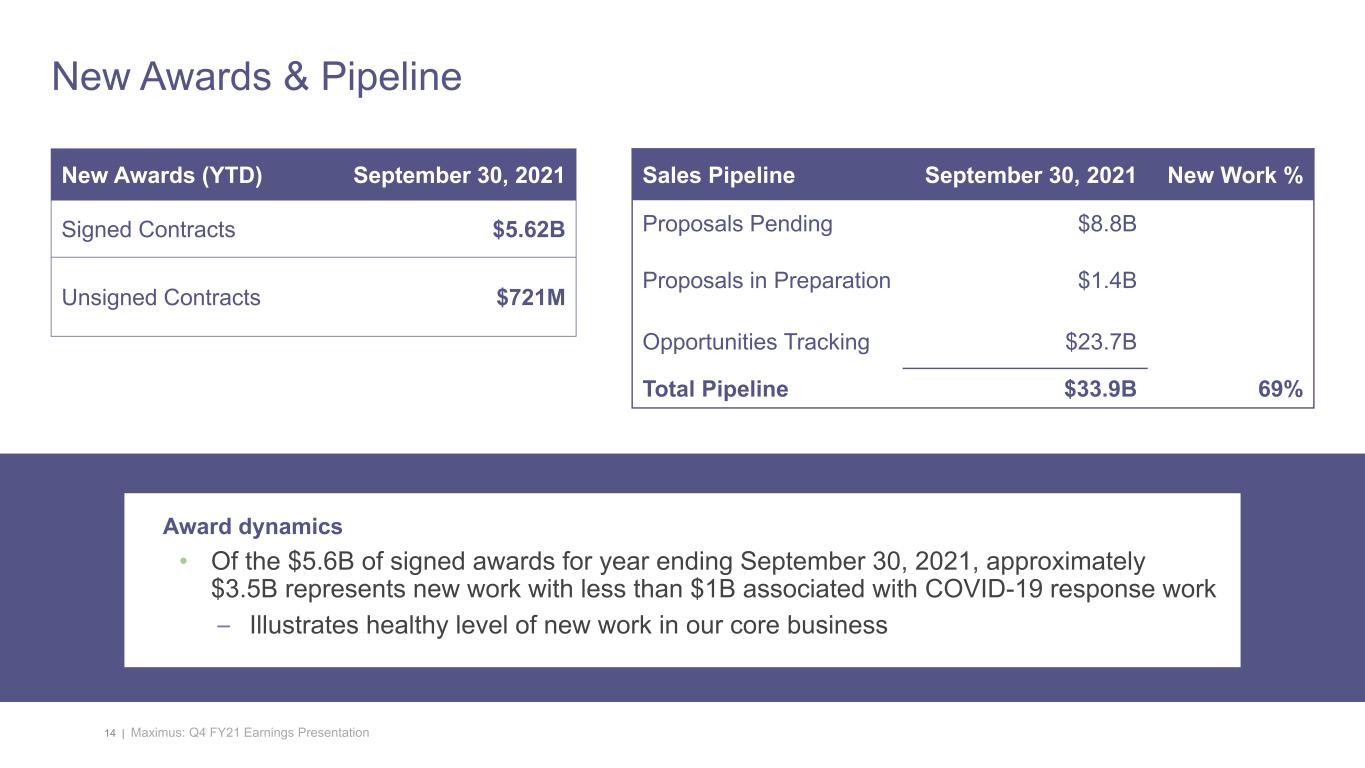
14 | Maximus: Q4 FY21 Earnings Presentation Sales Pipeline September 30, 2021 New Work % Proposals Pending $8.8B Proposals in Preparation $1.4B Opportunities Tracking $23.7B Total Pipeline $33.9B 69% New Awards (YTD) September 30, 2021 Signed Contracts $5.62B Unsigned Contracts $721M New Awards & Pipeline Award dynamics • Of the $5.6B of signed awards for year ending September 30, 2021, approximately $3.5B represents new work with less than $1B associated with COVID-19 response work – Illustrates healthy level of new work in our core business
15 | Maximus: Q4 FY21 Earnings Presentation • 20 long months since start of public health emergency (PHE) which we anticipate to expire at end of the first calendar quarter of 2022 • Expect solid second half of FY22 with positive environment and momentum for the business, exiting the year at a strong run rate • Dynamics include: – Anticipated conclusion of PHE and resumption of pre-pandemic activities including redeterminations – Startup contracts exiting that phase – New organic wins in U.S. Services coming online – FY21 acquisitions maturing in their integration and contribution – Benefits of substantial new work pipeline Fiscal Year 2022 Expectations
16 | Maximus: Q4 FY21 Earnings Presentation Vaccine Mandate • Planning for implementation of Biden Administration executive order and OSHA requirements which includes extensive employee education and resources, paid time off to receive a vaccination, and frequent reminders regarding timelines and options • Continue to prioritize employee safety and wellbeing, actively monitoring guidance and updating our procedures accordingly Demand for Talent • Demand for talent highly competitive; our implementation of vaccine requirements may result in some workforce attrition and difficulty meeting existing or future hiring needs • Strong talent brand is a key differentiator for the Company with expansion of benefits and programs to support and protect our people over the past 20 months • Recruiting programs focus on identifying and evaluating talent through practices that welcome a diverse workforce, including veterans, people with disabilities, language barriers, and those from varying socioeconomic backgrounds • Imagining new ways of working put us in an even better position over the long- term to attract the necessary talent through workplace flexibility and outside of historical geographical bounds Labor Market
17 | Maximus: Q4 FY21 Earnings Presentation Strategy Execution • Pleased on execution of three-pronged strategy of expanding clinical business, driving digital transformation, expanding to adjacent markets – Led to balanced organic and inorganic growth and set the table for future organic growth in expanded core and new markets • With focus on delivering shareholder value through our FY21 acquisitions, concurrently kicked-off strategy refresh initiative to: – Define the next phase in our clinical and technology journey – Look further into the horizon than our traditional annual planning process Investor Day • Excited about the energy and ideas this collaborative process has already yielded • Look forward to sharing more formal insights with our shareholders and the analyst community during our planned Investor Day in 2022 Conclusion
18 | Maximus: Q4 FY21 Earnings Presentation Appendix
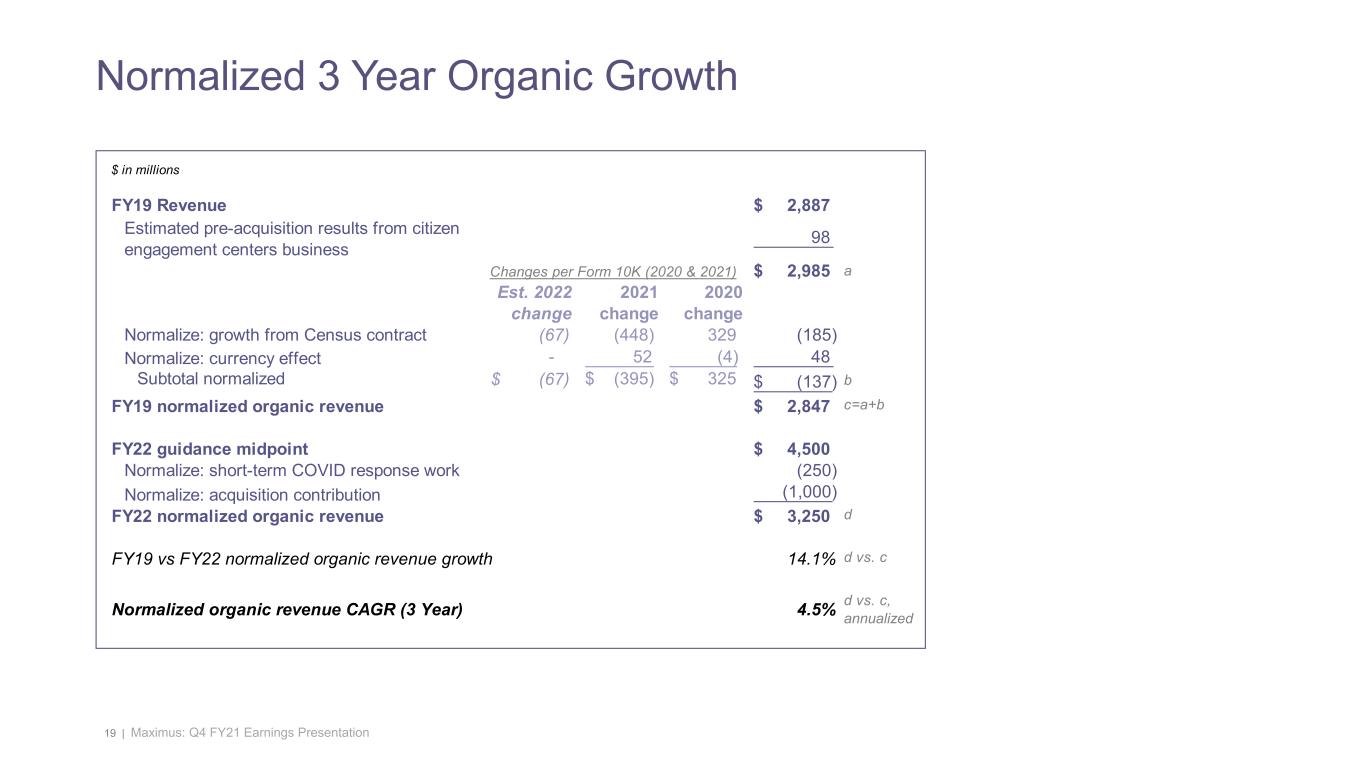
19 | Maximus: Q4 FY21 Earnings Presentation Normalized 3 Year Organic Growth $ in millions FY19 Revenue $ 2,887 Estimated pre-acquisition results from citizen engagement centers business 98 $ 2,985 a Est. 2022 change 2021 change 2020 change Normalize: growth from Census contract (67) (448) 329 (185) Normalize: currency effect - 52 (4) 48 Subtotal normalized $ (67) $ (395) $ 325 $ (137) b FY19 normalized organic revenue $ 2,847 c=a+b FY22 guidance midpoint $ 4,500 Normalize: short-term COVID response work (250) Normalize: acquisition contribution (1,000) FY22 normalized organic revenue $ 3,250 d FY19 vs FY22 normalized organic revenue growth 14.1% d vs. c Normalized organic revenue CAGR (3 Year) 4.5% d vs. c, annualized Changes per Form 10K (2020 & 2021)
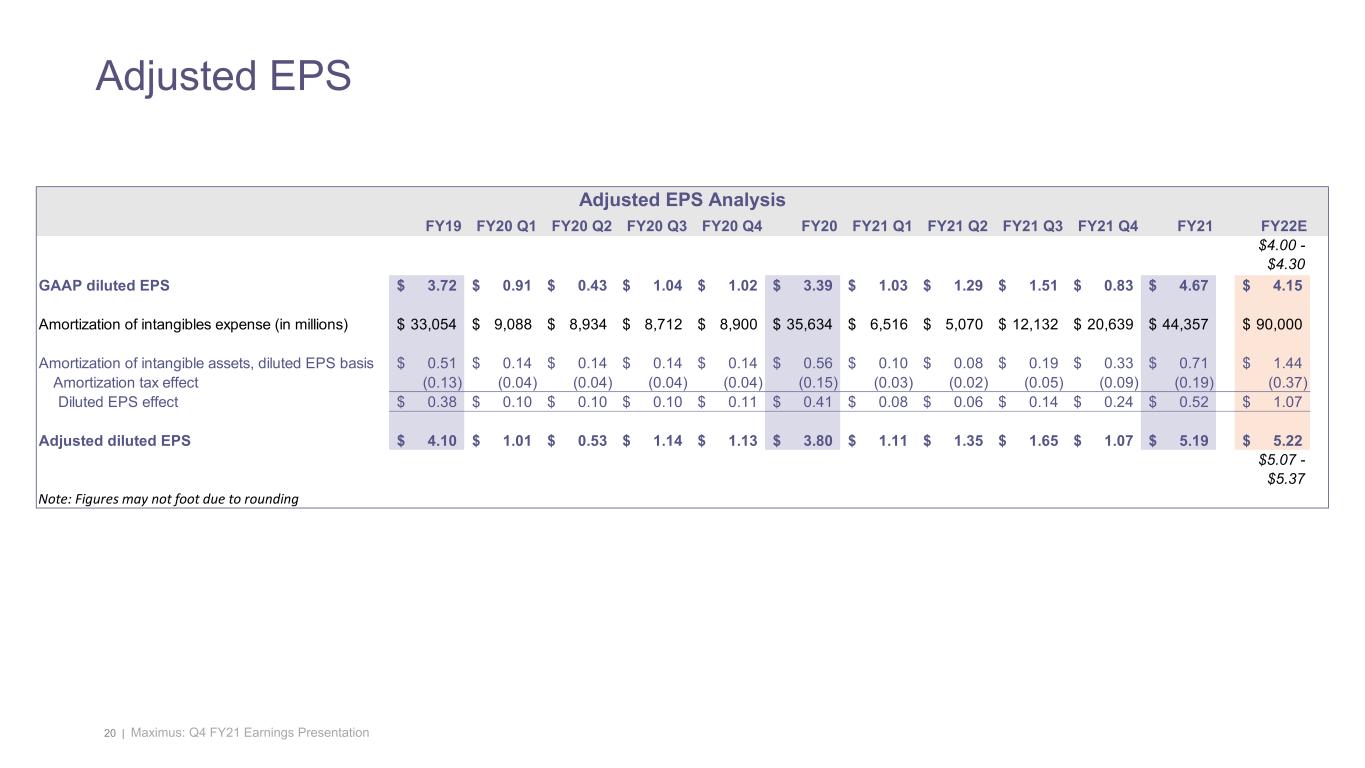
20 | Maximus: Q4 FY21 Earnings Presentation Adjusted EPS FY19 FY20 Q1 FY20 Q2 FY20 Q3 FY20 Q4 FY20 FY21 Q1 FY21 Q2 FY21 Q3 FY21 Q4 FY21 FY22E $4.00 - $4.30 GAAP diluted EPS 3.72$ 0.91$ 0.43$ 1.04$ 1.02$ 3.39$ 1.03$ 1.29$ 1.51$ 0.83$ 4.67$ 4.15$ Amortization of intangibles expense (in millions) 33,054$ 9,088$ 8,934$ 8,712$ 8,900$ 35,634$ 6,516$ 5,070$ 12,132$ 20,639$ 44,357$ 90,000$ Amortization of intangible assets, diluted EPS basis 0.51$ 0.14$ 0.14$ 0.14$ 0.14$ 0.56$ 0.10$ 0.08$ 0.19$ 0.33$ 0.71$ 1.44$ Amortization tax effect (0.13) (0.04) (0.04) (0.04) (0.04) (0.15) (0.03) (0.02) (0.05) (0.09) (0.19) (0.37) Diluted EPS effect 0.38$ 0.10$ 0.10$ 0.10$ 0.11$ 0.41$ 0.08$ 0.06$ 0.14$ 0.24$ 0.52$ 1.07$ Adjusted diluted EPS 4.10$ 1.01$ 0.53$ 1.14$ 1.13$ 3.80$ 1.11$ 1.35$ 1.65$ 1.07$ 5.19$ 5.22$ $5.07 - $5.37 Note: Figures may not foot due to rounding Adjusted EPS Analysis