
Fiscal 2019 Fourth Quarter & Year End Earnings Call Rick Nadeau Chief Financial Officer November 19, 2019 1 | MAXIMUS: Q4 FY19 EARNINGS PRESENTATION
Forward-looking Statements & Non-GAAP Information This presentation should be read in conjunction with the Company’s most recent quarterly earnings press release, along with listening to or reading a transcript of the comments of Company management from our most recent quarterly earnings conference call. This presentation may contain non-GAAP financial information. Management uses this information in its internal analysis of results and believes that this information may be informative to investors in gauging the quality of our financial performance, identifying trends in our results, and providing meaningful period-to-period comparisons. These measures should be used in conjunction with, rather than instead of, their comparable GAAP measures. For a reconciliation of non-GAAP measures to the comparable GAAP measures presented in this document, see the Company’s most recent quarterly earnings press release. Throughout this presentation, numbers may not add due to rounding. This presentation includes a discussion of our pipeline of opportunities, which represents our estimate of future contract opportunities which have been identified but which are not, and may never become, revenue generating work for us. We prepare our pipeline balance as follows: • Specific identified opportunities are recorded as the Total Contract Value (TCV). TCV includes the base contract period, plus any option periods. • The reported pipeline includes only identified opportunities that have expected release date for the Request for Proposal (RFP) within two years. • The Company reports the estimated total value of the bid at the time the identified opportunity is entered into the pipeline. The Company will update these estimated values as more information becomes available as the identified opportunity matures through the procurement process. Our pipeline is an estimate and may fluctuate significantly over time. Although we believe our pipeline is a helpful tool for management to evaluate our opportunities and ensure we are appropriately focused on a relevant, timely and accurate response to opportunities to win work and create future contract backlog, the pipeline balance represents our estimate of opportunities only and not firm commitments. It is not a guarantee of future performance. Our ability to convert pipeline into firm backlog will depend upon a variety of external and company-specific factors, including our ability to accurately estimate the value of the opportunities, the timing and size of the opportunities to arise, our willingness to bid on these opportunities, our win rate, the timing of the contract and our execution of the arrangement, as well as risks and uncertainties applicable to our other forward-looking statements. Included in this document are forward-looking statements within the meaning of the safe harbor provisions of the United States Private Securities Litigation Reform Act of 1995. Forward- looking statements can be identified by words such as: “anticipate,” “intend,” “plan,” “goal,” “seek,” “opportunity,” “could,” “potential,” “believe,” “project,” “estimate,” “expect,” “strategy,” “future,” “likely,” “may,” “should,” “will” and similar references to future periods. Forward-looking statements are neither historical facts nor assurances of future performance. Instead, they are based only on our current beliefs, expectations and assumptions regarding the future of our business, future plans and strategies, projections, anticipated events and trends, the economy and other future conditions. Because forward-looking statements relate to the future, they are subject to inherent uncertainties, risks and changes in circumstances that are difficult to predict and many of which are outside of our control. Our actual results and financial condition may differ materially from those indicated in the forward-looking statements. Therefore, you should not rely on any of these forward-looking statements. Important factors that could cause our actual results and financial condition to differ materially from those indicated in the forward-looking statements include, among others, the factors set forth in Exhibit 99.1 under the caption "Special Considerations and Risk Factors," in our Annual Report on Form 10-K for the year ended September 30, 2018, which was filed with the Securities and Exchange Commission on November 20, 2018 and the matters listed in our “Special Note Regarding Forward-Looking Statements” in our recently filed Quarterly Report on Form 10-Q. Any forward-looking statement made by us in this press release is based only on information currently available to us and speaks only as of the date on which it is made. We undertake no obligation to publicly update any forward-looking statement, whether written or oral, that may be made from time to time, whether as a result of new information, future developments or otherwise. 2 | MAXIMUS: Q4 FY19 EARNINGS PRESENTATION
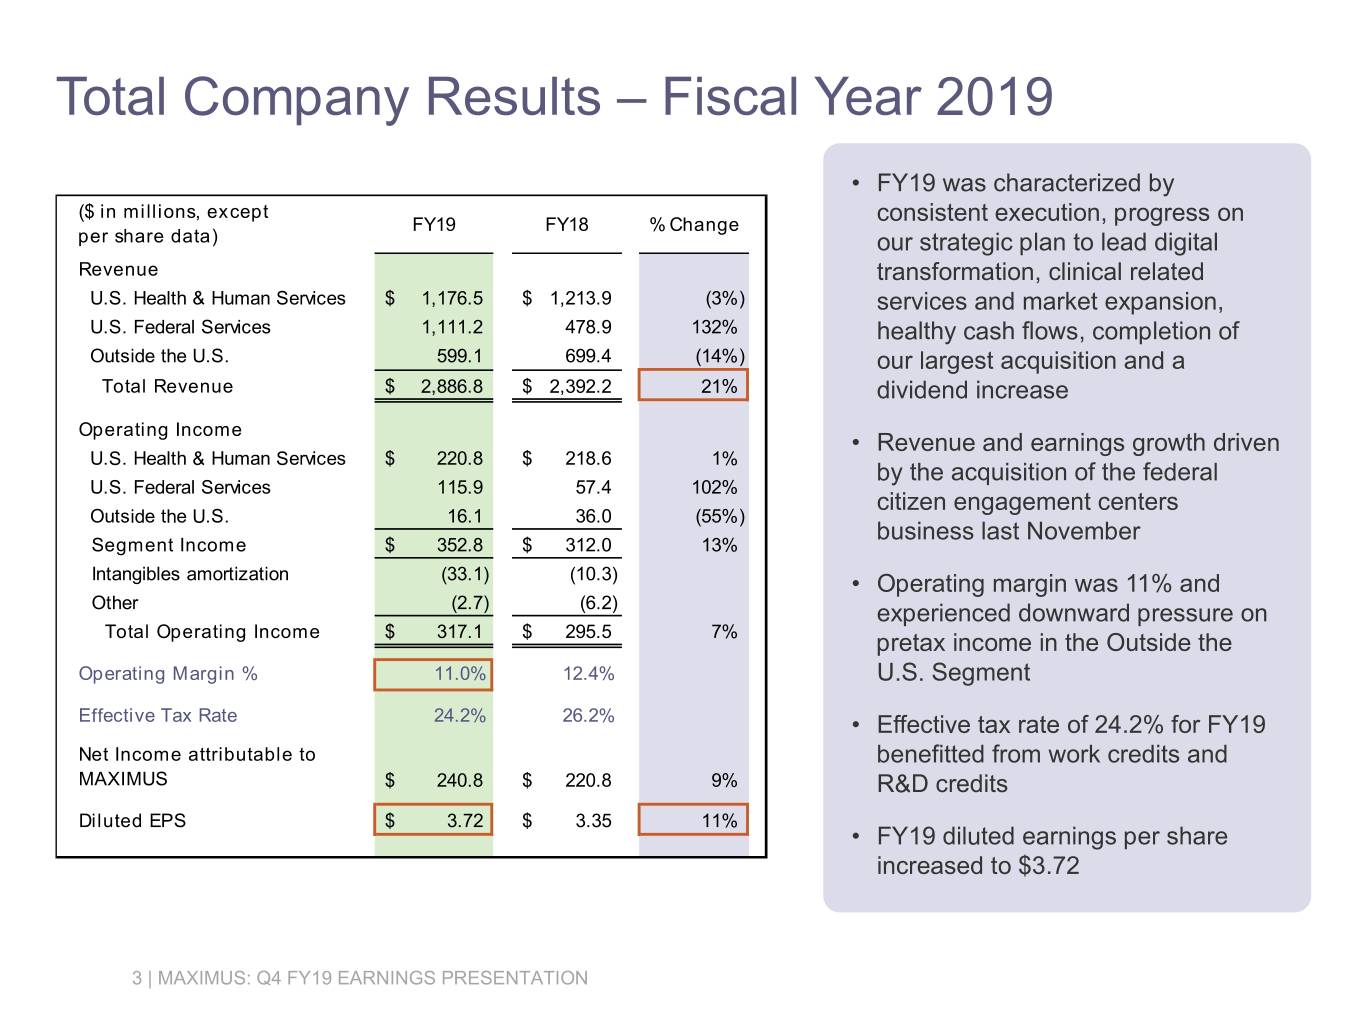
Total Company Results – Fiscal Year 2019 • FY19 was characterized by ($ in millions, except FY19 FY18 % Change consistent execution, progress on per share data) our strategic plan to lead digital Revenue transformation, clinical related U.S. Health & Human Services $ 1,176.5 $ 1,213.9 (3%) services and market expansion, U.S. Federal Services 1,111.2 478.9 132% healthy cash flows, completion of Outside the U.S. 599.1 699.4 (14%) our largest acquisition and a Total Revenue $ 2,886.8 $ 2,392.2 21% dividend increase Operating Income • Revenue and earnings growth driven U.S. Health & Human Services $ 220.8 $ 218.6 1% by the acquisition of the federal U.S. Federal Services 115.9 57.4 102% citizen engagement centers Outside the U.S. 16.1 36.0 (55%) business last November Segment Income $ 352.8 $ 312.0 13% Intangibles amortization (33.1) (10.3) • Operating margin was 11% and Other (2.7) (6.2) experienced downward pressure on Total Operating Income $ 317.1 $ 295.5 7% pretax income in the Outside the Operating Margin % 11.0% 12.4% U.S. Segment Effective Tax Rate 24.2% 26.2% • Effective tax rate of 24.2% for FY19 Net Income attributable to benefitted from work credits and MAXIMUS $ 240.8 $ 220.8 9% R&D credits Diluted EPS $ 3.72 $ 3.35 11% • FY19 diluted earnings per share increased to $3.72 3 | MAXIMUS: Q4 FY19 EARNINGS PRESENTATION
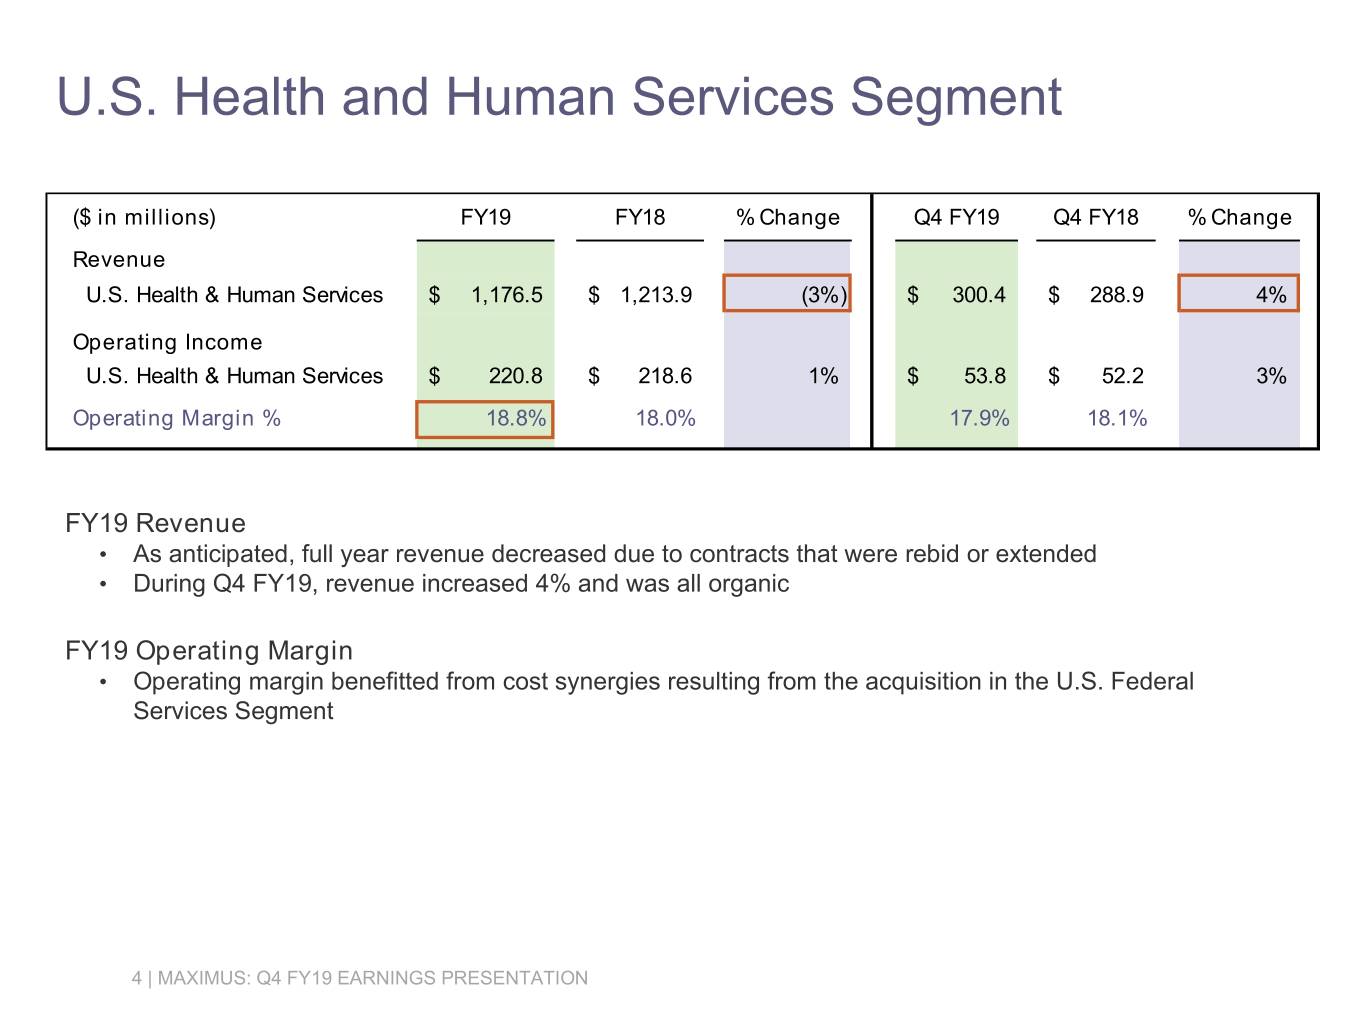
U.S. Health and Human Services Segment ($ in millions) FY19 FY18 % Change Q4 FY19 Q4 FY18 % Change Revenue U.S. Health & Human Services $ 1,176.5 $ 1,213.9 (3%) $ 300.4 $ 288.9 4% Operating Income U.S. Health & Human Services $ 220.8 $ 218.6 1% $ 53.8 $ 52.2 3% Operating Margin % 18.8% 18.0% 17.9% 18.1% FY19 Revenue • As anticipated, full year revenue decreased due to contracts that were rebid or extended • During Q4 FY19, revenue increased 4% and was all organic FY19 Operating Margin • Operating margin benefitted from cost synergies resulting from the acquisition in the U.S. Federal Services Segment 4 | MAXIMUS: Q4 FY19 EARNINGS PRESENTATION
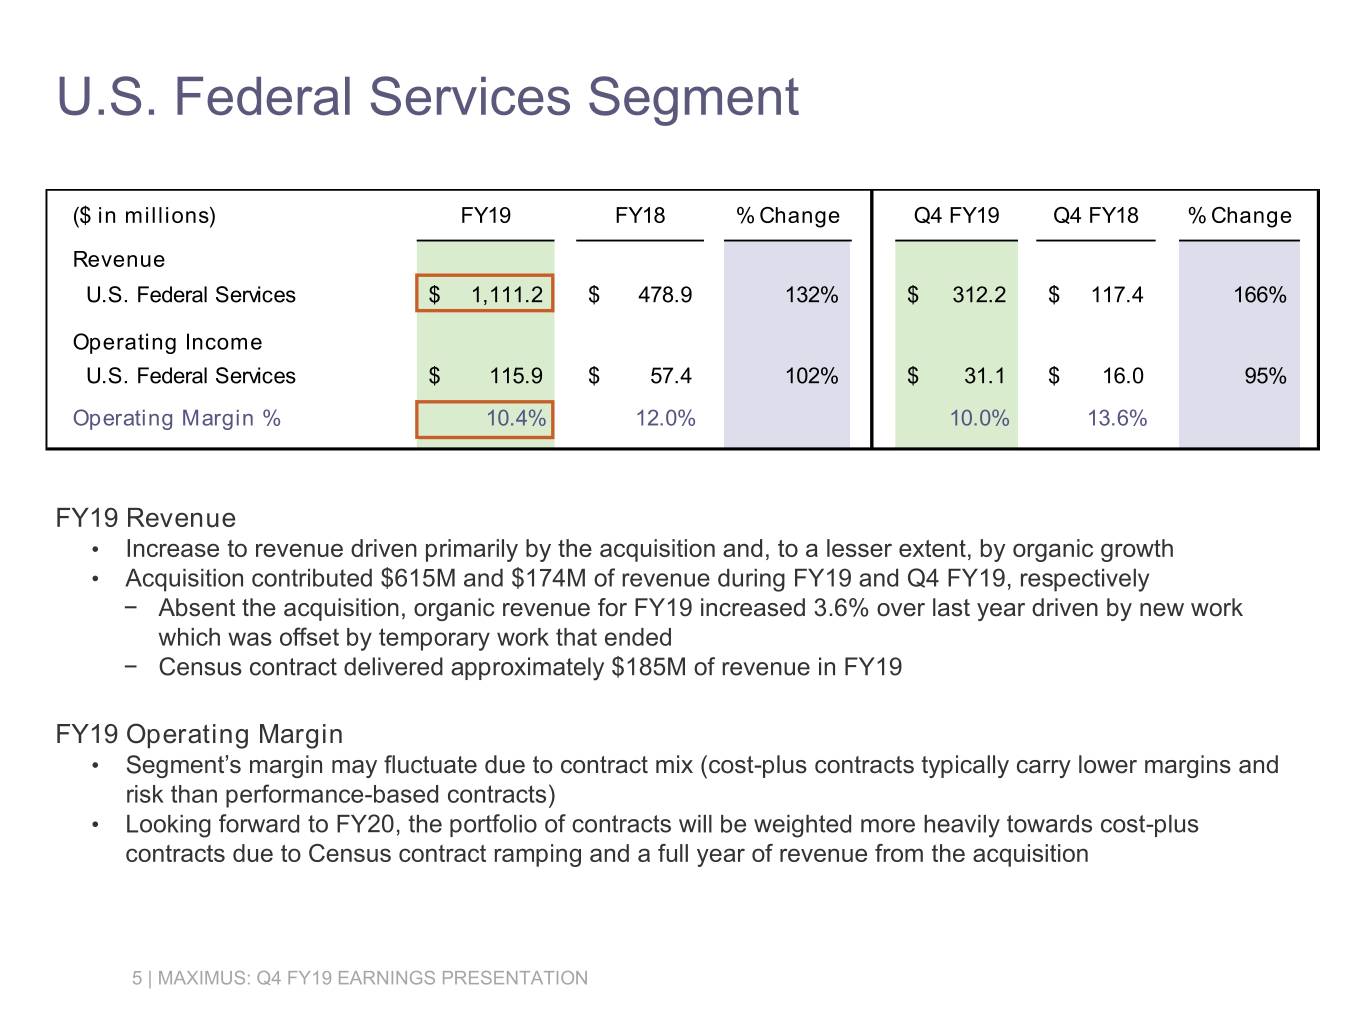
U.S. Federal Services Segment ($ in millions) FY19 FY18 % Change Q4 FY19 Q4 FY18 % Change Revenue U.S. Federal Services $ 1,111.2 $ 478.9 132% $ 312.2 $ 117.4 166% Operating Income U.S. Federal Services $ 115.9 $ 57.4 102% $ 31.1 $ 16.0 95% Operating Margin % 10.4% 12.0% 10.0% 13.6% FY19 Revenue • Increase to revenue driven primarily by the acquisition and, to a lesser extent, by organic growth • Acquisition contributed $615M and $174M of revenue during FY19 and Q4 FY19, respectively − Absent the acquisition, organic revenue for FY19 increased 3.6% over last year driven by new work which was offset by temporary work that ended − Census contract delivered approximately $185M of revenue in FY19 FY19 Operating Margin • Segment’s margin may fluctuate due to contract mix (cost-plus contracts typically carry lower margins and risk than performance-based contracts) • Looking forward to FY20, the portfolio of contracts will be weighted more heavily towards cost-plus contracts due to Census contract ramping and a full year of revenue from the acquisition 5 | MAXIMUS: Q4 FY19 EARNINGS PRESENTATION
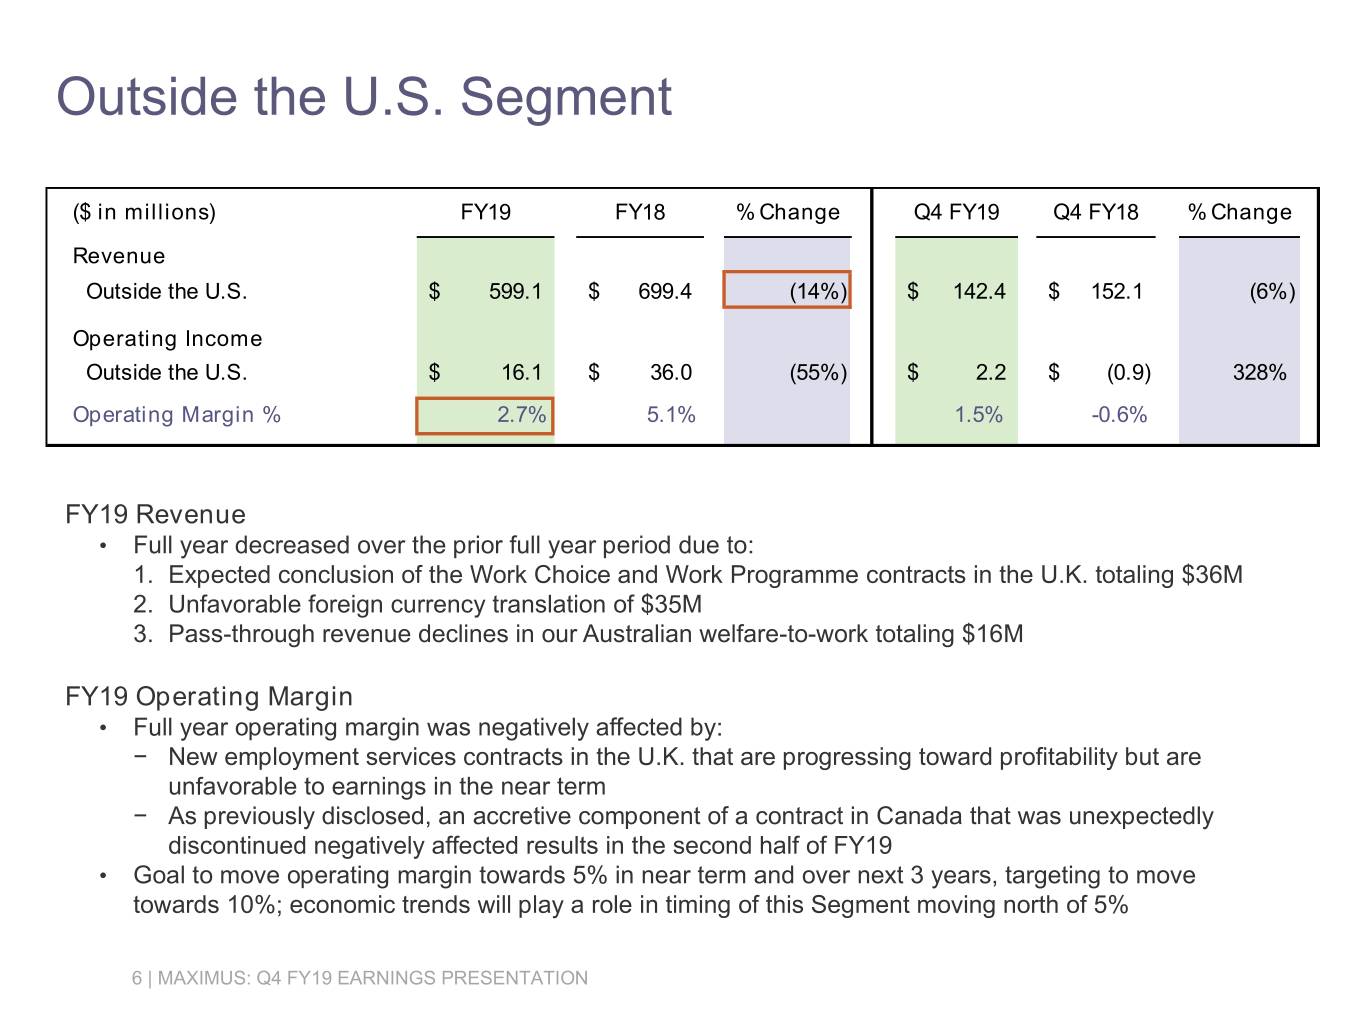
Outside the U.S. Segment ($ in millions) FY19 FY18 % Change Q4 FY19 Q4 FY18 % Change Revenue Outside the U.S. $ 599.1 $ 699.4 (14%) $ 142.4 $ 152.1 (6%) Operating Income Outside the U.S. $ 16.1 $ 36.0 (55%) $ 2.2 $ (0.9) 328% Operating Margin % 2.7% 5.1% 1.5% -0.6% FY19 Revenue • Full year decreased over the prior full year period due to: 1. Expected conclusion of the Work Choice and Work Programme contracts in the U.K. totaling $36M 2. Unfavorable foreign currency translation of $35M 3. Pass-through revenue declines in our Australian welfare-to-work totaling $16M FY19 Operating Margin • Full year operating margin was negatively affected by: − New employment services contracts in the U.K. that are progressing toward profitability but are unfavorable to earnings in the near term − As previously disclosed, an accretive component of a contract in Canada that was unexpectedly discontinued negatively affected results in the second half of FY19 • Goal to move operating margin towards 5% in near term and over next 3 years, targeting to move towards 10%; economic trends will play a role in timing of this Segment moving north of 5% 6 | MAXIMUS: Q4 FY19 EARNINGS PRESENTATION
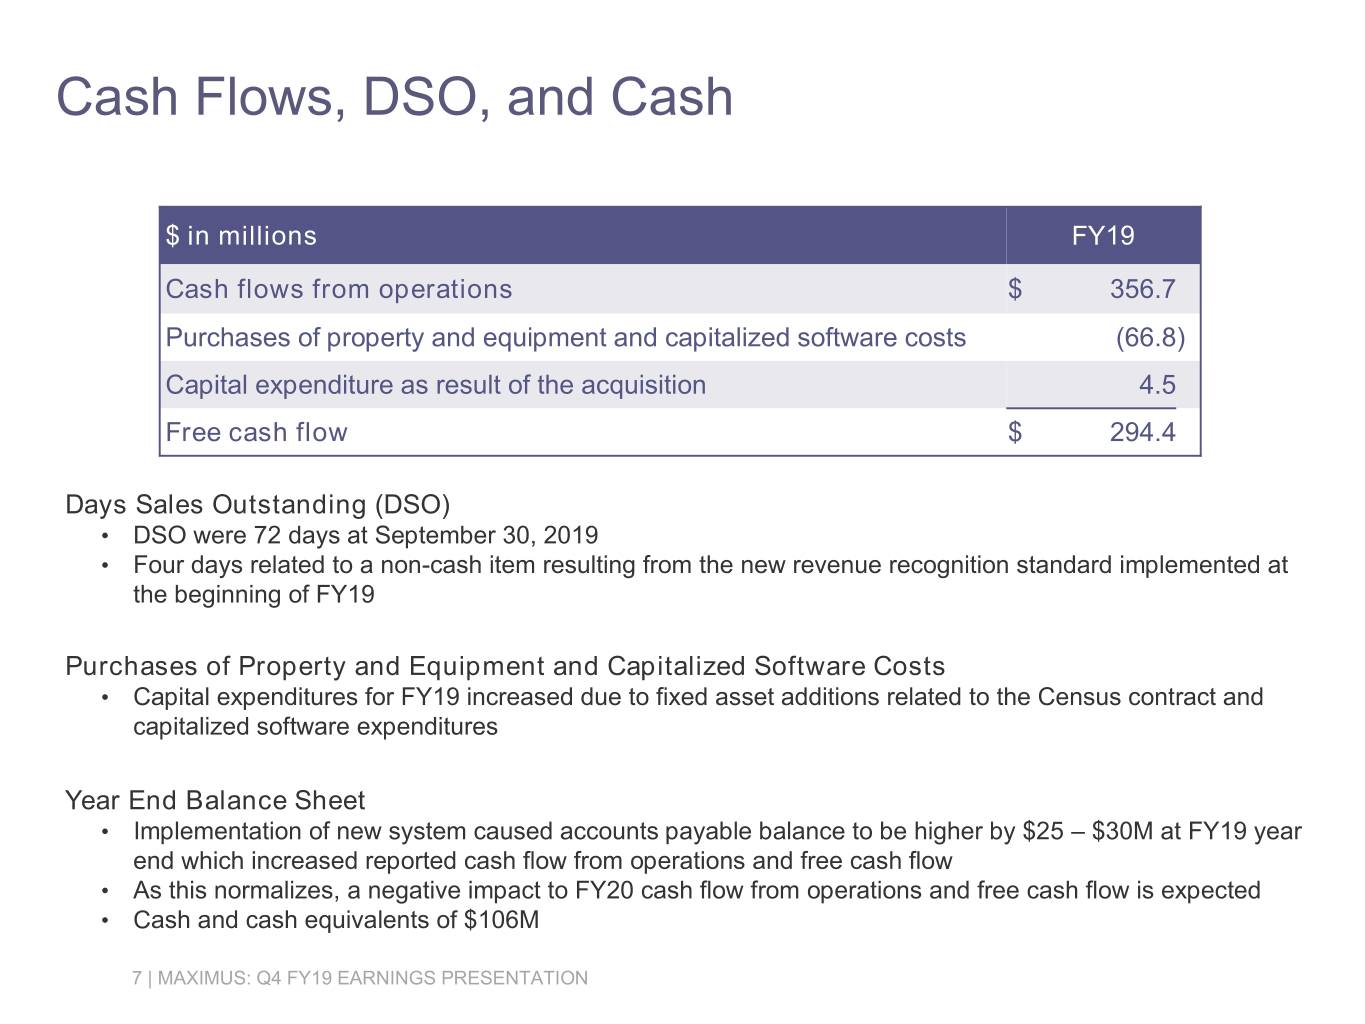
Cash Flows, DSO, and Cash $ in millions FY19 Cash flows from operations $ 356.7 Purchases of property and equipment and capitalized software costs (66.8) Capital expenditure as result of the acquisition 4.5 Free cash flow $ 294.4 Days Sales Outstanding (DSO) • DSO were 72 days at September 30, 2019 • Four days related to a non-cash item resulting from the new revenue recognition standard implemented at the beginning of FY19 Purchases of Property and Equipment and Capitalized Software Costs • Capital expenditures for FY19 increased due to fixed asset additions related to the Census contract and capitalized software expenditures Year End Balance Sheet • Implementation of new system caused accounts payable balance to be higher by $25 – $30M at FY19 year end which increased reported cash flow from operations and free cash flow • As this normalizes, a negative impact to FY20 cash flow from operations and free cash flow is expected • Cash and cash equivalents of $106M 7 | MAXIMUS: Q4 FY19 EARNINGS PRESENTATION
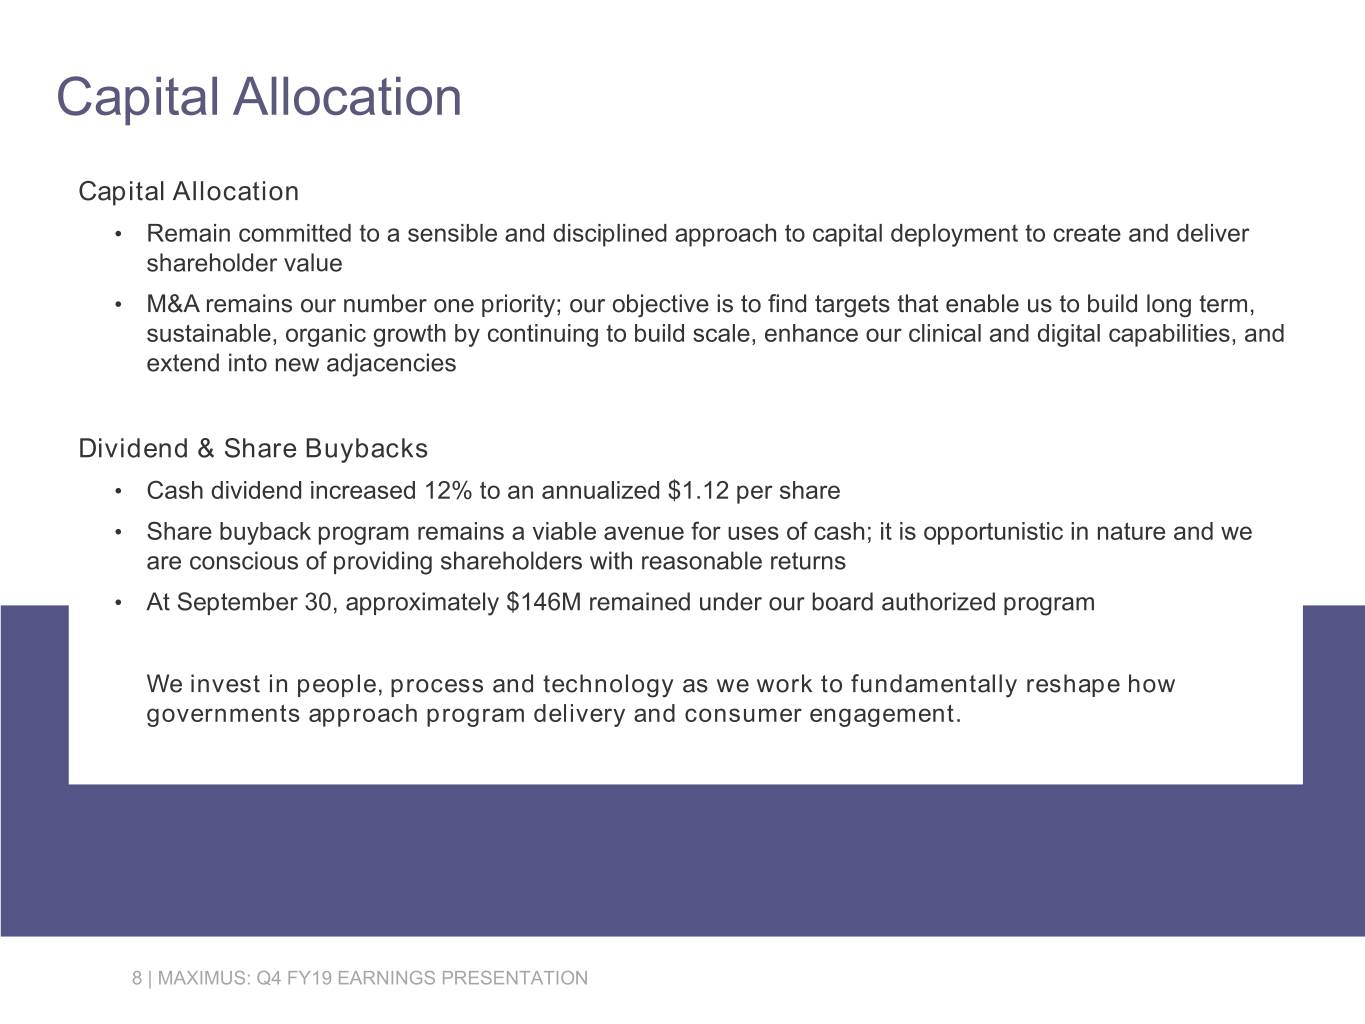
Capital Allocation Capital Allocation • Remain committed to a sensible and disciplined approach to capital deployment to create and deliver shareholder value • M&A remains our number one priority; our objective is to find targets that enable us to build long term, sustainable, organic growth by continuing to build scale, enhance our clinical and digital capabilities, and extend into new adjacencies Dividend & Share Buybacks • Cash dividend increased 12% to an annualized $1.12 per share • Share buyback program remains a viable avenue for uses of cash; it is opportunistic in nature and we are conscious of providing shareholders with reasonable returns • At September 30, approximately $146M remained under our board authorized program We invest in people, process and technology as we work to fundamentally reshape how governments approach program delivery and consumer engagement. 8 | MAXIMUS: Q4 FY19 EARNINGS PRESENTATION
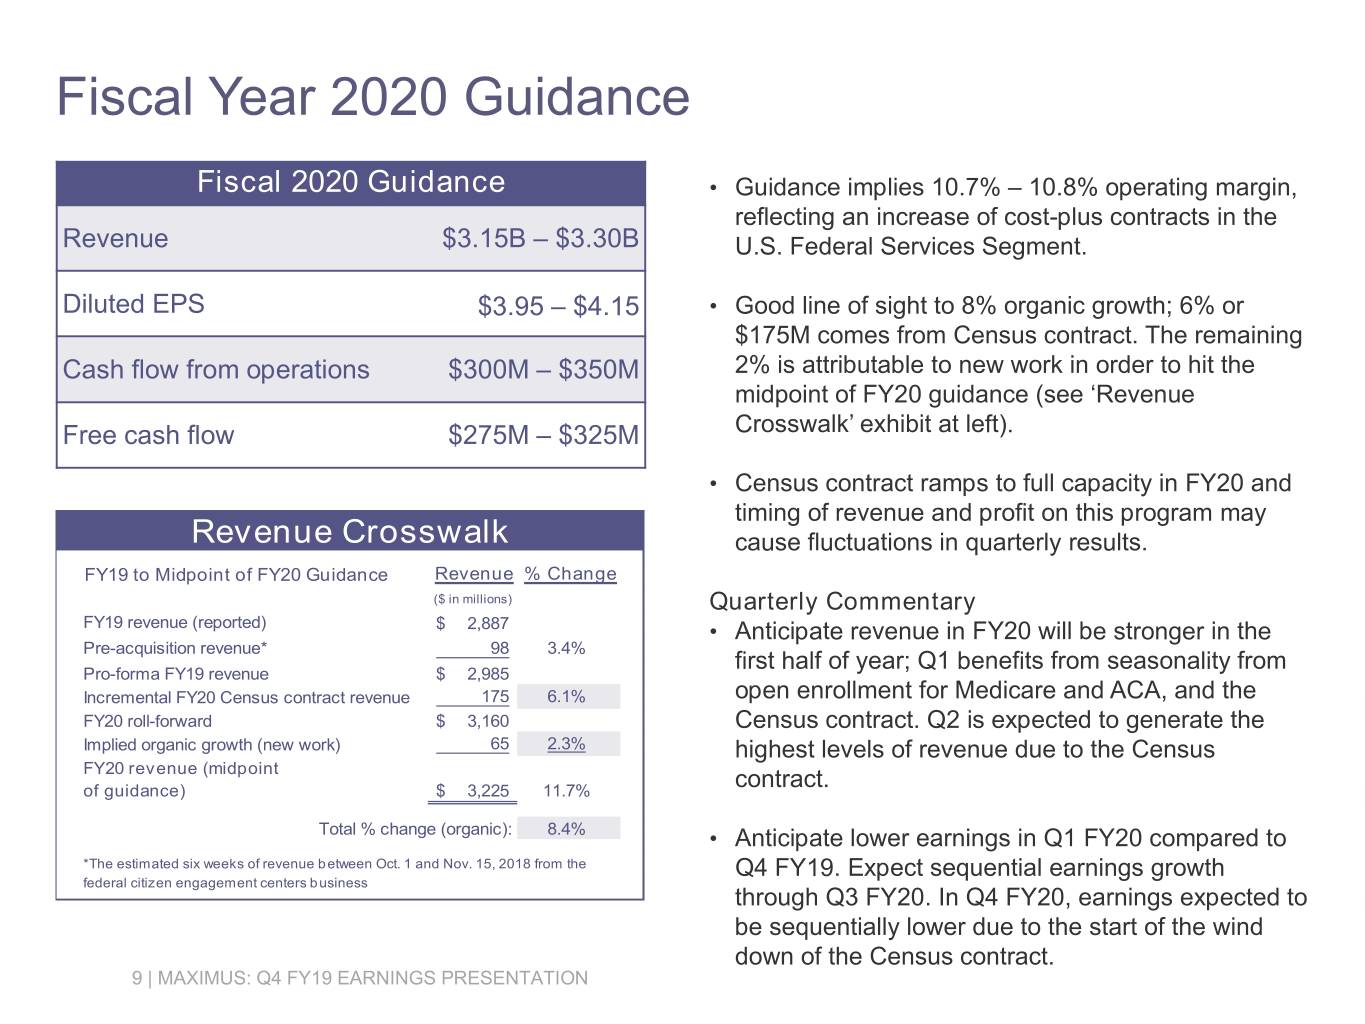
Fiscal Year 2020 Guidance Fiscal 2020 Guidance • Guidance implies 10.7% – 10.8% operating margin, reflecting an increase of cost-plus contracts in the Revenue $3.15B – $3.30B U.S. Federal Services Segment. Diluted EPS $3.95 – $4.15 • Good line of sight to 8% organic growth; 6% or $175M comes from Census contract. The remaining Cash flow from operations $300M – $350M 2% is attributable to new work in order to hit the midpoint of FY20 guidance (see ‘Revenue Free cash flow $275M – $325M Crosswalk’ exhibit at left). • Census contract ramps to full capacity in FY20 and timing of revenue and profit on this program may Revenue Crosswalk cause fluctuations in quarterly results. FY19 to Midpoint of FY20 Guidance Revenue % Change ($ in millions) Quarterly Commentary FY19 revenue (reported) $ 2,887 • Anticipate revenue in FY20 will be stronger in the Pre-acquisition revenue* 98 3.4% first half of year; Q1 benefits from seasonality from Pro-forma FY19 revenue $ 2,985 Incremental FY20 Census contract revenue 175 6.1% open enrollment for Medicare and ACA, and the FY20 roll-forward $ 3,160 Census contract. Q2 is expected to generate the Implied organic growth (new work) 65 2.3% highest levels of revenue due to the Census FY20 revenue (midpoint of guidance) $ 3,225 11.7% contract. Total % change (organic): 8.4% • Anticipate lower earnings in Q1 FY20 compared to *The estimated six weeks of revenue between Oct. 1 and Nov. 15, 2018 from the Q4 FY19. Expect sequential earnings growth federal citizen engagement centers business through Q3 FY20. In Q4 FY20, earnings expected to be sequentially lower due to the start of the wind down of the Census contract. 9 | MAXIMUS: Q4 FY19 EARNINGS PRESENTATION
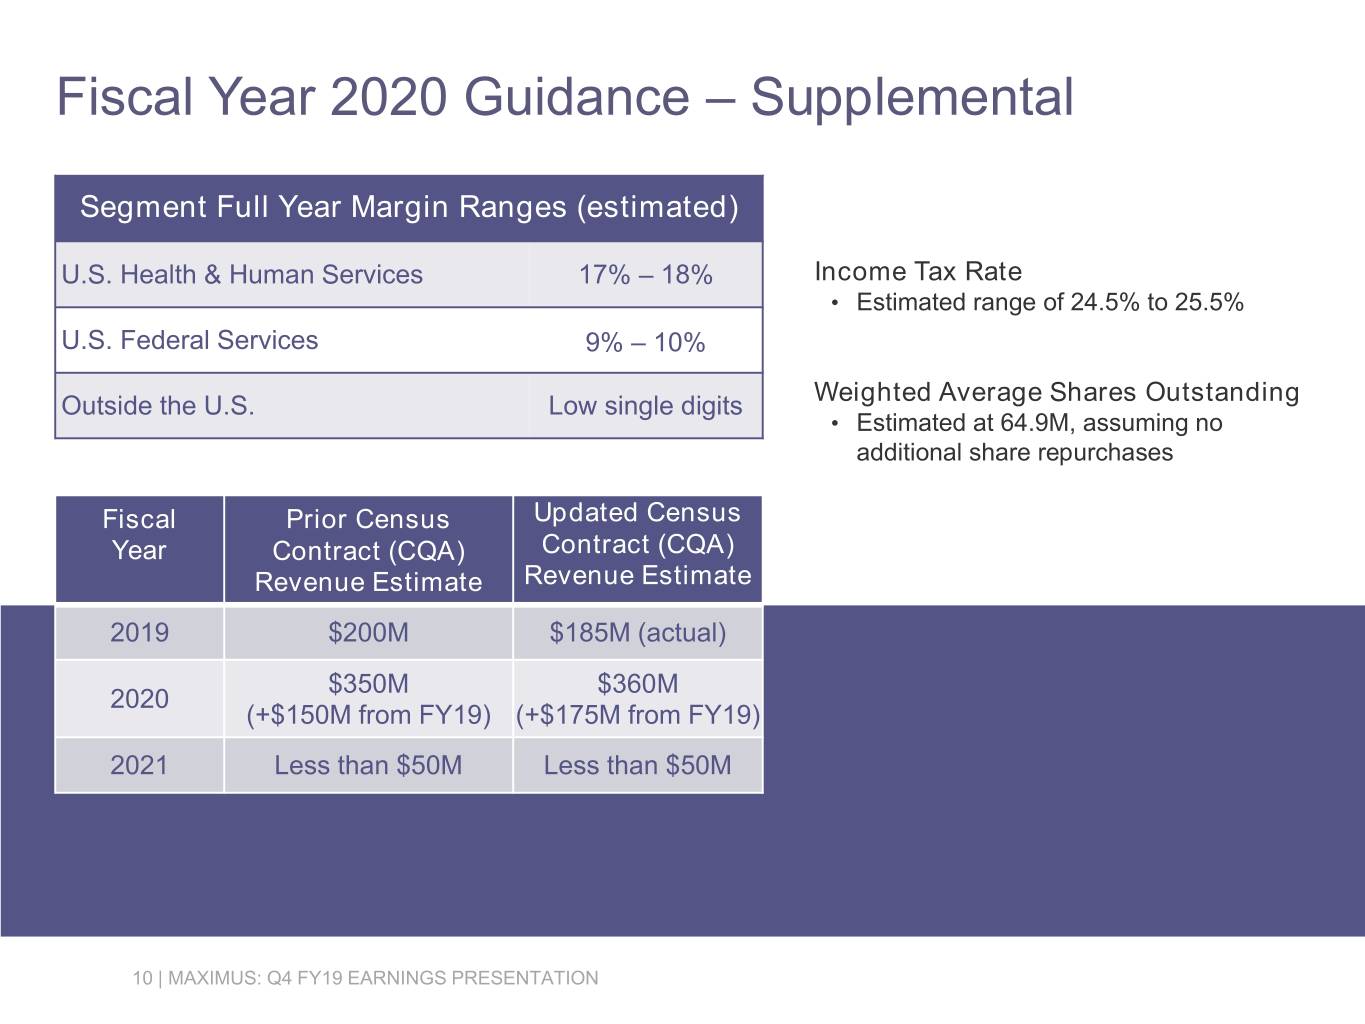
Fiscal Year 2020 Guidance – Supplemental Segment Full Year Margin Ranges (estimated) U.S. Health & Human Services 17% – 18% Income Tax Rate • Estimated range of 24.5% to 25.5% U.S. Federal Services 9% – 10% Weighted Average Shares Outstanding Outside the U.S. Low single digits • Estimated at 64.9M, assuming no additional share repurchases Fiscal Prior Census Updated Census Year Contract (CQA) Contract (CQA) Revenue Estimate Revenue Estimate 2019 $200M $185M (actual) $350M $360M 2020 (+$150M from FY19) (+$175M from FY19) 2021 Less than $50M Less than $50M 10 | MAXIMUS: Q4 FY19 EARNINGS PRESENTATION

Fiscal 2019 Fourth Quarter & Year End Earnings Call Bruce Caswell President & Chief Executive Officer November 19, 2019
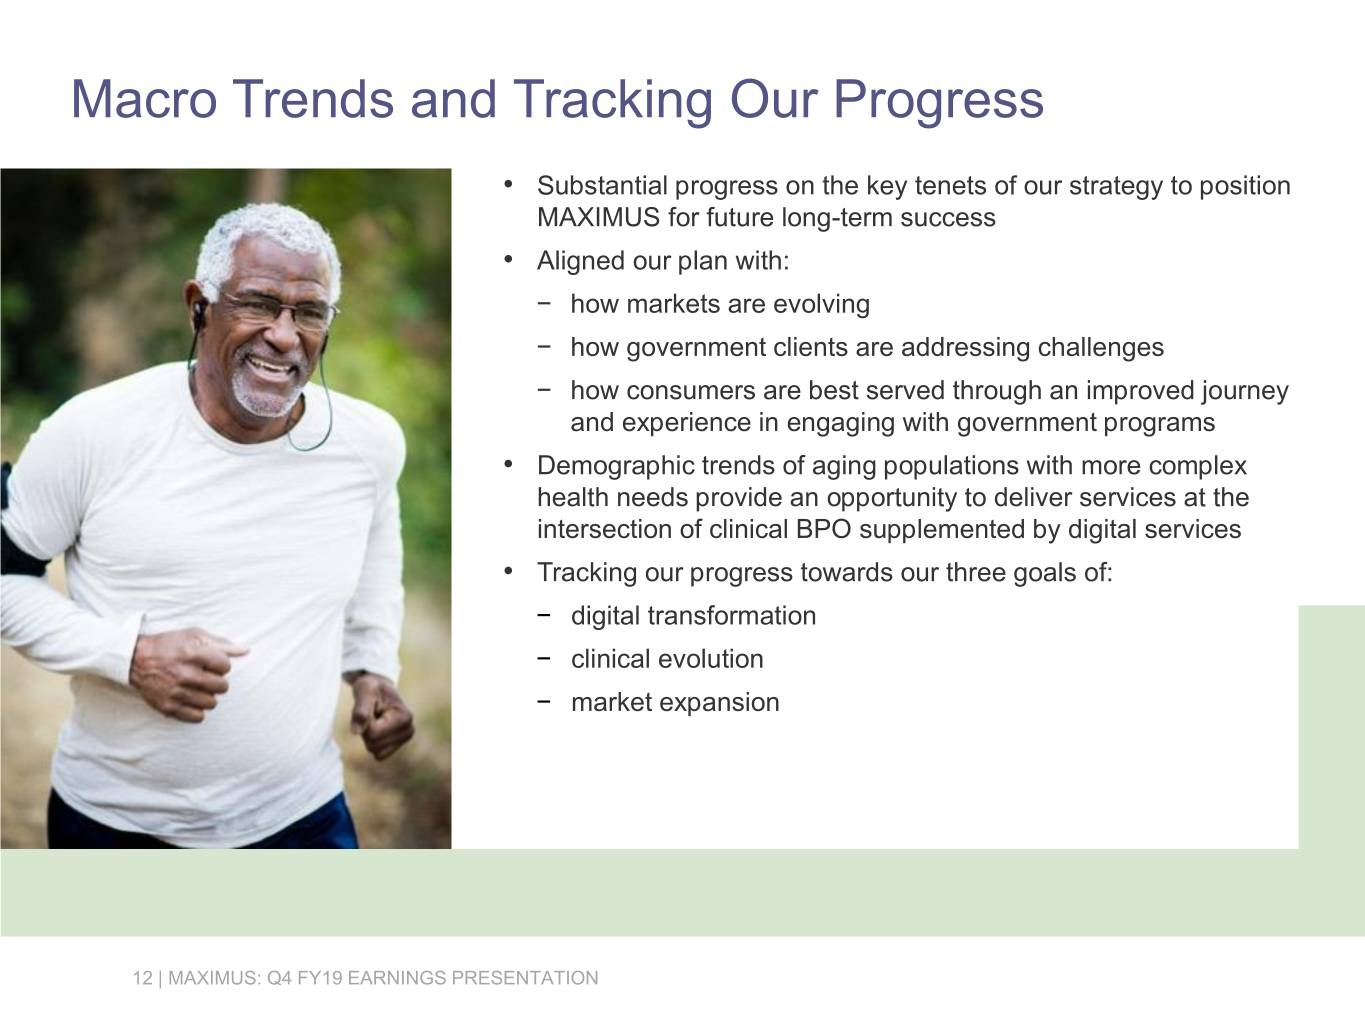
Macro Trends and Tracking Our Progress • Substantial progress on the key tenets of our strategy to position MAXIMUS for future long-term success • Aligned our plan with: − how markets are evolving − how government clients are addressing challenges − how consumers are best served through an improved journey and experience in engaging with government programs • Demographic trends of aging populations with more complex health needs provide an opportunity to deliver services at the intersection of clinical BPO supplemented by digital services • Tracking our progress towards our three goals of: − digital transformation − clinical evolution − market expansion 12 | MAXIMUS: Q4 FY19 EARNINGS PRESENTATION
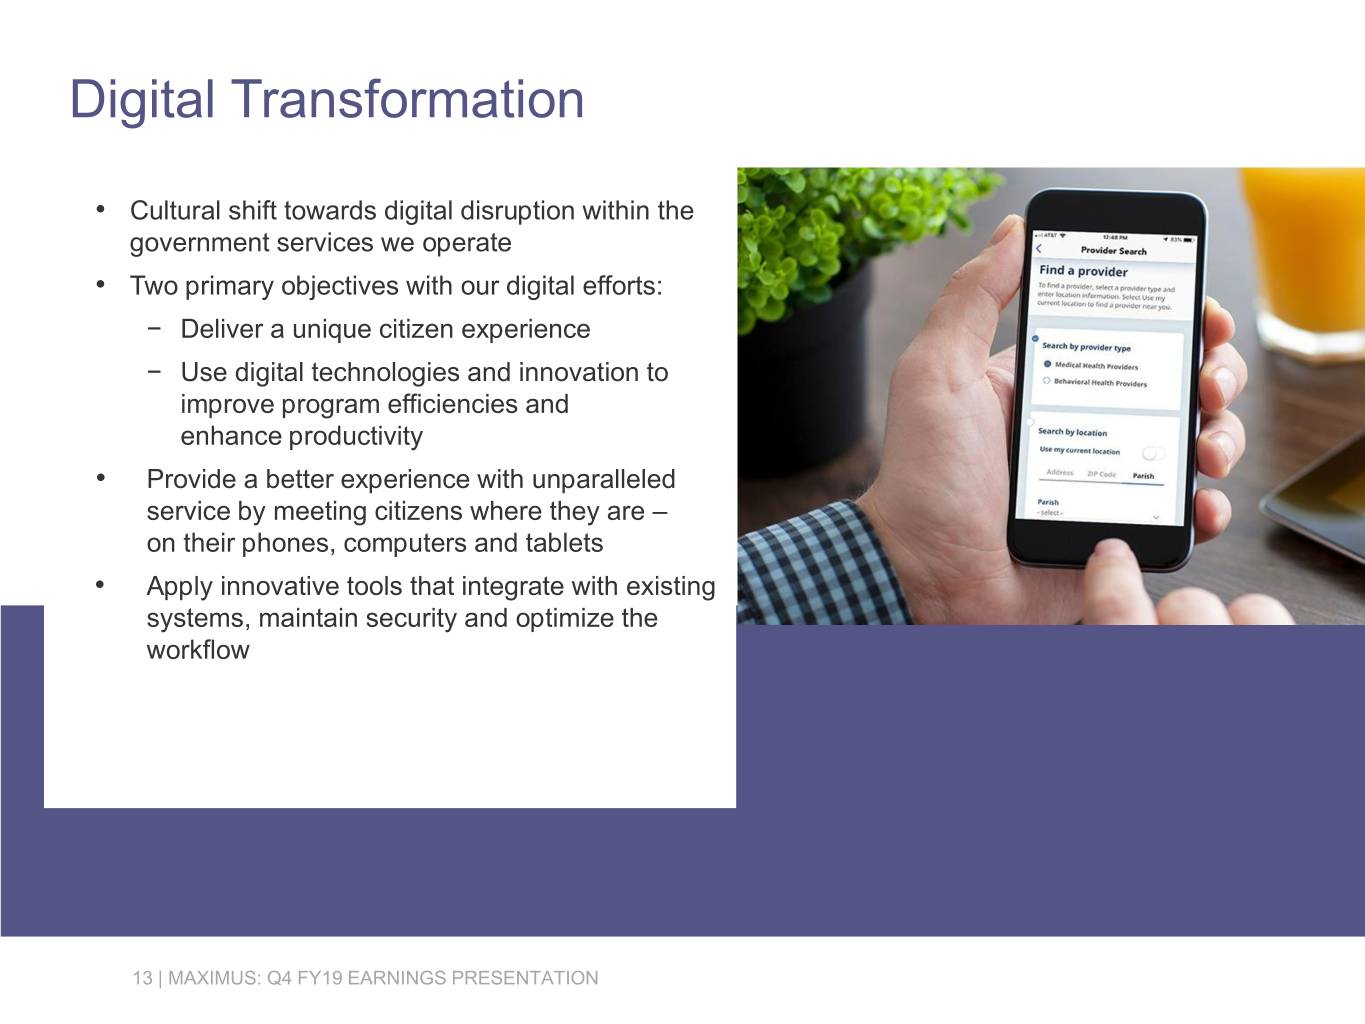
Digital Transformation • Cultural shift towards digital disruption within the government services we operate • Two primary objectives with our digital efforts: − Deliver a unique citizen experience − Use digital technologies and innovation to improve program efficiencies and enhance productivity • Provide a better experience with unparalleled service by meeting citizens where they are – on their phones, computers and tablets • Apply innovative tools that integrate with existing systems, maintain security and optimize the workflow 13 | MAXIMUS: Q4 FY19 EARNINGS PRESENTATION
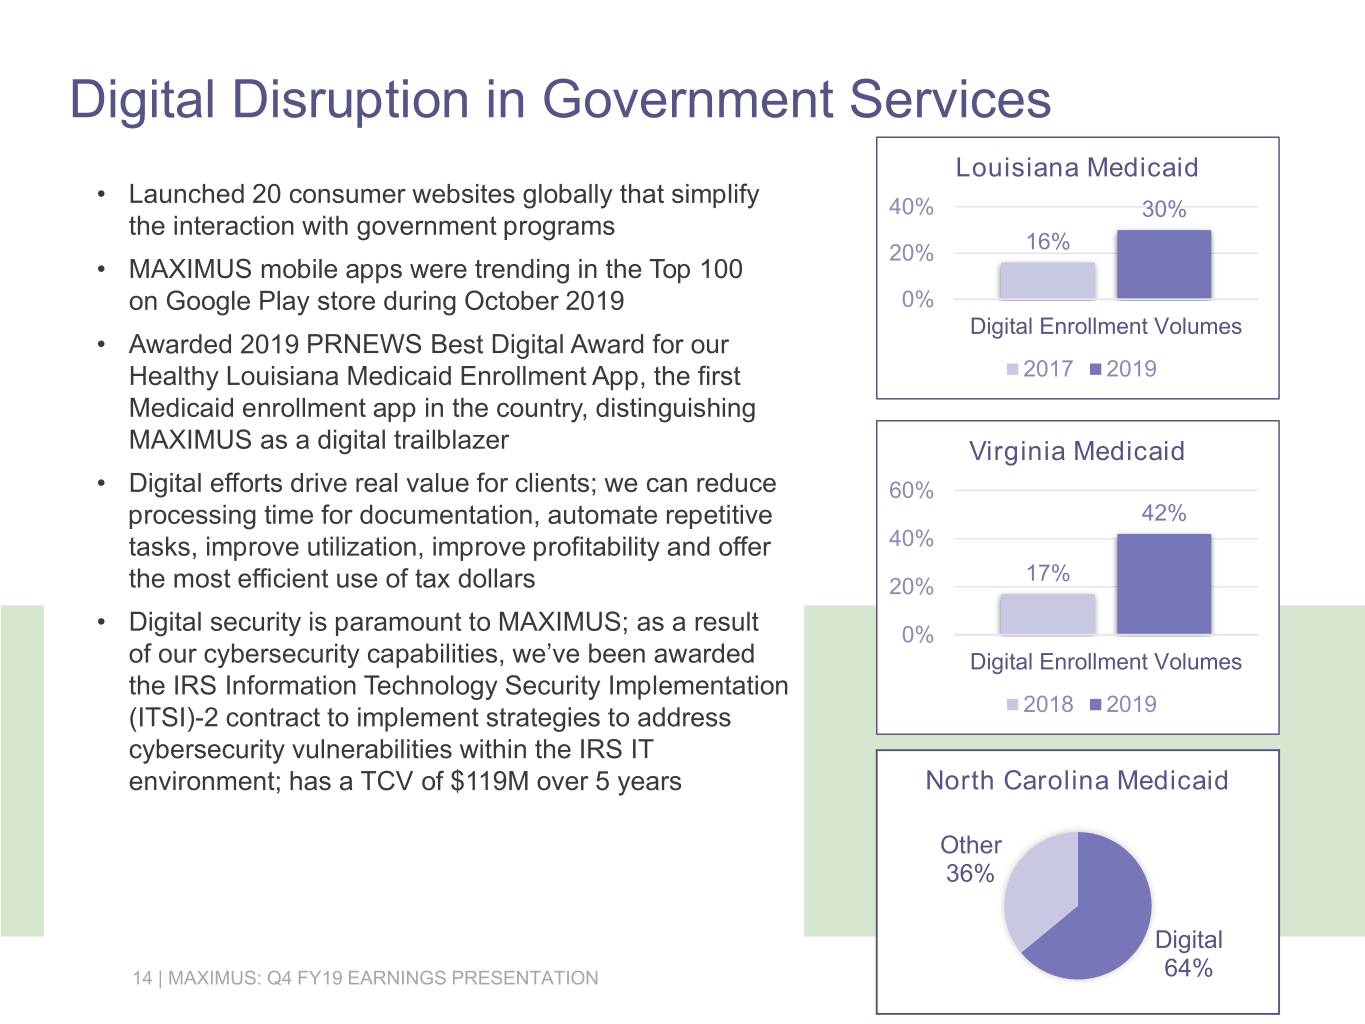
Digital Disruption in Government Services Louisiana Medicaid • Launched 20 consumer websites globally that simplify 40% 30% the interaction with government programs 20% 16% • MAXIMUS mobile apps were trending in the Top 100 on Google Play store during October 2019 0% Digital Enrollment Volumes • Awarded 2019 PRNEWS Best Digital Award for our Healthy Louisiana Medicaid Enrollment App, the first 2017 2019 Medicaid enrollment app in the country, distinguishing MAXIMUS as a digital trailblazer Virginia Medicaid • Digital efforts drive real value for clients; we can reduce 60% processing time for documentation, automate repetitive 42% tasks, improve utilization, improve profitability and offer 40% 17% the most efficient use of tax dollars 20% • Digital security is paramount to MAXIMUS; as a result 0% of our cybersecurity capabilities, we’ve been awarded Digital Enrollment Volumes the IRS Information Technology Security Implementation 2018 2019 (ITSI)-2 contract to implement strategies to address cybersecurity vulnerabilities within the IRS IT environment; has a TCV of $119M over 5 years North Carolina Medicaid Other 36% Digital 14 | MAXIMUS: Q4 FY19 EARNINGS PRESENTATION 64%
Patented Optimization Two additional U.S. patents awarded to MAXIMUS 1. Recognizes capabilities we developed to streamline performance monitoring, increase staff optimization and pinpoint lost productivity in our operations 2. Enables our projects to monitor and maintain the health of business processes via real-time alerts whenever anomalies occur, such as when a task becomes stuck in a queue • Complimenting one another, our three collective patents provide the ability to run real-world “what-if” scenarios which allows us to easily understand and visualize how changes—such as major technology investment or policy change—could impact program operations • Continual integration of data across our programs allows for new insights into the performance of our projects and extends operational value from metric management to outcome and behavioral analysis initiatives • These optimizations can achieve cost reductions of 20% to 30% while improving workflow, resource utilization and quality 15 | MAXIMUS: Q4 FY19 EARNINGS PRESENTATION
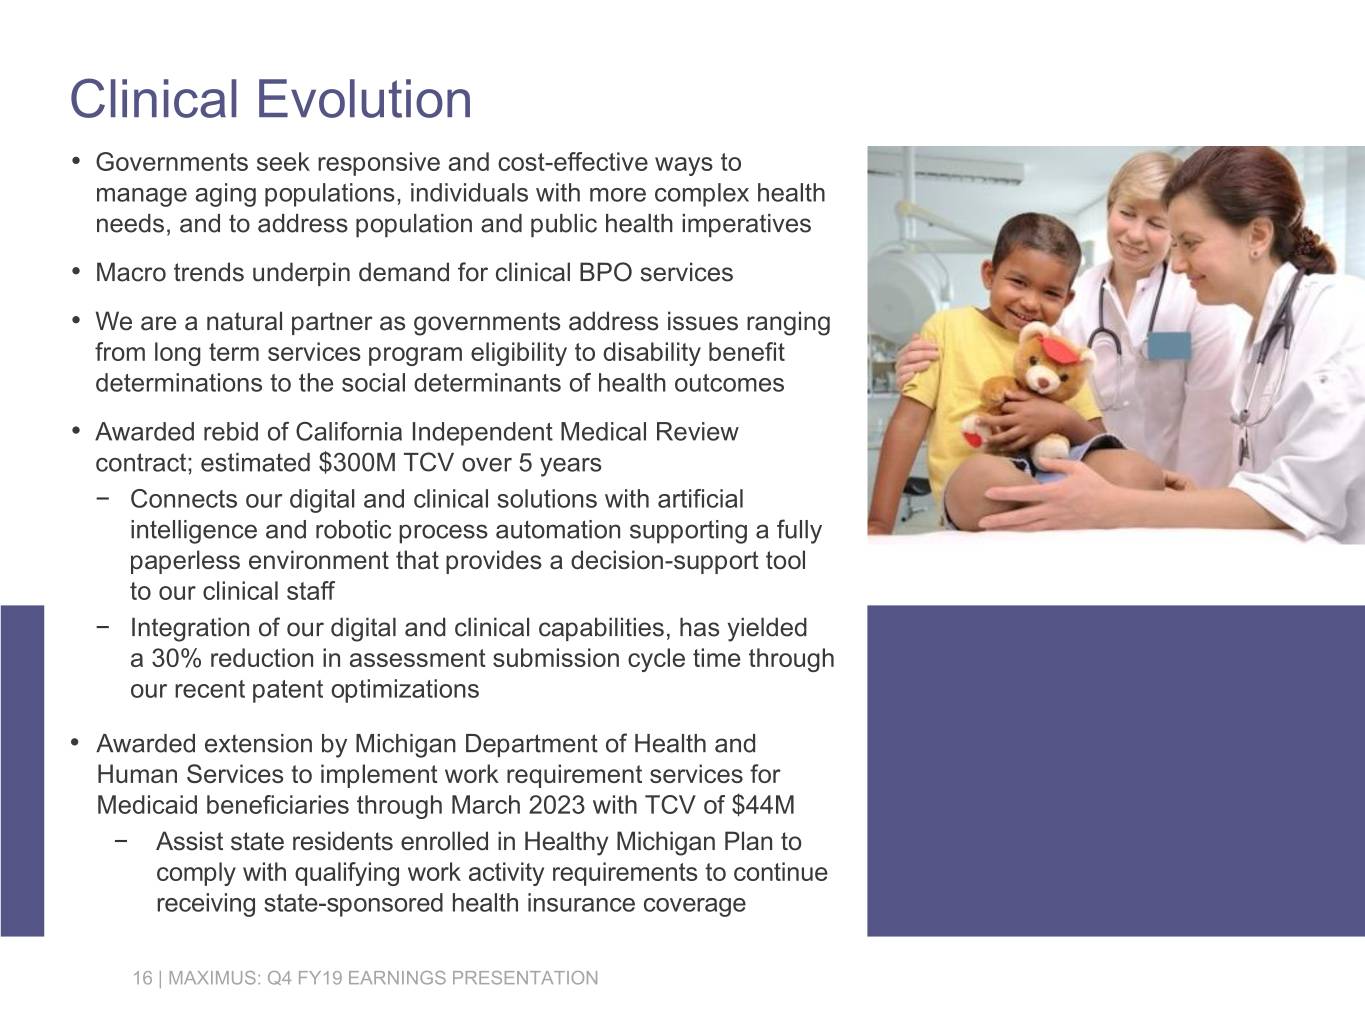
Clinical Evolution • Governments seek responsive and cost-effective ways to manage aging populations, individuals with more complex health needs, and to address population and public health imperatives • Macro trends underpin demand for clinical BPO services • We are a natural partner as governments address issues ranging from long term services program eligibility to disability benefit determinations to the social determinants of health outcomes • Awarded rebid of California Independent Medical Review contract; estimated $300M TCV over 5 years − Connects our digital and clinical solutions with artificial intelligence and robotic process automation supporting a fully paperless environment that provides a decision-support tool to our clinical staff − Integration of our digital and clinical capabilities, has yielded a 30% reduction in assessment submission cycle time through our recent patent optimizations • Awarded extension by Michigan Department of Health and Human Services to implement work requirement services for Medicaid beneficiaries through March 2023 with TCV of $44M − Assist state residents enrolled in Healthy Michigan Plan to comply with qualifying work activity requirements to continue receiving state-sponsored health insurance coverage 16 | MAXIMUS: Q4 FY19 EARNINGS PRESENTATION
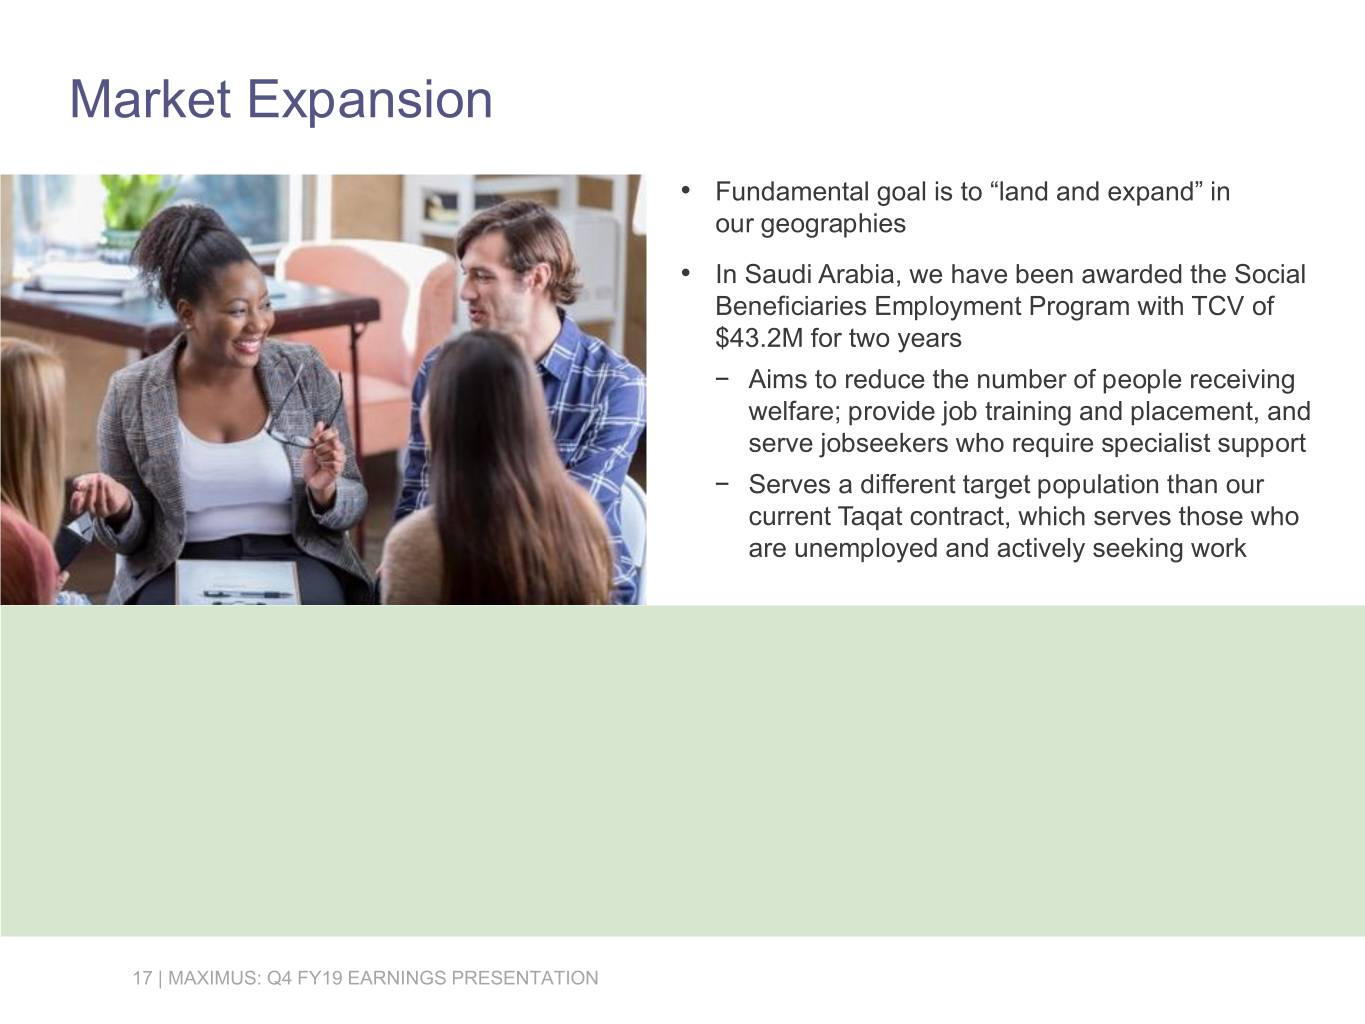
Market Expansion • Fundamental goal is to “land and expand” in our geographies • In Saudi Arabia, we have been awarded the Social Beneficiaries Employment Program with TCV of $43.2M for two years − Aims to reduce the number of people receiving welfare; provide job training and placement, and serve jobseekers who require specialist support − Serves a different target population than our current Taqat contract, which serves those who are unemployed and actively seeking work 17 | MAXIMUS: Q4 FY19 EARNINGS PRESENTATION
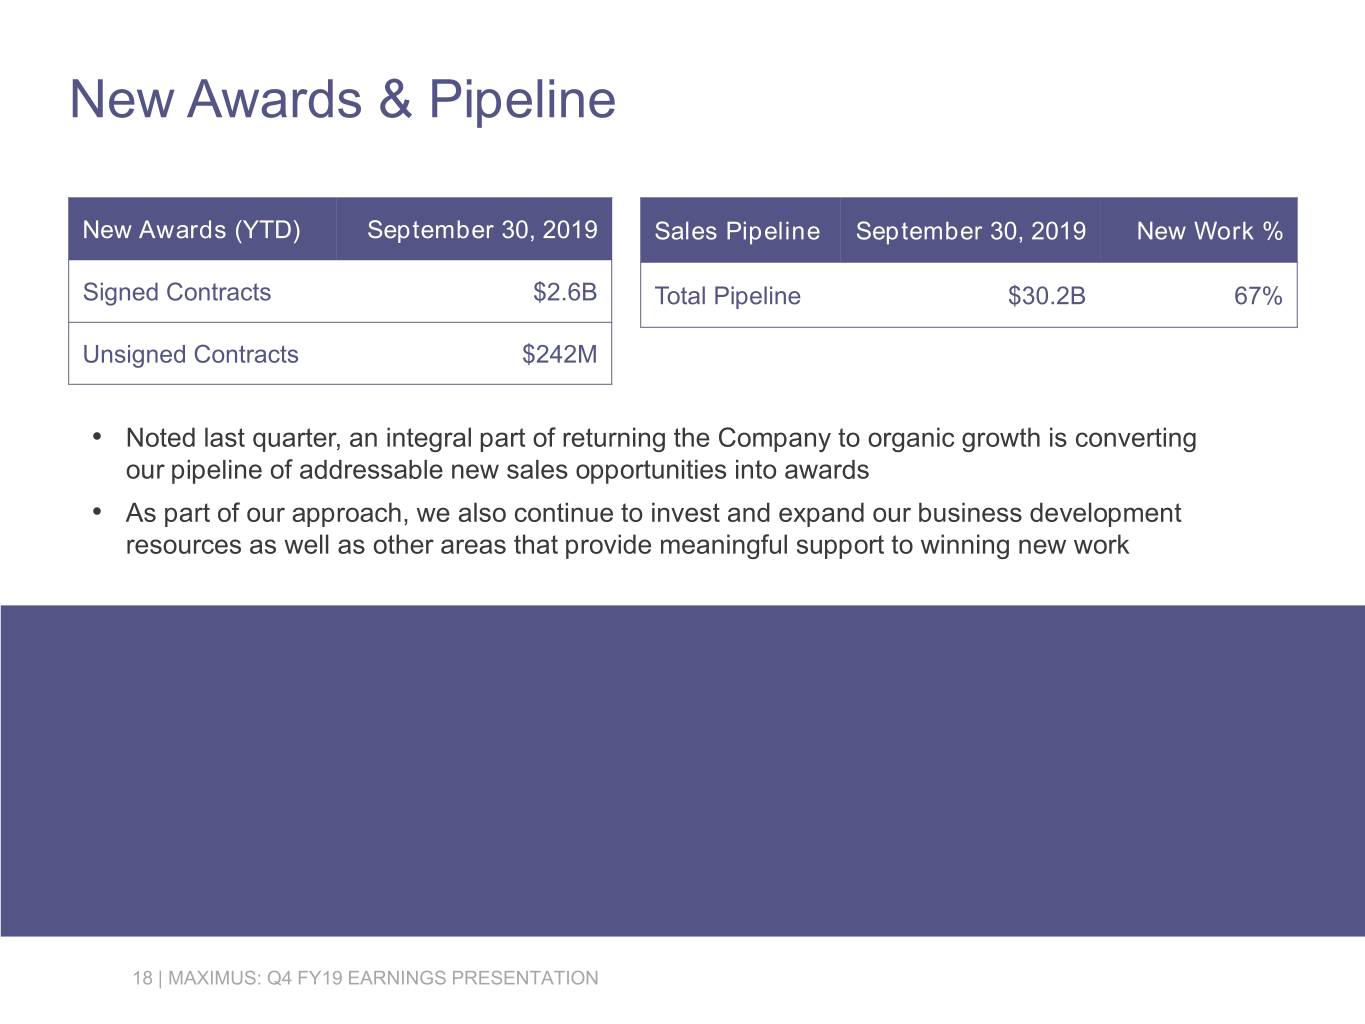
New Awards & Pipeline New Awards (YTD) September 30, 2019 Sales Pipeline September 30, 2019 New Work % Signed Contracts $2.6B Total Pipeline $30.2B 67% Unsigned Contracts $242M • Noted last quarter, an integral part of returning the Company to organic growth is converting our pipeline of addressable new sales opportunities into awards • As part of our approach, we also continue to invest and expand our business development resources as well as other areas that provide meaningful support to winning new work 18 | MAXIMUS: Q4 FY19 EARNINGS PRESENTATION
Conclusion • Continued progress on management’s strategic plan to lead a digital transformation, grow our clinically related services and expand in key priority markets and adjacencies • M&A remains a priority for us as we aim to find targets that enable us to build long term, sustainable, organic growth by continuing to build scale, enhance our clinical and digital capabilities and extend into new areas • I want to thank our employees around the globe for their hard work and continued dedication to providing superior customer service in connecting people to government benefit programs every day 19 | MAXIMUS: Q4 FY19 EARNINGS PRESENTATION
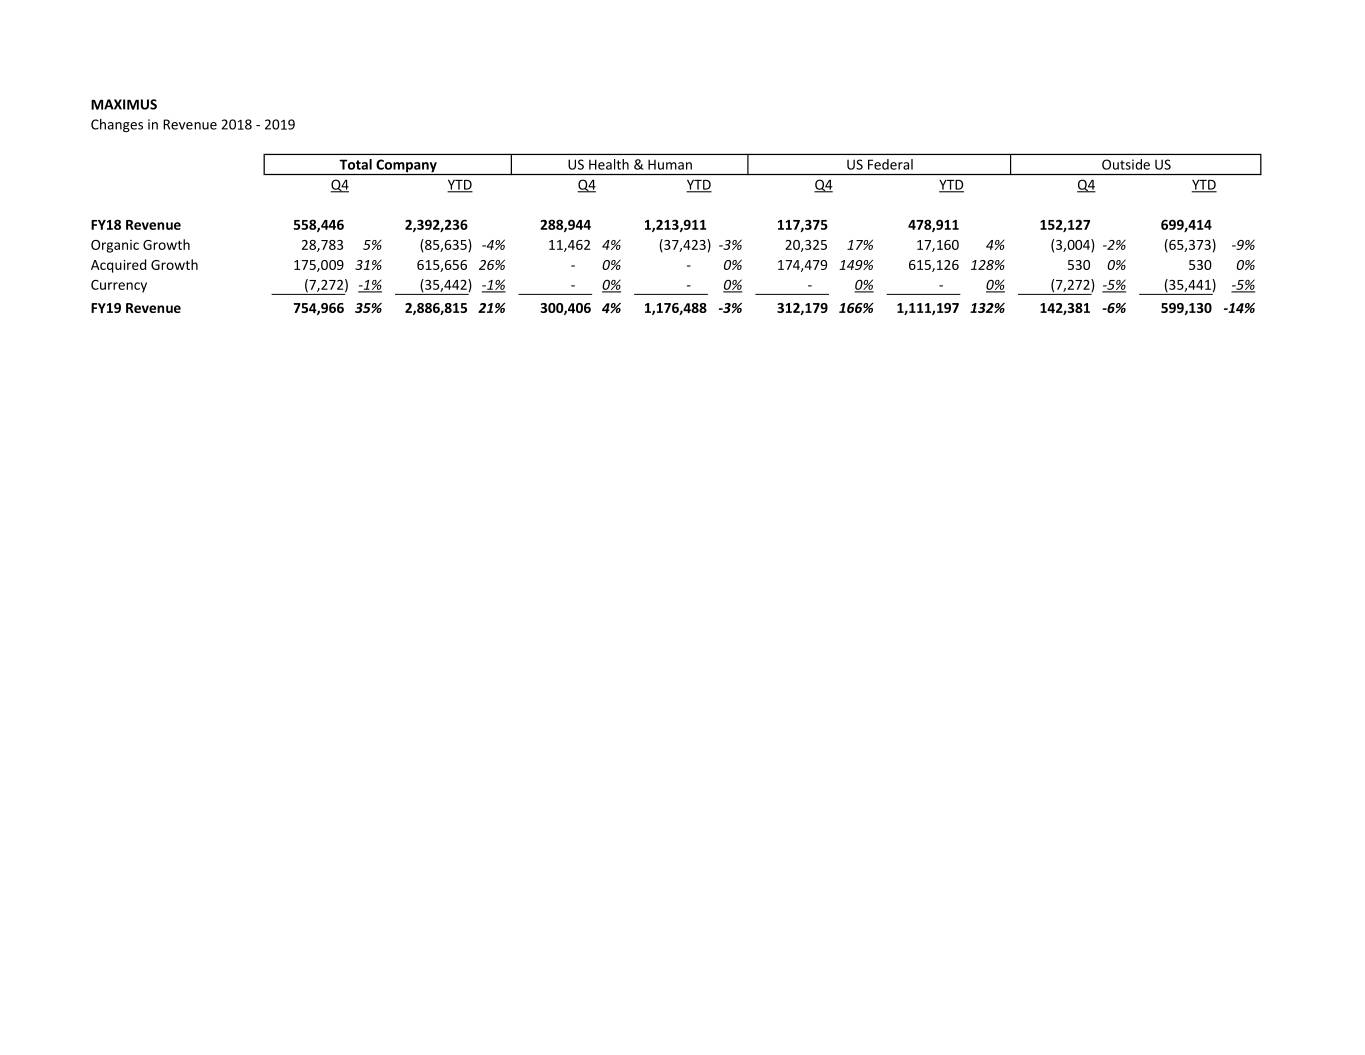
MAXIMUS Changes in Revenue 2018 ‐ 2019 Total Company US Health & Human US Federal Outside US Q4 YTD Q4 YTD Q4 YTD Q4 YTD FY18 Revenue 558,446 2,392,236 288,944 1,213,911 117,375 478,911 152,127 699,414 Organic Growth 28,783 5% (85,635) ‐4% 11,462 4% (37,423) ‐3% 20,325 17% 17,160 4% (3,004) ‐2% (65,373) ‐9% Acquired Growth 175,009 31% 615,656 26% ‐ 0% ‐ 0% 174,479 149% 615,126 128% 530 0% 530 0% Currency (7,272) ‐1% (35,442) ‐1% ‐ 0% ‐ 0% ‐ 0% ‐ 0% (7,272) ‐5% (35,441) ‐5% FY19 Revenue 754,966 35% 2,886,815 21% 300,406 4% 1,176,488 ‐3% 312,179 166% 1,111,197 132% 142,381 ‐6% 599,130 ‐14%