
Fiscal 2019 Third Quarter Earnings Call Rick Nadeau Chief Financial Officer August 8, 2019 1 | MAXIMUS: Q3 FY19 EARNINGS PRESENTATION
Forward-looking Statements & Non-GAAP Information These slides should be read in conjunction with the Company’s most recent quarterly earnings press release, along with listening to or reading a transcript of the comments of Company management from our most recent quarterly earnings conference call. This document may contain non-GAAP financial information. Management uses this information in its internal analysis of results and believes that this information may be informative to investors in gauging the quality of our financial performance, identifying trends in our results, and providing meaningful period-to-period comparisons. These measures should be used in conjunction with, rather than instead of, their comparable GAAP measures. For a reconciliation of non-GAAP measures to the comparable GAAP measures presented in this document, see the Company’s most recent quarterly earnings press release. Throughout this presentation, numbers may not add due to rounding. Included in this document are forward-looking statements within the meaning of the safe harbor provisions of the United States Private Securities Litigation Reform Act of 1995. Forward-looking statements can be identified by words such as: “anticipate,” “intend,” “plan,” “goal,” “seek,” “opportunity,” “could,” “potential,” “believe,” “project,” “estimate,” “expect,” “strategy,” “future,” “likely,” “may,” “should,” “will” and similar references to future periods. Forward-looking statements are neither historical facts nor assurances of future performance. Instead, they are based only on our current beliefs, expectations and assumptions regarding the future of our business, future plans and strategies, projections, anticipated events and trends, the economy and other future conditions. Because forward-looking statements relate to the future, they are subject to inherent uncertainties, risks and changes in circumstances that are difficult to predict and many of which are outside of our control. Our actual results and financial condition may differ materially from those indicated in the forward-looking statements. Therefore, you should not rely on any of these forward-looking statements. Important factors that could cause our actual results and financial condition to differ materially from those indicated in the forward-looking statements include, among others, the factors set forth in Exhibit 99.1 under the caption "Special Considerations and Risk Factors," in our Annual Report on Form 10-K for the year ended September 30, 2018, which was filed with the Securities and Exchange Commission on November 20, 2018 and the matters listed in our “Special Note Regarding Forward- Looking Statements” in our recently filed Quarterly Report on Form 10-Q. Any forward-looking statement made by us in this press release is based only on information currently available to us and speaks only as of the date on which it is made. We undertake no obligation to publicly update any forward-looking statement, whether written or oral, that may be made from time to time, whether as a result of new information, future developments or otherwise. 2 | MAXIMUS: Q3 FY19 EARNINGS PRESENTATION
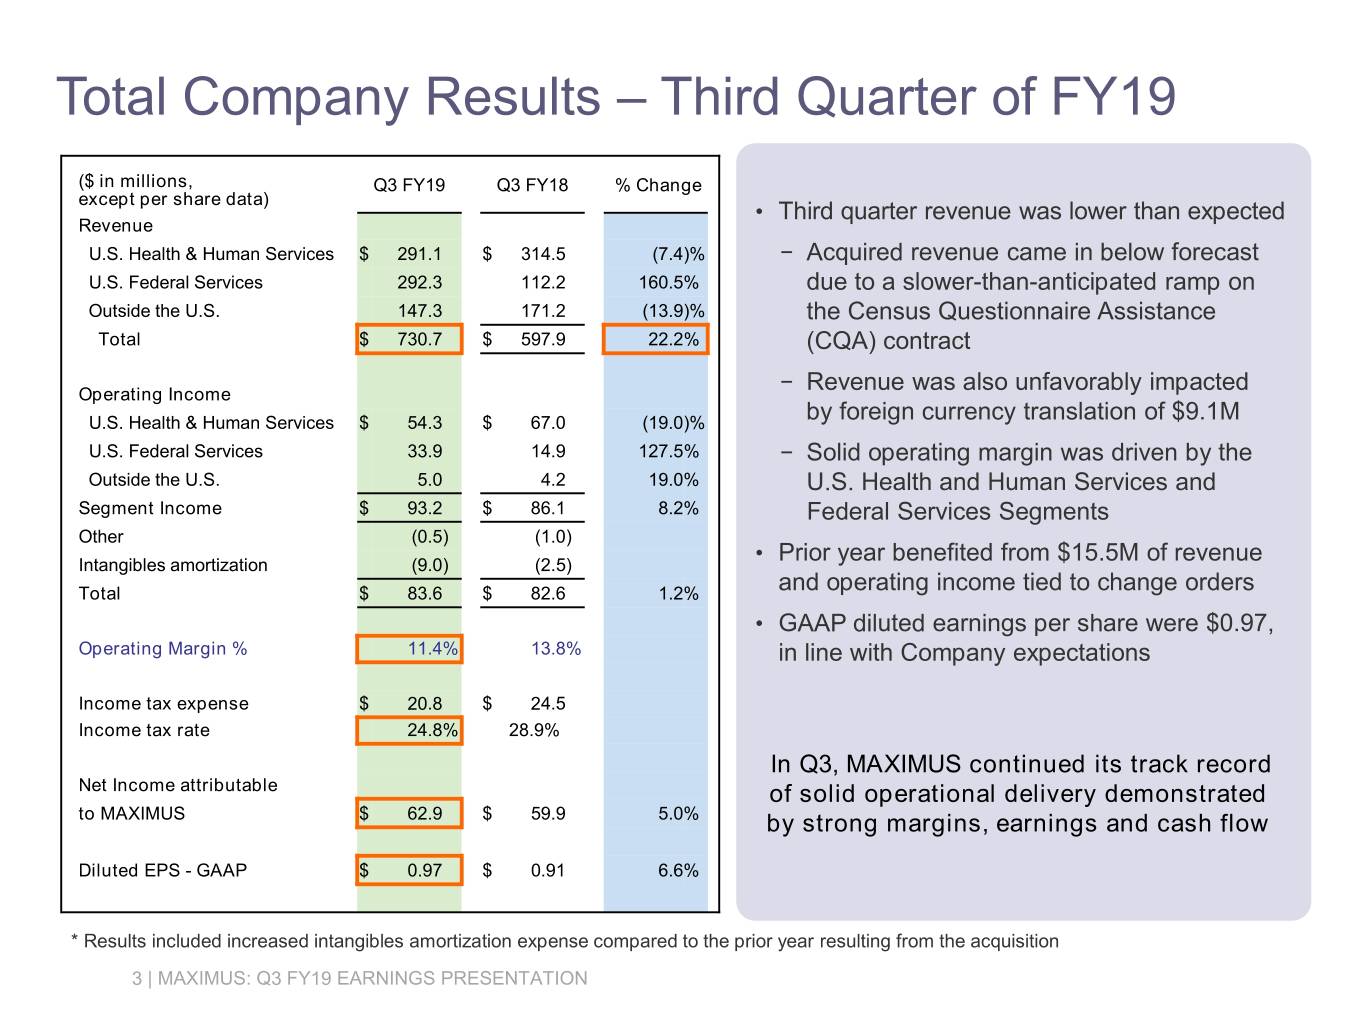
Total Company Results – Third Quarter of FY19 ($ in millions, Q3 FY19 Q3 FY18 % Change except per share data) • Third quarter revenue was lower than expected Revenue U.S. Health & Human Services $ 291.1 $ 314.5 (7.4)% − Acquired revenue came in below forecast U.S. Federal Services 292.3 112.2 160.5% due to a slower-than-anticipated ramp on Outside the U.S. 147.3 171.2 (13.9)% the Census Questionnaire Assistance Total $ 730.7 $ 597.9 22.2% (CQA) contract − Revenue was also unfavorably impacted Operating Income U.S. Health & Human Services $ 54.3 $ 67.0 (19.0)% by foreign currency translation of $9.1M U.S. Federal Services 33.9 14.9 127.5% − Solid operating margin was driven by the Outside the U.S. 5.0 4.2 19.0% U.S. Health and Human Services and Segment Income $ 93.2 $ 86.1 8.2% Federal Services Segments Other (0.5) (1.0) • Prior year benefited from $15.5M of revenue Intangibles amortization (9.0) (2.5) Total $ 83.6 $ 82.6 1.2% and operating income tied to change orders • GAAP diluted earnings per share were $0.97, Operating Margin % 11.4% 13.8% in line with Company expectations Income tax expense $ 20.8 $ 24.5 Income tax rate 24.8% 28.9% In Q3, MAXIMUS continued its track record Net Income attributable of solid operational delivery demonstrated to MAXIMUS $ 62.9 $ 59.9 5.0% by strong margins, earnings and cash flow Diluted EPS - GAAP $ 0.97 $ 0.91 6.6% * Results included increased intangibles amortization expense compared to the prior year resulting from the acquisition 3 | MAXIMUS: Q3 FY19 EARNINGS PRESENTATION
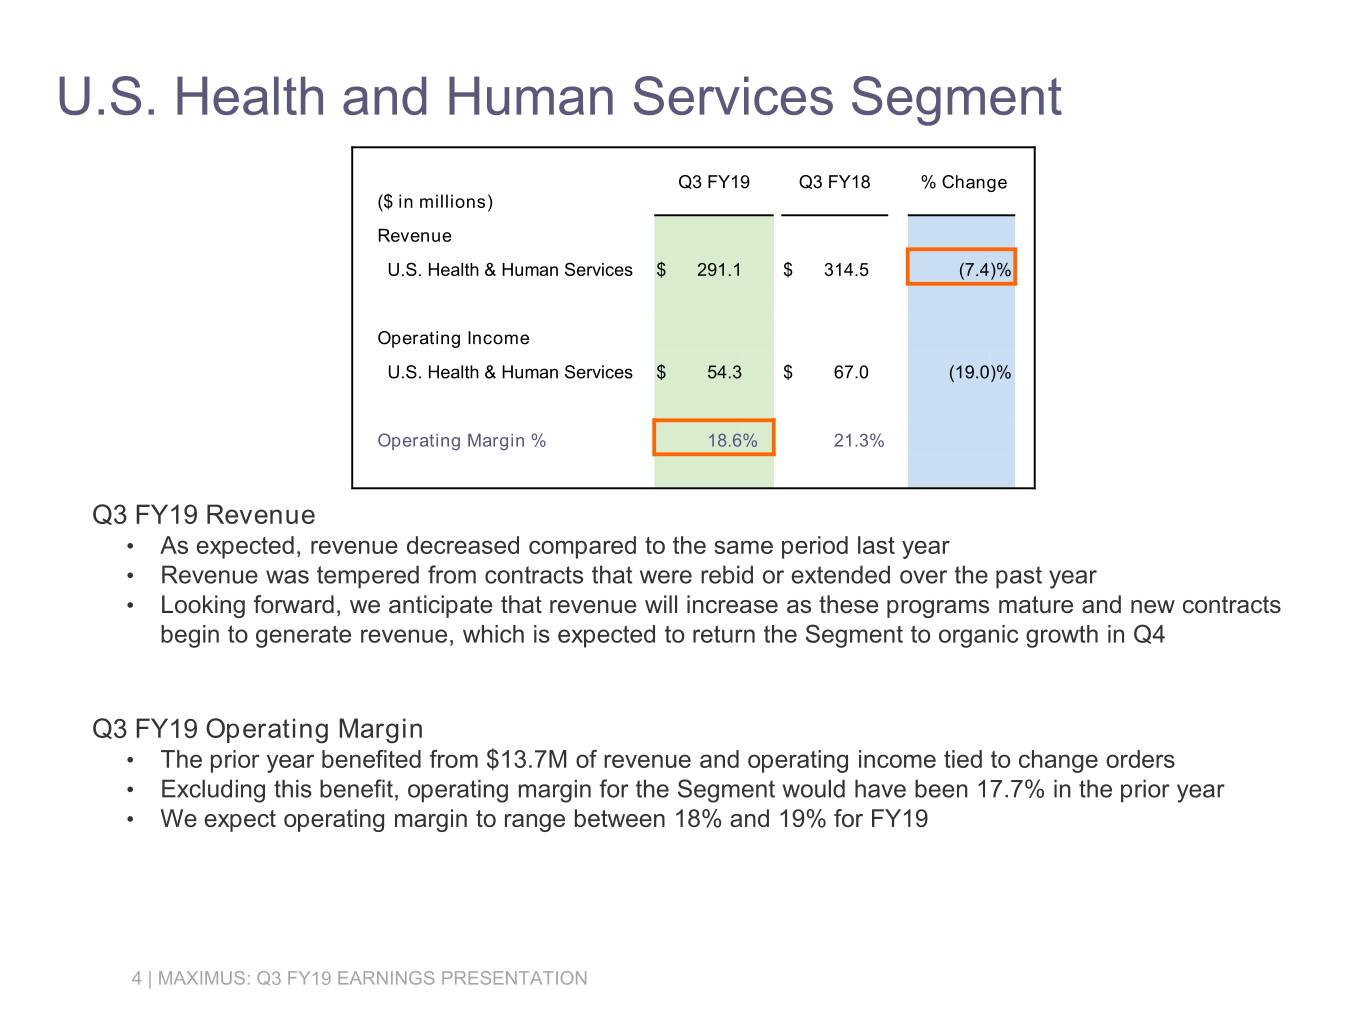
U.S. Health and Human Services Segment Q3 FY19 Q3 FY18 % Change ($ in millions) Revenue U.S. Health & Human Services $ 291.1 $ 314.5 (7.4)% Operating Income U.S. Health & Human Services $ 54.3 $ 67.0 (19.0)% Operating Margin % 18.6% 21.3% Q3 FY19 Revenue • As expected, revenue decreased compared to the same period last year • Revenue was tempered from contracts that were rebid or extended over the past year • Looking forward, we anticipate that revenue will increase as these programs mature and new contracts begin to generate revenue, which is expected to return the Segment to organic growth in Q4 Q3 FY19 Operating Margin • The prior year benefited from $13.7M of revenue and operating income tied to change orders • Excluding this benefit, operating margin for the Segment would have been 17.7% in the prior year • We expect operating margin to range between 18% and 19% for FY19 4 | MAXIMUS: Q3 FY19 EARNINGS PRESENTATION
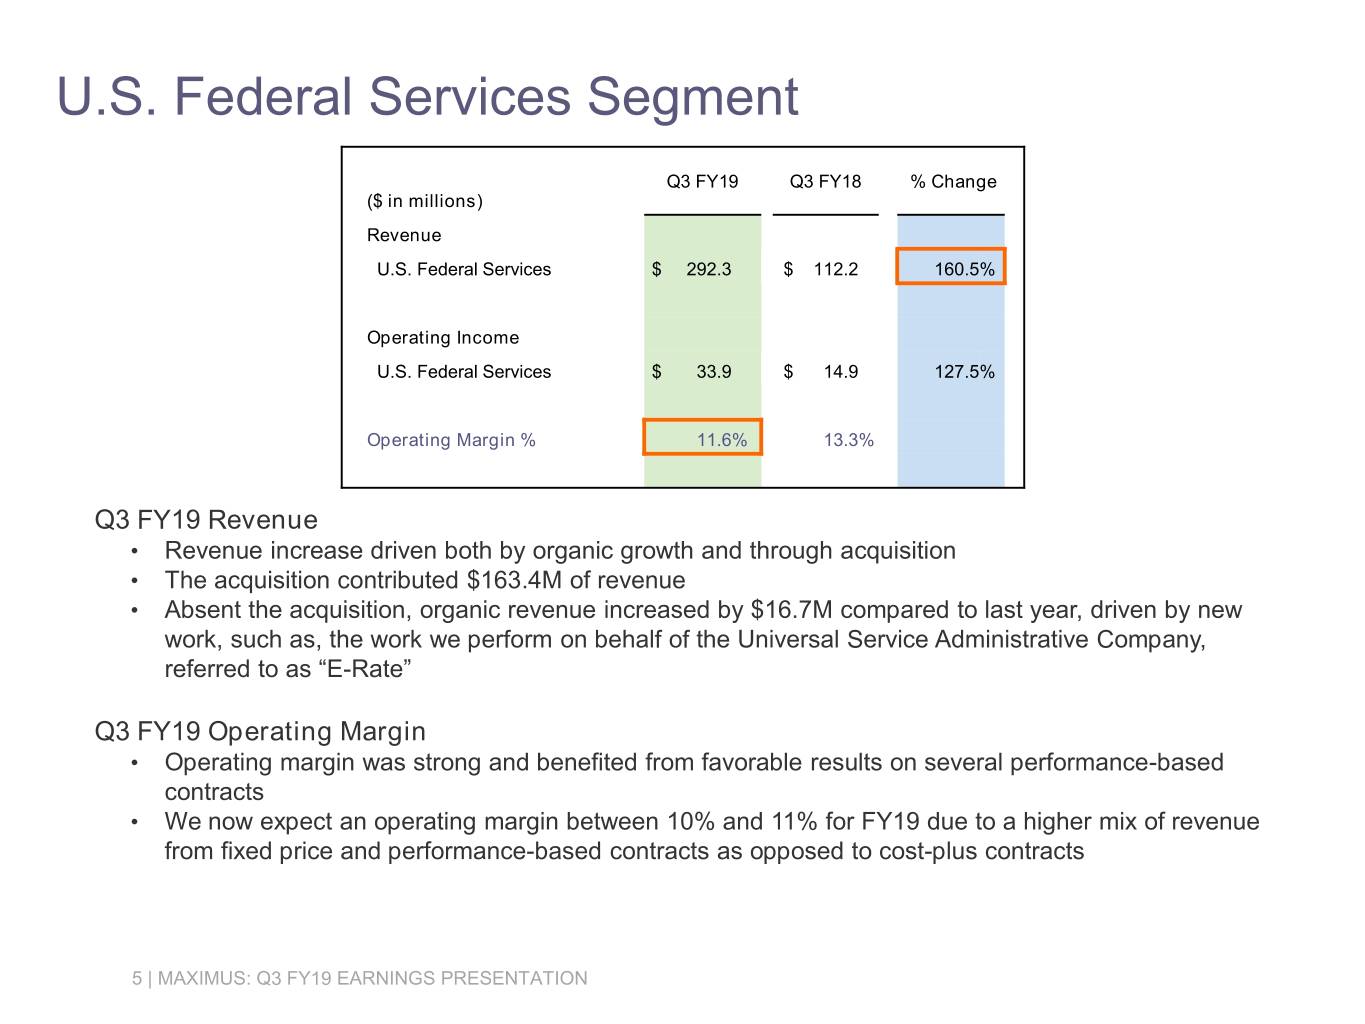
U.S. Federal Services Segment Q3 FY19 Q3 FY18 % Change ($ in millions) Revenue U.S. Federal Services $ 292.3 $ 112.2 160.5% Operating Income U.S. Federal Services $ 33.9 $ 14.9 127.5% Operating Margin % 11.6% 13.3% Q3 FY19 Revenue • Revenue increase driven both by organic growth and through acquisition • The acquisition contributed $163.4M of revenue • Absent the acquisition, organic revenue increased by $16.7M compared to last year, driven by new work, such as, the work we perform on behalf of the Universal Service Administrative Company, referred to as “E-Rate” Q3 FY19 Operating Margin • Operating margin was strong and benefited from favorable results on several performance-based contracts • We now expect an operating margin between 10% and 11% for FY19 due to a higher mix of revenue from fixed price and performance-based contracts as opposed to cost-plus contracts 5 | MAXIMUS: Q3 FY19 EARNINGS PRESENTATION
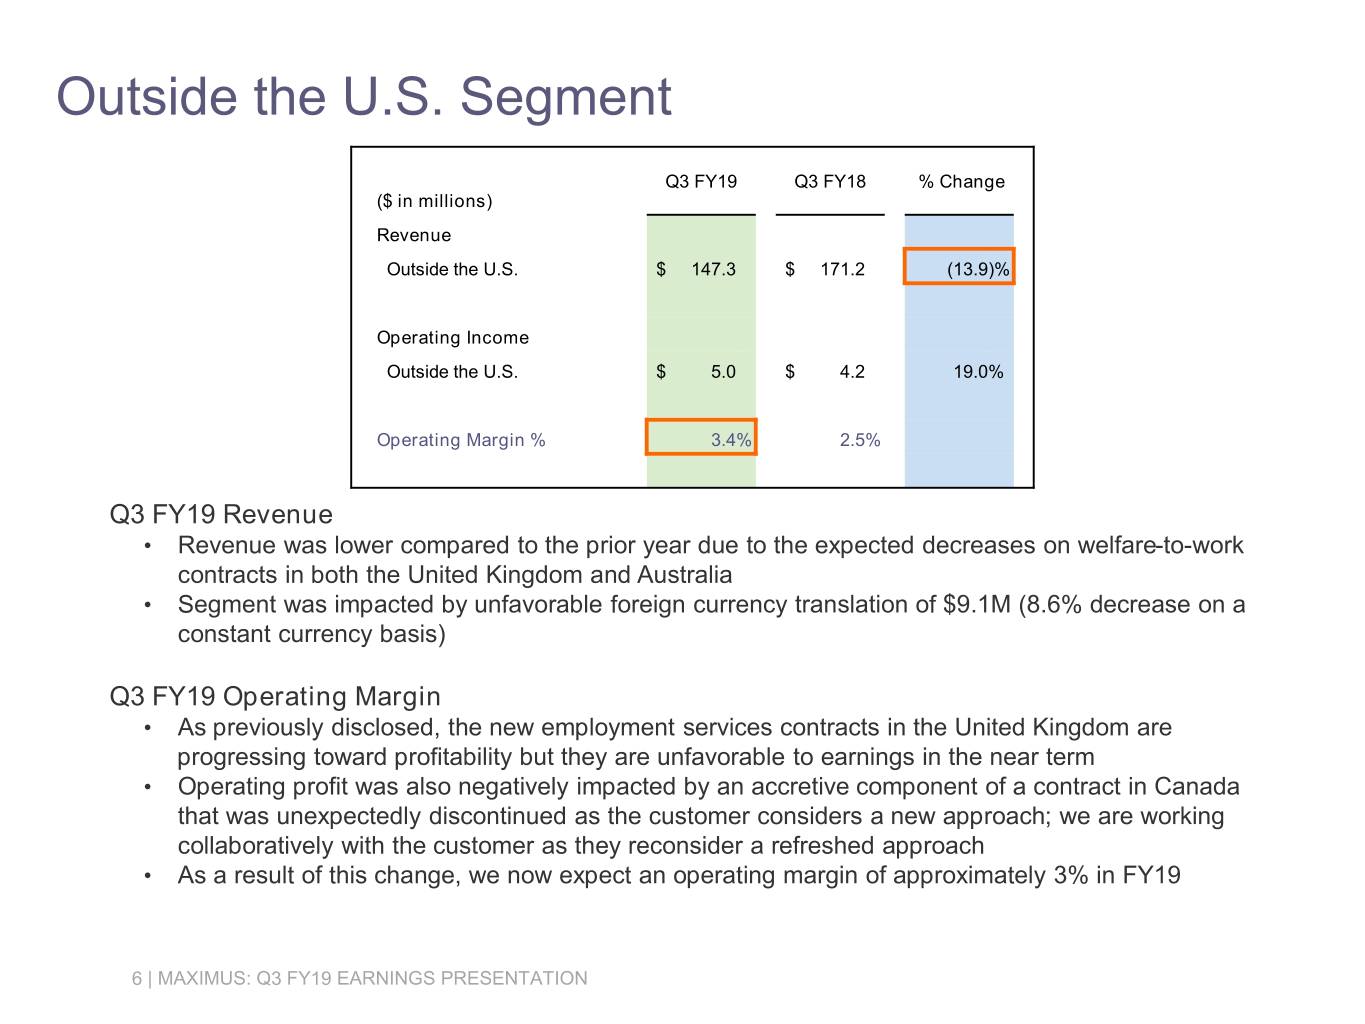
Outside the U.S. Segment Q3 FY19 Q3 FY18 % Change ($ in millions) Revenue Outside the U.S. $ 147.3 $ 171.2 (13.9)% Operating Income Outside the U.S. $ 5.0 $ 4.2 19.0% Operating Margin % 3.4% 2.5% Q3 FY19 Revenue • Revenue was lower compared to the prior year due to the expected decreases on welfare-to-work contracts in both the United Kingdom and Australia • Segment was impacted by unfavorable foreign currency translation of $9.1M (8.6% decrease on a constant currency basis) Q3 FY19 Operating Margin • As previously disclosed, the new employment services contracts in the United Kingdom are progressing toward profitability but they are unfavorable to earnings in the near term • Operating profit was also negatively impacted by an accretive component of a contract in Canada that was unexpectedly discontinued as the customer considers a new approach; we are working collaboratively with the customer as they reconsider a refreshed approach • As a result of this change, we now expect an operating margin of approximately 3% in FY19 6 | MAXIMUS: Q3 FY19 EARNINGS PRESENTATION
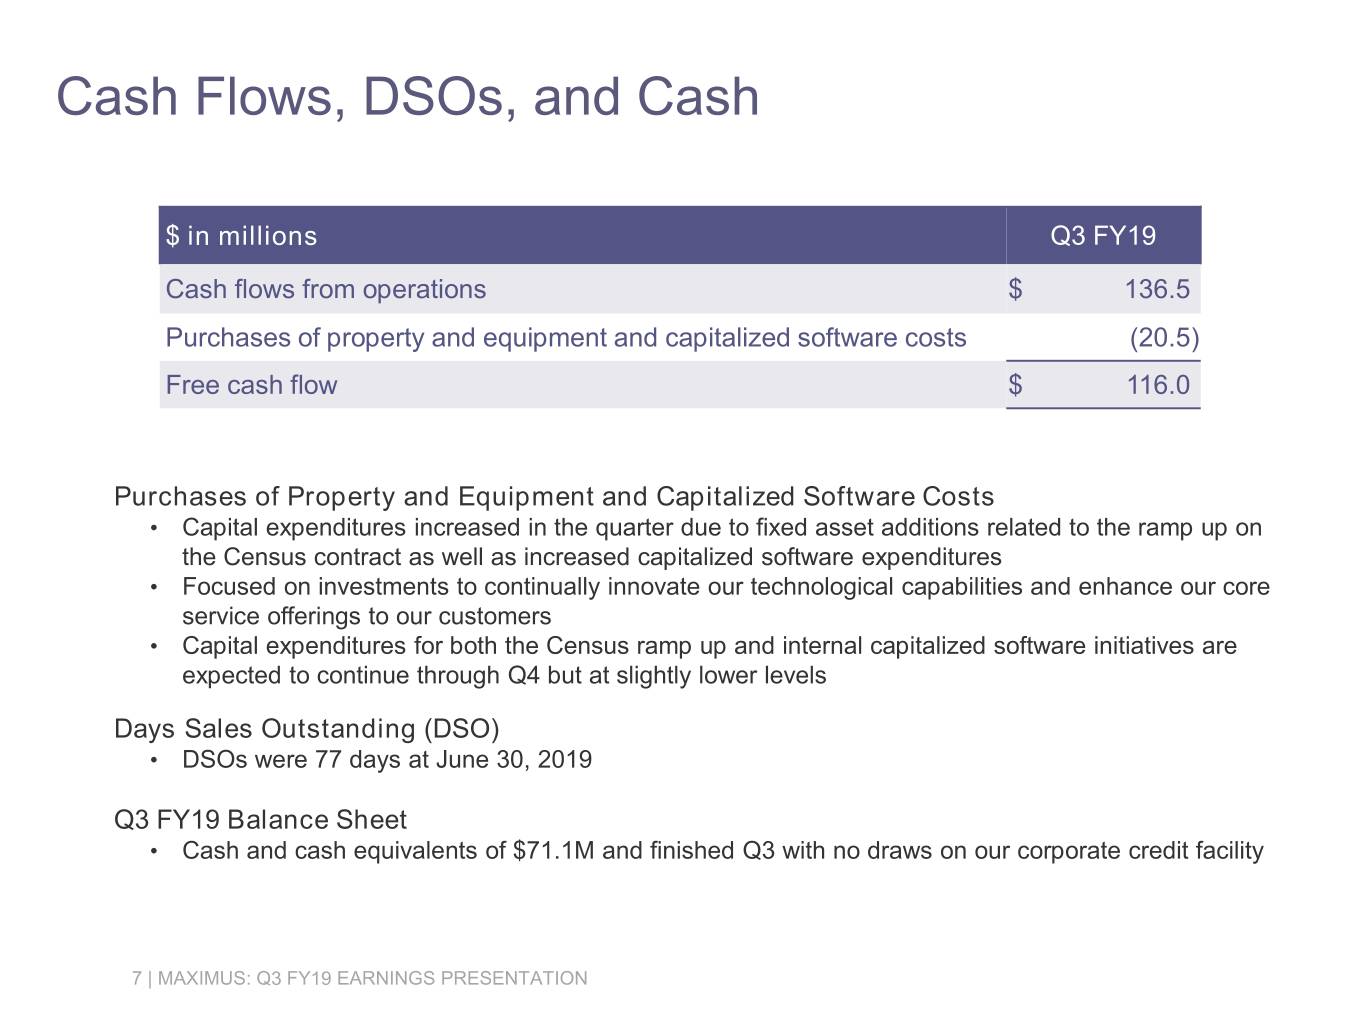
Cash Flows, DSOs, and Cash $ in millions Q3 FY19 Cash flows from operations $ 136.5 Purchases of property and equipment and capitalized software costs (20.5) Free cash flow $ 116.0 Purchases of Property and Equipment and Capitalized Software Costs • Capital expenditures increased in the quarter due to fixed asset additions related to the ramp up on the Census contract as well as increased capitalized software expenditures • Focused on investments to continually innovate our technological capabilities and enhance our core service offerings to our customers • Capital expenditures for both the Census ramp up and internal capitalized software initiatives are expected to continue through Q4 but at slightly lower levels Days Sales Outstanding (DSO) • DSOs were 77 days at June 30, 2019 Q3 FY19 Balance Sheet • Cash and cash equivalents of $71.1M and finished Q3 with no draws on our corporate credit facility 7 | MAXIMUS: Q3 FY19 EARNINGS PRESENTATION
Capital Allocation Capital Allocation • Over the years, we have remained committed to a sensible and disciplined approach to capital deployment • Approach is unchanged and we believe we can provide shareholders with reasonable returns while at the same time, generate sufficient capital to pursue strategic M&A to invest in and grow the business to create long-term shareholder value Near Term • As we move into FY20, we continue to seek out strategic opportunities in order to achieve some of the goals previously highlighted as part of our strategic market review • As a reminder, we are keenly interested in building scale, enhancing our clinical capabilities and extending into new adjacencies, with the goal in mind of building long term, sustainable, organic growth 8 | MAXIMUS: Q3 FY19 EARNINGS PRESENTATION
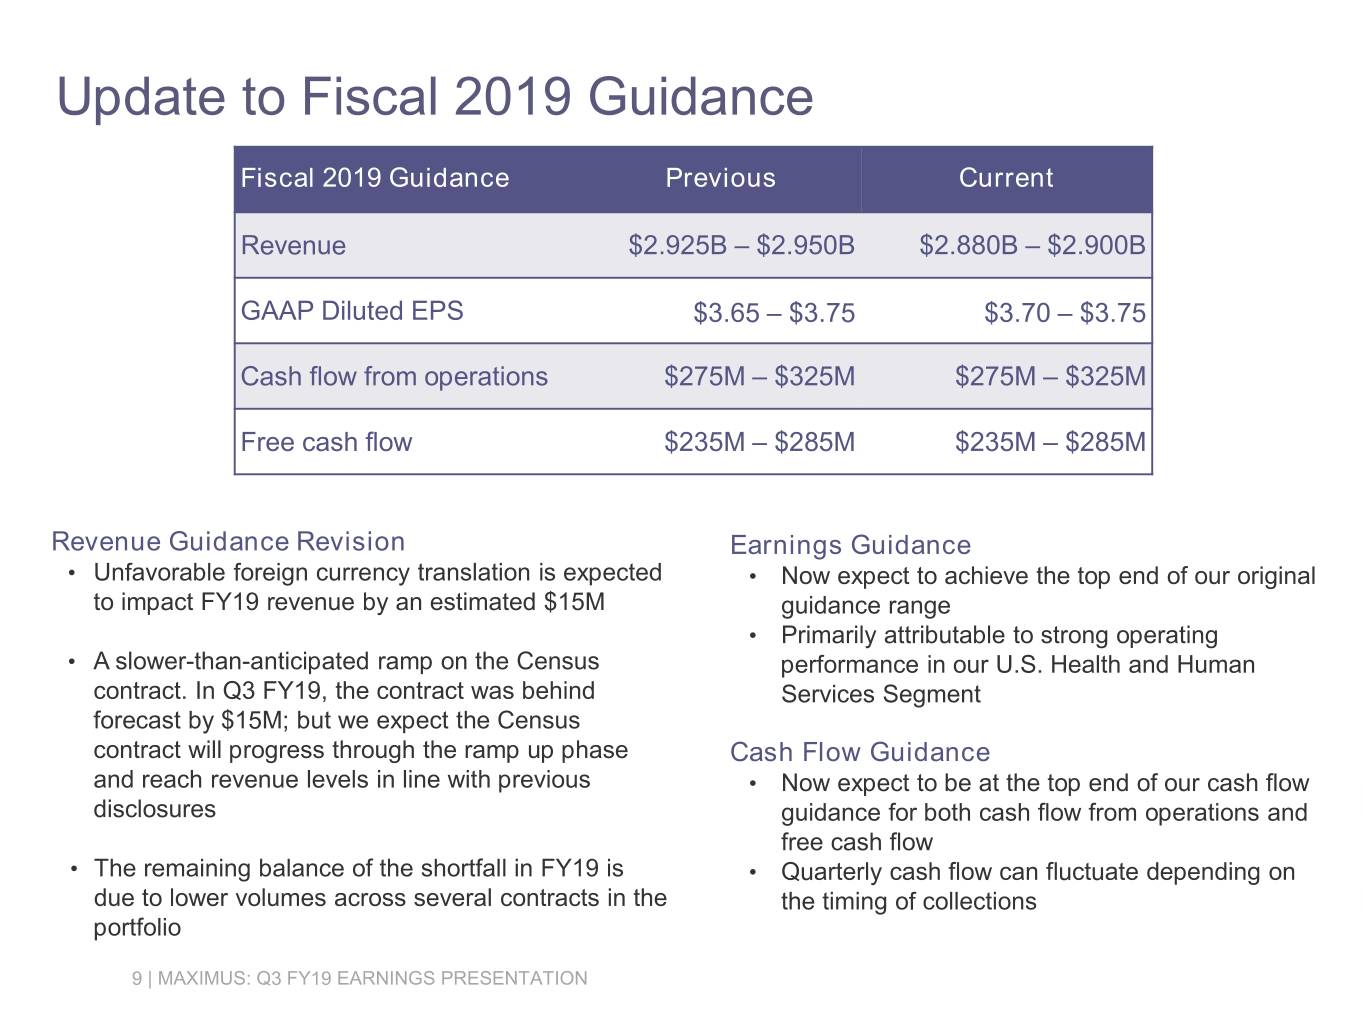
Update to Fiscal 2019 Guidance Fiscal 2019 Guidance Previous Current Revenue $2.925B – $2.950B $2.880B – $2.900B GAAP Diluted EPS $3.65 – $3.75 $3.70 – $3.75 Cash flow from operations $275M – $325M $275M – $325M Free cash flow $235M – $285M $235M – $285M Revenue Guidance Revision Earnings Guidance • Unfavorable foreign currency translation is expected • Now expect to achieve the top end of our original to impact FY19 revenue by an estimated $15M guidance range • Primarily attributable to strong operating • A slower-than-anticipated ramp on the Census performance in our U.S. Health and Human contract. In Q3 FY19, the contract was behind Services Segment forecast by $15M; but we expect the Census contract will progress through the ramp up phase Cash Flow Guidance and reach revenue levels in line with previous • Now expect to be at the top end of our cash flow disclosures guidance for both cash flow from operations and free cash flow • The remaining balance of the shortfall in FY19 is • Quarterly cash flow can fluctuate depending on due to lower volumes across several contracts in the the timing of collections portfolio 9 | MAXIMUS: Q3 FY19 EARNINGS PRESENTATION
Fiscal Year 2020 Progressing through our FY20 strategic planning process. As a part of the process, we make decisions internally regarding allocation of resources and areas of potential investments, with the goal of cultivating future shareholder value. Preliminary Financial View • Based on what we know today, our early view of FY20 is generally in-line with First Call consensus estimates for revenue of $3.18B and diluted EPS of $4.08 Considerations • MAXIMUS operates a large portfolio of contracts; nature of the business is puts and takes in the overall model • We complete a bottoms-up review, which is the basis for our forecasting model each quarter • Significant fluctuations to these model inputs can certainly impact actual financial results • We work hard to manage those things that are within our control and we have a strong risk mitigation strategy that, for the most part, allows us to modify certain terms and conditions in contracts – within reason • Effects of currency, or unforeseen changes to a contract, such as lower volumes or changing customer priorities can cause erosion that can have a meaningful impact – those would be the types of items that are largely outside of our control 10 | MAXIMUS: Q3 FY19 EARNINGS PRESENTATION

Fiscal 2019 Third Quarter Earnings Call Bruce Caswell President & Chief Executive Officer August 8, 2019
Three Key Pillars Offering Multiple Paths Forward Three Pillars Moving Forward 1. Digital Transformation, digital • Several new wins and a pipeline disruption within the government of developing opportunities in key services market and new models for markets citizen engagement and operational efficiencies • Making meaningful progress on 2. Clinical Evolution, as we see macro- strategic execution as we offer trends that drive demand for BPO integrated solutions across our services with a more clinical geographies dimension, we maintain the foundation of our business, operating • Must remain focused on winning customer engagement centers and work currently in our pipeline and providing case management services reducing the levels of erosion on our existing portfolio 3. Market Expansion, as we evaluate emerging markets, organically grow the portfolio and acquire capabilities and contracts to establish a foothold in these adjacent markets 12 | MAXIMUS: Q3 FY19 EARNINGS PRESENTATION
Technology Transformation • Executing a technology transformation as part of our overall digital strategy • Must transform the platforms on which our digital solutions are delivered and the methods we employ to securely develop and operate these new solutions • Shift to a microservices architecture platform and the modernization efforts underway as we enhance our technology capabilities • This will improve our competitiveness by modernizing the applications that underpin our core BPO services while creating a modular set of new capabilities that can be deployed across our portfolio • Can better organize our technology delivery around our business capabilities and more quickly respond to customer requirements 13 | MAXIMUS: Q3 FY19 EARNINGS PRESENTATION
Microservices Architecture • Allows a system to be divided into a number of smaller, individual and independent services: flexible, robust, interchangeable and complete • Our BPO services are extremely adaptable for use in multiple contexts • Key capability as our clients’ needs evolve and we work to drive organic growth in new adjacent markets • Services can be selected and assembled in various combinations to satisfy specific user requirements • Vastly increase the speed in which we tailor solutions and dramatically slash startup times to address clients’ unique needs with configurable versus customized delivery • Not only changing the technology, but also our processes and methodologies • Enables the entire ecosystems to be faster, more adaptable and more responsive through strong standardization • Model merges business and technology and provides a key component to successfully implement our strategic pillar of digital transformation • Supports growth into adjacencies more quickly, efficiently and effectively 14 | MAXIMUS: Q3 FY19 EARNINGS PRESENTATION
Market Expansion through Clinical Evolution California: Developed an adjacent solution to transform California’s approach to resolving disputes under workers’ compensation program • Created a cost-effective, non-judicial IMR to help control the cost of premiums charged to employers. New clinical IMR replaced the labor- intensive process that required opposing medical experts to present testimony to non-clinical judges who rendered decisions • The new model produced dramatic results: ̶ Savings of $1B in related workers’ comp medical costs annually ̶ 42% decline in its advisory pure premium rates since January 2015 ̶ Medical treatment disputes down to 10 days from an average of 231 ̶ Total amount paid for opioid prescriptions tied to workers comp claims has decreased 80% since 2013; IMR noted as key factor in decline New York: Success in CA, allowed us to advance solution to NY • Awarded five-year, performance-based $60M contract • MAXIMUS will perform IMR services for New York’s workers’ compensation program, similar to our work in California ̶ We are uniquely qualified to handle the highly variable volumes of IMR requests and new drug formulary requirements under this program 15 | MAXIMUS: Q3 FY19 EARNINGS PRESENTATION
U.S. Federal Services Segment Update • New, four-year, performance-based, $100M contract to perform Qualified Independent Contractor (QIC) appeals for Medicare Part B, Durable Medical Equipment (DME) ̶ Largest volume Medicare appeals contract and adds to our existing Medicare appeals portfolio of Part A West, Part C and Part D • Tapped to support the Department of Veterans Affairs’ Community Care Network (CCN) program as a subcontractor ̶ Part of this work falls under the MISSION Act which seeks to strengthen the nationwide VA Health Care System by empowering veterans with more healthcare options ̶ We will provide services that include MISSION Act information support, authorization and medical documentation entry, and veteran, provider and VA inquiry support regarding veterans’ access to local providers 16 | MAXIMUS: Q3 FY19 EARNINGS PRESENTATION
U.S. Health and Human Services Segment Update • Launching new five-year, $70M contract in Wisconsin called FoodShare Employment and Training (FSET) for the Division of Medicaid Services ̶ Program provides Able Bodied Adults without Dependents on the SNAP program, with opportunities to develop skills, training and experience so they can gain employment, avoid reliance on FoodShare benefits, and meet federally mandated work requirements ̶ MAXIMUS will provide tailored employment plans, case management services, business services, quality assurance, digital solutions, and finance and human resources fulfillment ̶ Leverage our decades-long history of providing a broad range of workforce services and previous FSET programing in Milwaukee County • MAXIMUS remains a prime partner for our clients to support long-term societal trends through efficient, effective and cost conscious BPO service offerings • Anticipate additional integrated approaches – for which MAXIMUS is well suited – as governments seek to address emerging policy priorities like the Social Determinants of Health 17 | MAXIMUS: Q3 FY19 EARNINGS PRESENTATION
Outside the U.S. Segment Update • In the U.K., awarded contracts in Manchester and London for the Adult Education Budget (AEB) • We will deliver a range of education and training services, such as helping individuals gain qualifications, progress their education, access and sustain employment opportunities as well as achieve career progression • These small but strategic wins jointly place MAXIMUS as one of the largest skills providers for the AEB program in the U.K. • Also places us on the ground floor of devolved skills delivery in two of the most significant markets in the country and builds upon our existing Work and Health Program infrastructure in London 18 | MAXIMUS: Q3 FY19 EARNINGS PRESENTATION
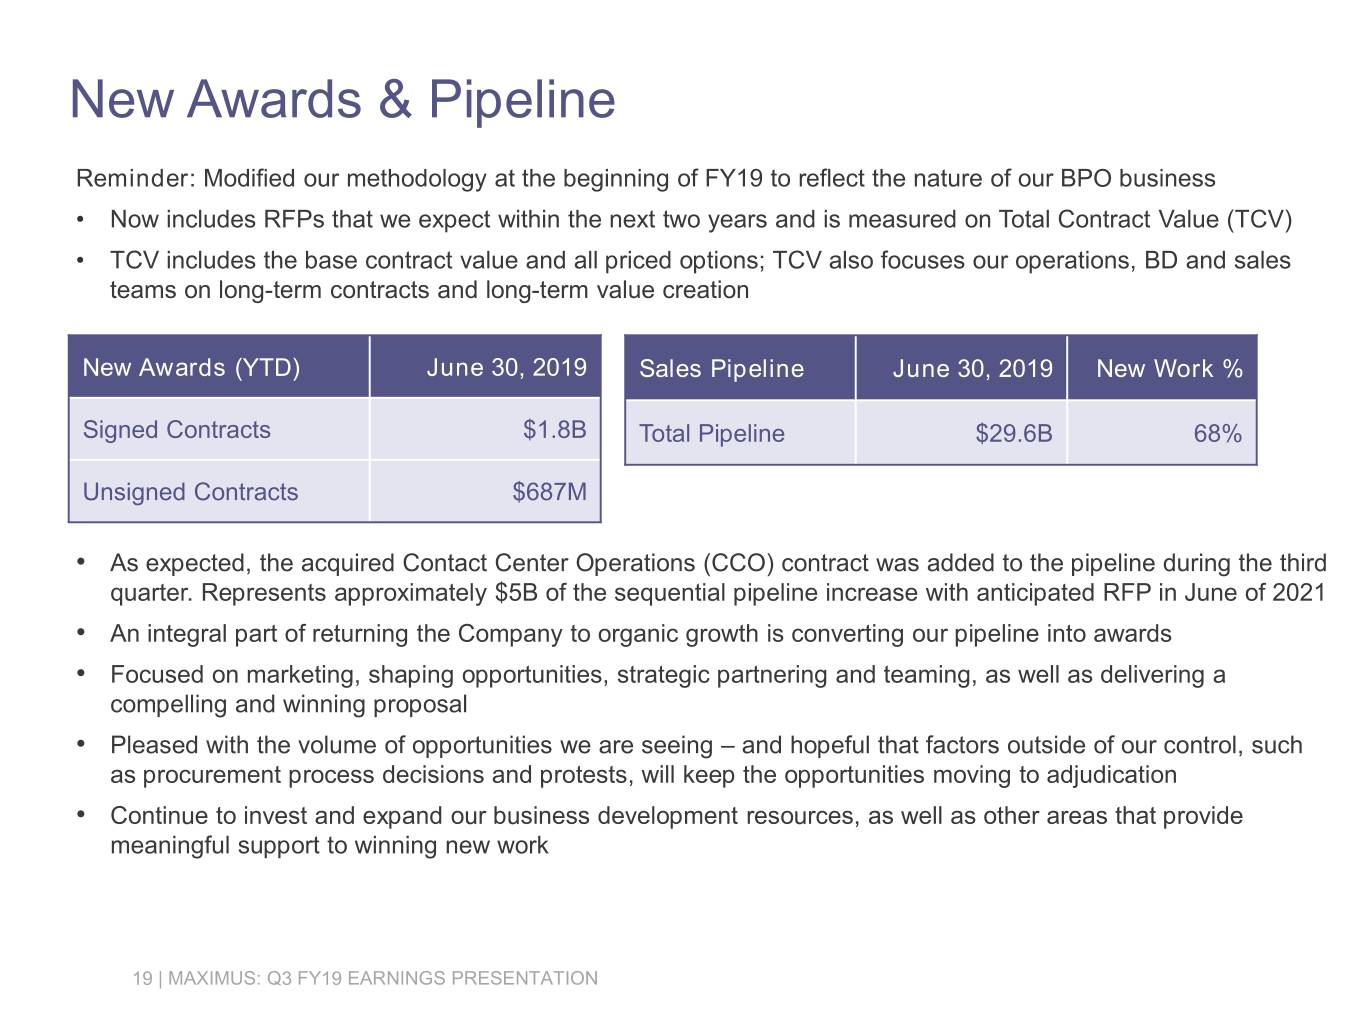
New Awards & Pipeline Reminder: Modified our methodology at the beginning of FY19 to reflect the nature of our BPO business • Now includes RFPs that we expect within the next two years and is measured on Total Contract Value (TCV) • TCV includes the base contract value and all priced options; TCV also focuses our operations, BD and sales teams on long-term contracts and long-term value creation New Awards (YTD) June 30, 2019 Sales Pipeline June 30, 2019 New Work % Signed Contracts $1.8B Total Pipeline $29.6B 68% Unsigned Contracts $687M • As expected, the acquired Contact Center Operations (CCO) contract was added to the pipeline during the third quarter. Represents approximately $5B of the sequential pipeline increase with anticipated RFP in June of 2021 • An integral part of returning the Company to organic growth is converting our pipeline into awards • Focused on marketing, shaping opportunities, strategic partnering and teaming, as well as delivering a compelling and winning proposal • Pleased with the volume of opportunities we are seeing – and hopeful that factors outside of our control, such as procurement process decisions and protests, will keep the opportunities moving to adjudication • Continue to invest and expand our business development resources, as well as other areas that provide meaningful support to winning new work 19 | MAXIMUS: Q3 FY19 EARNINGS PRESENTATION
Conclusion • Governments require much-needed support from organizations like MAXIMUS • We continue to evolve to meet the demands of our clients by offering effective and efficient services increasingly underpinned by digital solutions delivered through new technology platforms • Remain focused on executing our strategic market plan, as seen by our new wins and, importantly, our expansion into adjacencies • Building upon operational strength, providing clinical services to new customers, and enhancing our technology platform to enable new digital solutions • Winning new work and further developing our pipeline • We are an integral partner for our customers as they shape policy and subsequent program design to address long-term macro trends reflecting aging populations, labor skills and demand asymmetry, public health priorities, and the integration of historically siloed employment and health programs • Focused on delivering solid operational execution which, in turn, provides strong cash generation – best positioning us to respond to these emerging market opportunities 20 | MAXIMUS: Q3 FY19 EARNINGS PRESENTATION