
Fiscal 2019 Second Quarter Earnings Call Rick Nadeau Chief Financial Officer May 9, 2019 1 | MAXIMUS: Q2 FY19 EARNINGS PRESENTATION
Forward-looking Statements & Non-GAAP Information These slides should be read in conjunction with the Company’s most recent quarterly earnings press release, along with listening to or reading a transcript of the comments of Company management from our most recent quarterly earnings conference call. This document may contain non-GAAP financial information. Management uses this information in its internal analysis of results and believes that this information may be informative to investors in gauging the quality of our financial performance, identifying trends in our results, and providing meaningful period-to-period comparisons. These measures should be used in conjunction with, rather than instead of, their comparable GAAP measures. For a reconciliation of non-GAAP measures to the comparable GAAP measures presented in this document, see the Company’s most recent quarterly earnings press release. Throughout this presentation, numbers may not add due to rounding. A number of statements being made today will be forward-looking in nature. Such statements are only predictions and actual events or results may differ materially as a result of risks the Company faces, including those discussed in Exhibit 99.1 of our SEC filings. We encourage you to review the information contained in our earnings release and our most recent Forms 10-Q and 10-K filed with the SEC. The Company does not assume any obligation to revise or update these forward-looking statements to reflect subsequent events or circumstances, except as required by law. 2 | MAXIMUS: Q2 FY19 EARNINGS PRESENTATION
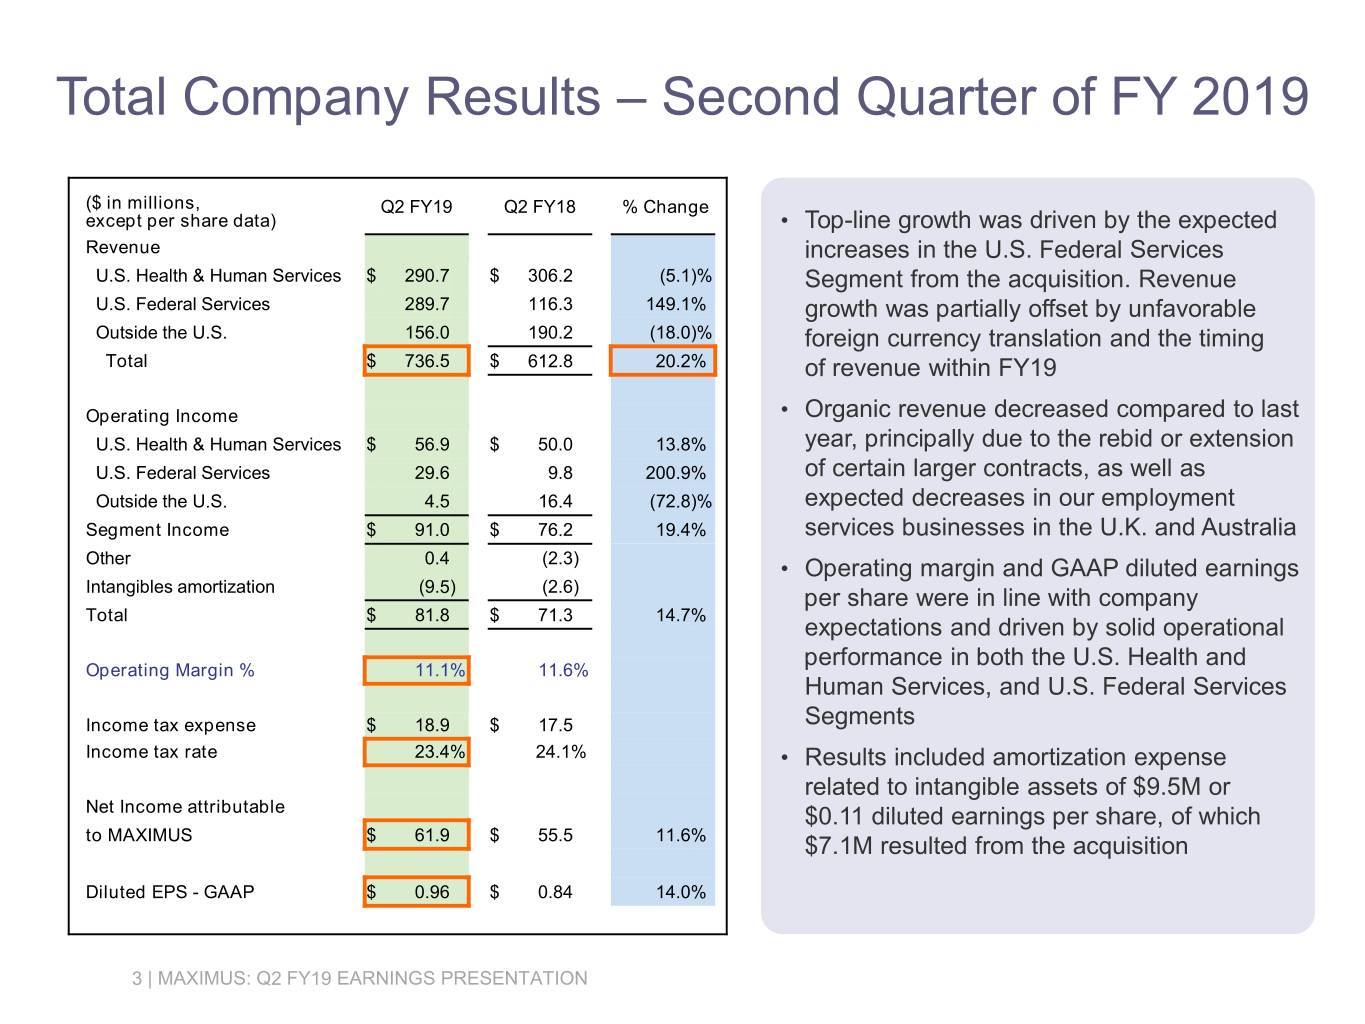
Total Company Results – Second Quarter of FY 2019 ($ in millions, Q2 FY19 Q2 FY18 % Change except per share data) • Top-line growth was driven by the expected Revenue increases in the U.S. Federal Services U.S. Health & Human Services $ 290.7 $ 306.2 (5.1)% Segment from the acquisition. Revenue U.S. Federal Services 289.7 116.3 149.1% growth was partially offset by unfavorable Outside the U.S. 156.0 190.2 (18.0)% foreign currency translation and the timing Total $ 736.5 $ 612.8 20.2% of revenue within FY19 Operating Income • Organic revenue decreased compared to last U.S. Health & Human Services $ 56.9 $ 50.0 13.8% year, principally due to the rebid or extension U.S. Federal Services 29.6 9.8 200.9% of certain larger contracts, as well as Outside the U.S. 4.5 16.4 (72.8)% expected decreases in our employment Segment Income $ 91.0 $ 76.2 19.4% services businesses in the U.K. and Australia Other 0.4 (2.3) • Operating margin and GAAP diluted earnings Intangibles amortization (9.5) (2.6) per share were in line with company Total $ 81.8 $ 71.3 14.7% expectations and driven by solid operational performance in both the U.S. Health and Operating Margin % 11.1% 11.6% Human Services, and U.S. Federal Services Income tax expense $ 18.9 $ 17.5 Segments Income tax rate 23.4% 24.1% • Results included amortization expense related to intangible assets of $9.5M or Net Income attributable $0.11 diluted earnings per share, of which to MAXIMUS $ 61.9 $ 55.5 11.6% $7.1M resulted from the acquisition Diluted EPS - GAAP $ 0.96 $ 0.84 14.0% 3 | MAXIMUS: Q2 FY19 EARNINGS PRESENTATION
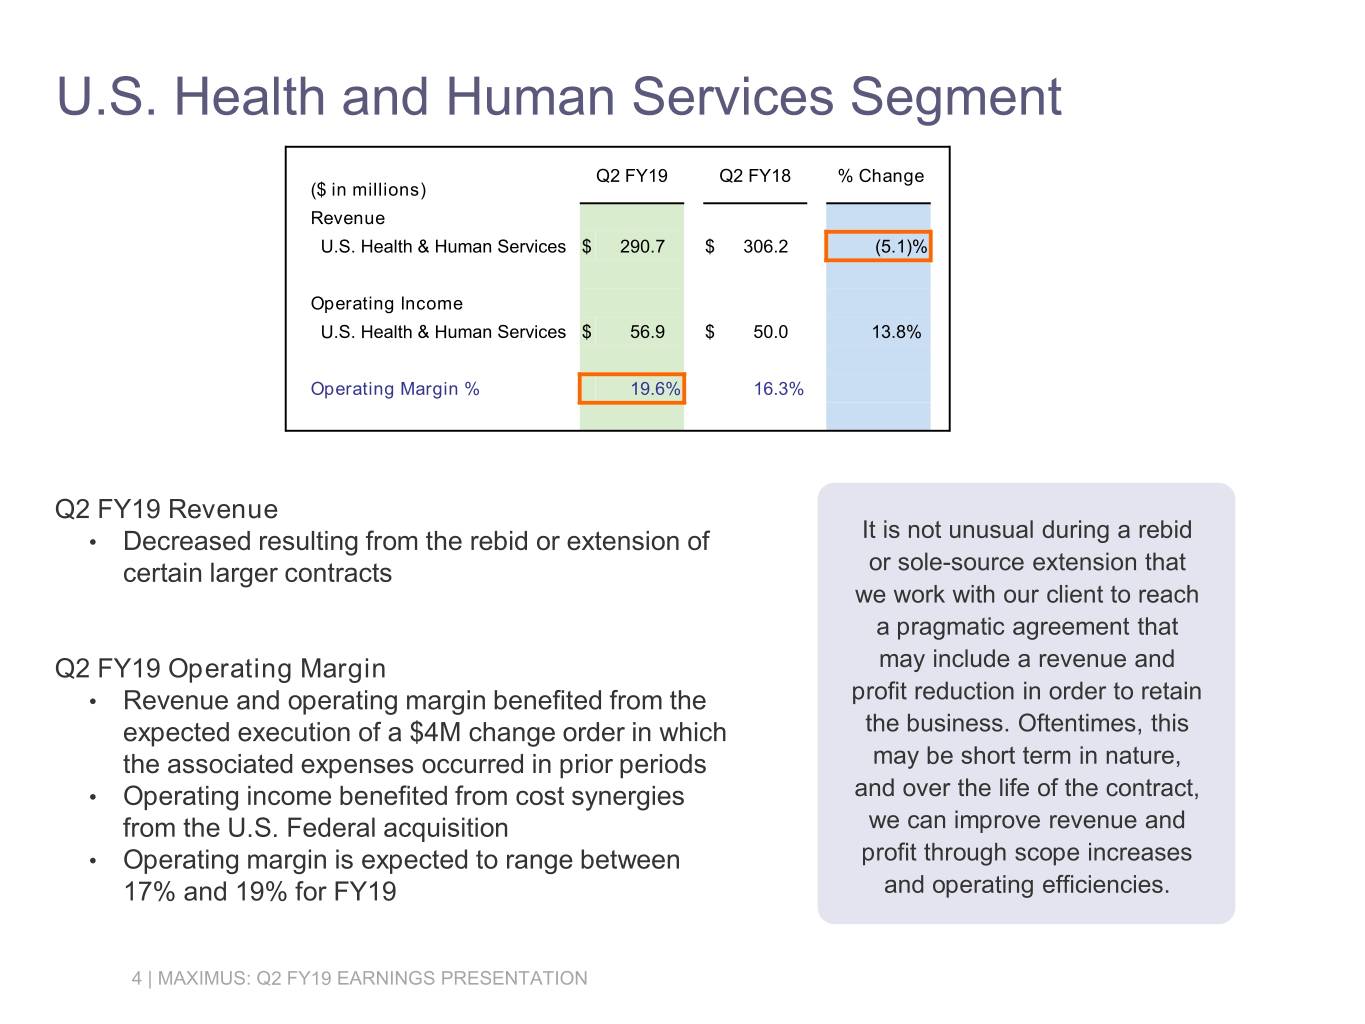
U.S. Health and Human Services Segment Q2 FY19 Q2 FY18 % Change ($ in millions) Revenue U.S. Health & Human Services $ 290.7 $ 306.2 (5.1)% Operating Income U.S. Health & Human Services $ 56.9 $ 50.0 13.8% Operating Margin % 19.6% 16.3% Q2 FY19 Revenue It is not unusual during a rebid • Decreased resulting from the rebid or extension of certain larger contracts or sole-source extension that we work with our client to reach a pragmatic agreement that Q2 FY19 Operating Margin may include a revenue and • Revenue and operating margin benefited from the profit reduction in order to retain expected execution of a $4M change order in which the business. Oftentimes, this the associated expenses occurred in prior periods may be short term in nature, • Operating income benefited from cost synergies and over the life of the contract, from the U.S. Federal acquisition we can improve revenue and • Operating margin is expected to range between profit through scope increases 17% and 19% for FY19 and operating efficiencies. 4 | MAXIMUS: Q2 FY19 EARNINGS PRESENTATION
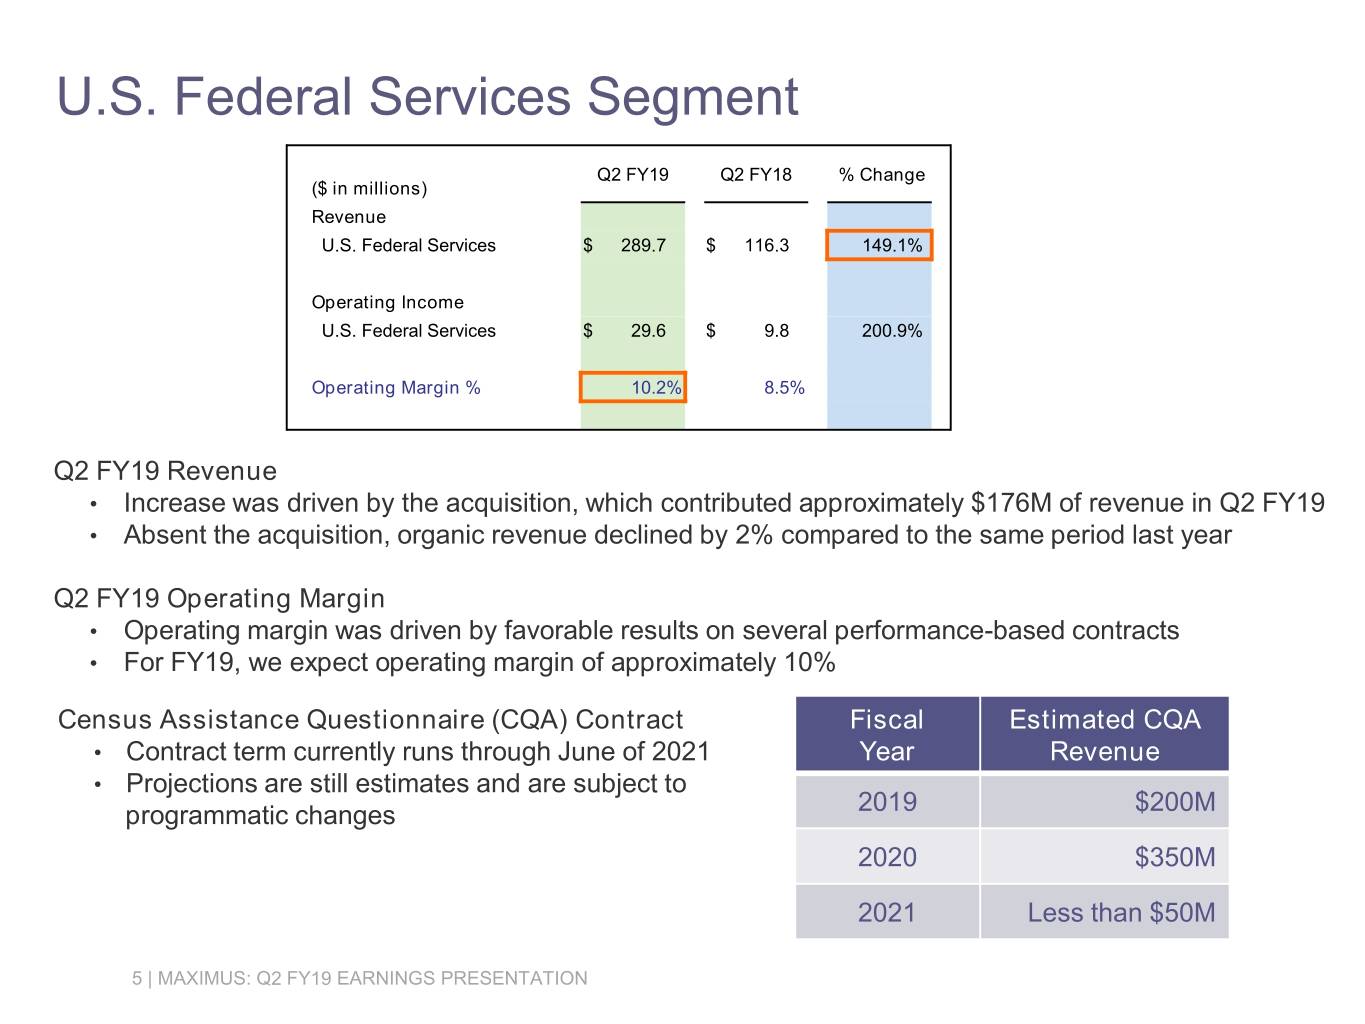
U.S. Federal Services Segment Q2 FY19 Q2 FY18 % Change ($ in millions) Revenue U.S. Federal Services $ 289.7 $ 116.3 149.1% Operating Income U.S. Federal Services $ 29.6 $ 9.8 200.9% Operating Margin % 10.2% 8.5% Q2 FY19 Revenue • Increase was driven by the acquisition, which contributed approximately $176M of revenue in Q2 FY19 • Absent the acquisition, organic revenue declined by 2% compared to the same period last year Q2 FY19 Operating Margin • Operating margin was driven by favorable results on several performance-based contracts • For FY19, we expect operating margin of approximately 10% Census Assistance Questionnaire (CQA) Contract Fiscal Estimated CQA • Contract term currently runs through June of 2021 Year Revenue • Projections are still estimates and are subject to programmatic changes 2019 $200M 2020 $350M 2021 Less than $50M 5 | MAXIMUS: Q2 FY19 EARNINGS PRESENTATION
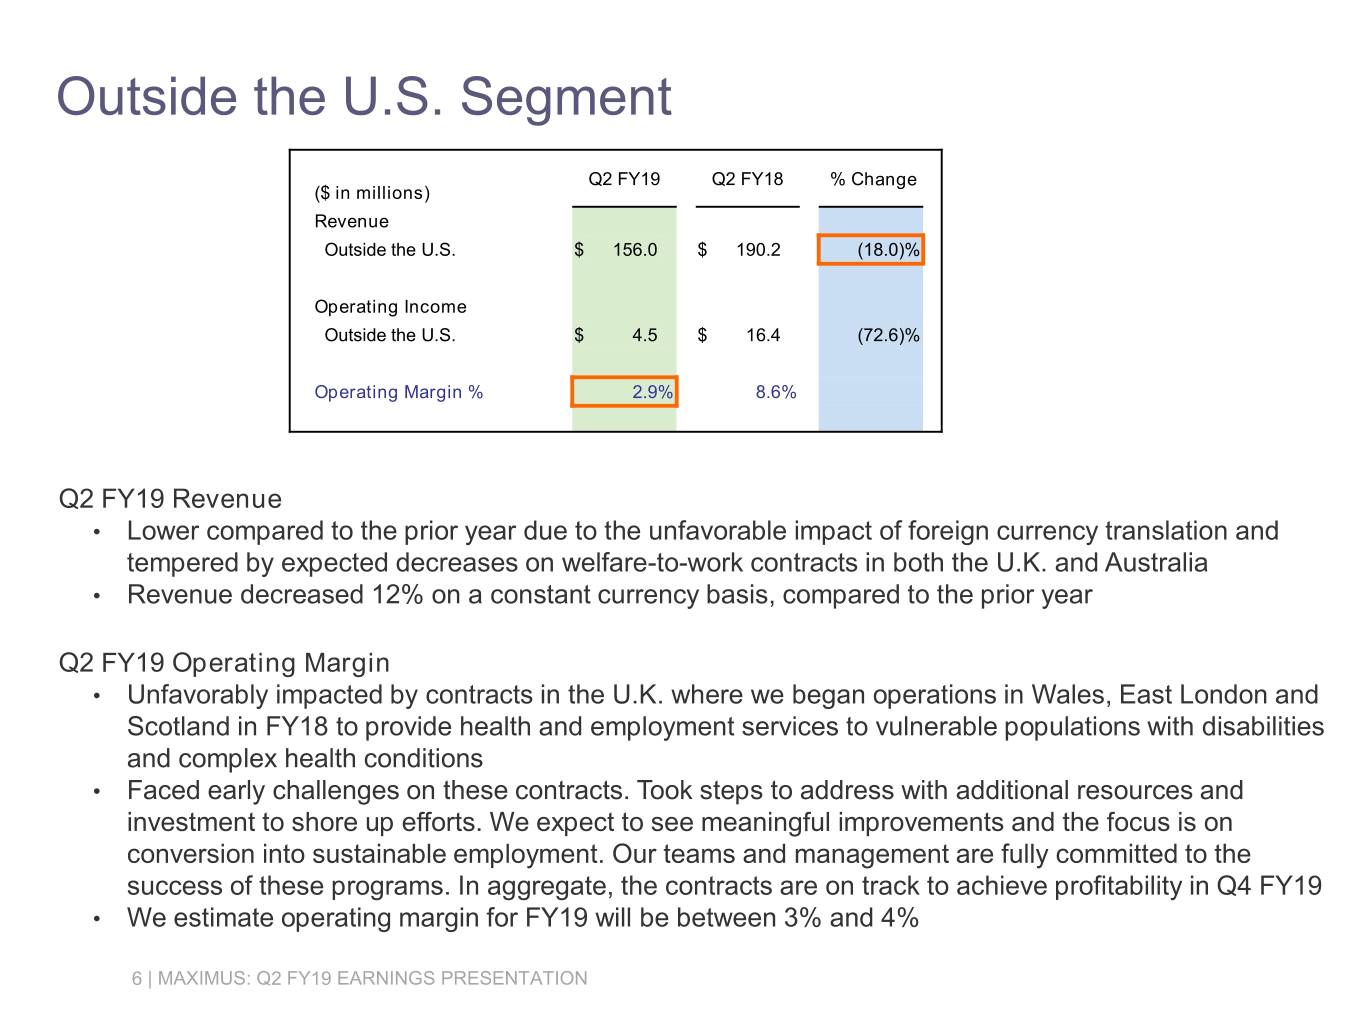
Outside the U.S. Segment Q2 FY19 Q2 FY18 % Change ($ in millions) Revenue Outside the U.S. $ 156.0 $ 190.2 (18.0)% Operating Income Outside the U.S. $ 4.5 $ 16.4 (72.6)% Operating Margin % 2.9% 8.6% Q2 FY19 Revenue • Lower compared to the prior year due to the unfavorable impact of foreign currency translation and tempered by expected decreases on welfare-to-work contracts in both the U.K. and Australia • Revenue decreased 12% on a constant currency basis, compared to the prior year Q2 FY19 Operating Margin • Unfavorably impacted by contracts in the U.K. where we began operations in Wales, East London and Scotland in FY18 to provide health and employment services to vulnerable populations with disabilities and complex health conditions • Faced early challenges on these contracts. Took steps to address with additional resources and investment to shore up efforts. We expect to see meaningful improvements and the focus is on conversion into sustainable employment. Our teams and management are fully committed to the success of these programs. In aggregate, the contracts are on track to achieve profitability in Q4 FY19 • We estimate operating margin for FY19 will be between 3% and 4% 6 | MAXIMUS: Q2 FY19 EARNINGS PRESENTATION
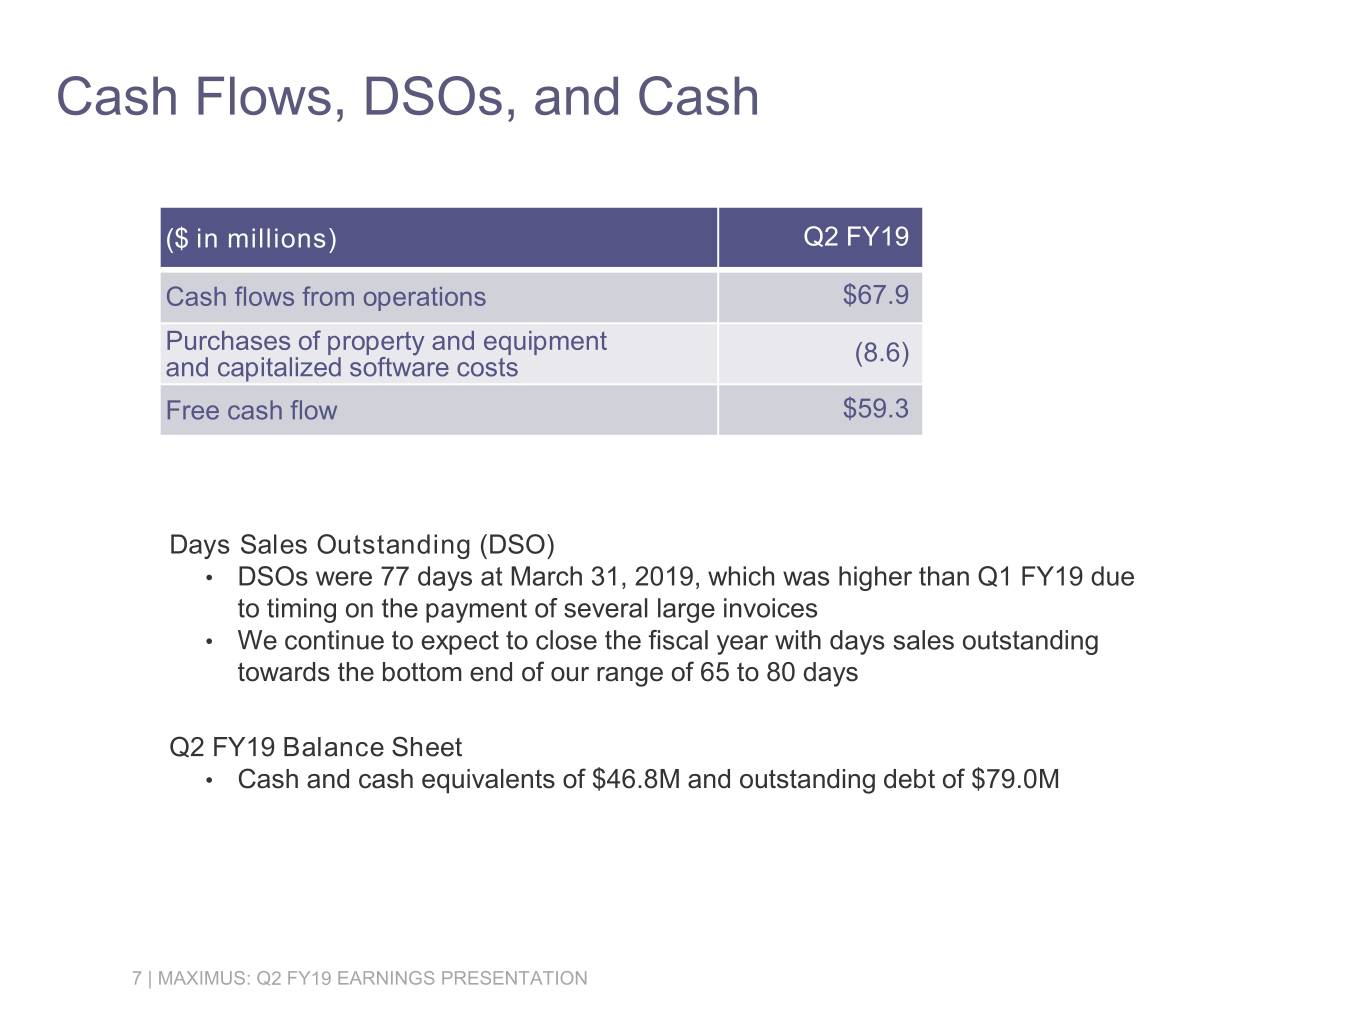
Cash Flows, DSOs, and Cash ($ in millions) Q2 FY19 Cash flows from operations $67.9 Purchases of property and equipment (8.6) and capitalized software costs Free cash flow $59.3 Days Sales Outstanding (DSO) • DSOs were 77 days at March 31, 2019, which was higher than Q1 FY19 due to timing on the payment of several large invoices • We continue to expect to close the fiscal year with days sales outstanding towards the bottom end of our range of 65 to 80 days Q2 FY19 Balance Sheet • Cash and cash equivalents of $46.8M and outstanding debt of $79.0M 7 | MAXIMUS: Q2 FY19 EARNINGS PRESENTATION
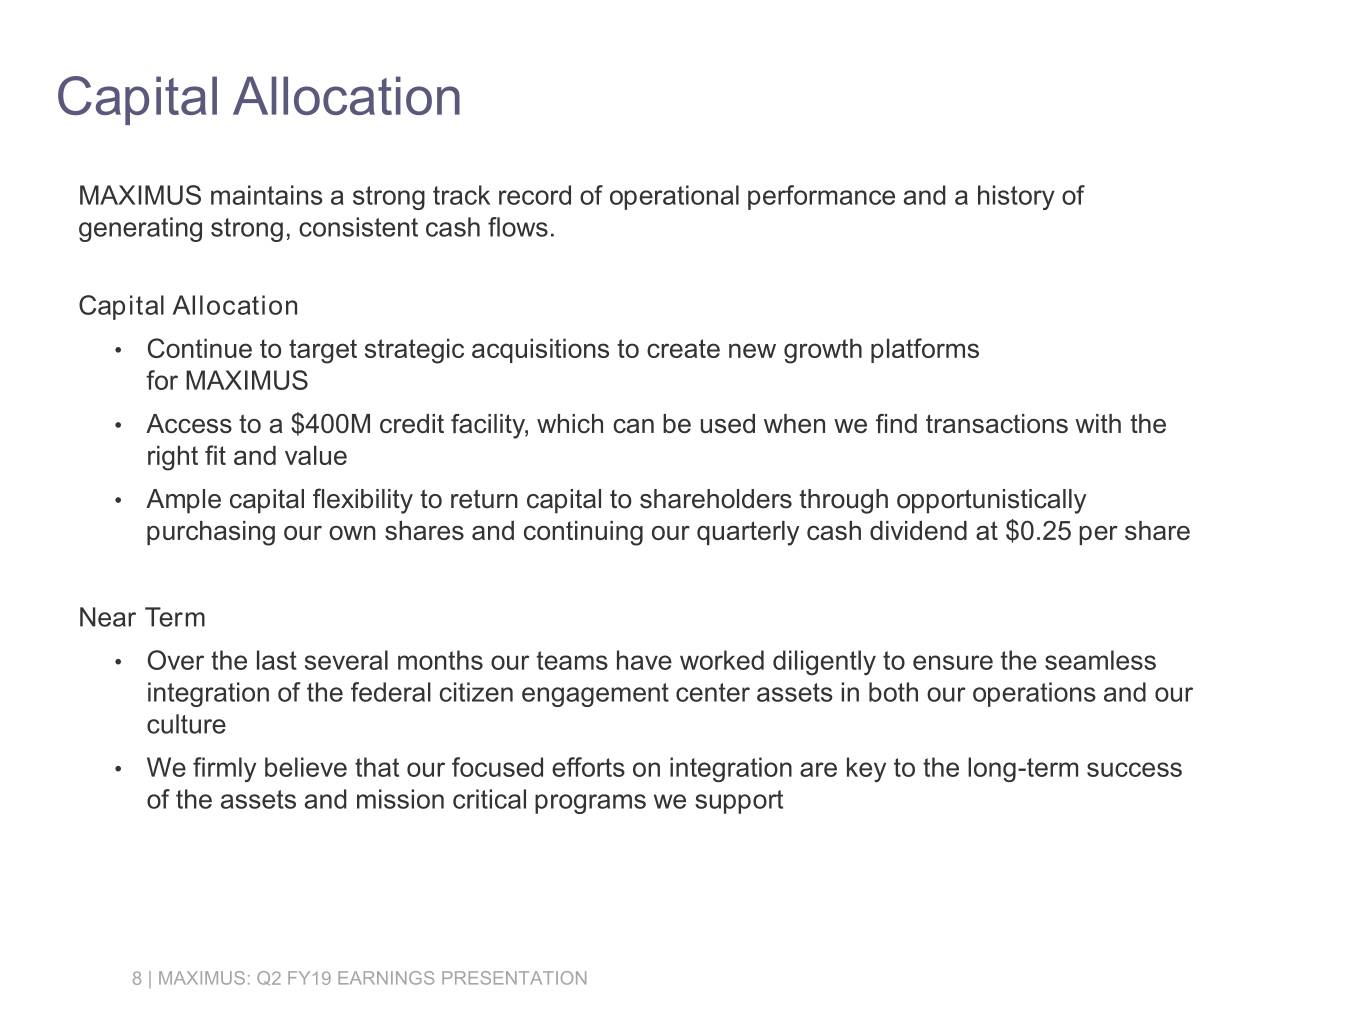
Capital Allocation MAXIMUS maintains a strong track record of operational performance and a history of generating strong, consistent cash flows. Capital Allocation • Continue to target strategic acquisitions to create new growth platforms for MAXIMUS • Access to a $400M credit facility, which can be used when we find transactions with the right fit and value • Ample capital flexibility to return capital to shareholders through opportunistically purchasing our own shares and continuing our quarterly cash dividend at $0.25 per share Near Term • Over the last several months our teams have worked diligently to ensure the seamless integration of the federal citizen engagement center assets in both our operations and our culture • We firmly believe that our focused efforts on integration are key to the long-term success of the assets and mission critical programs we support 8 | MAXIMUS: Q2 FY19 EARNINGS PRESENTATION
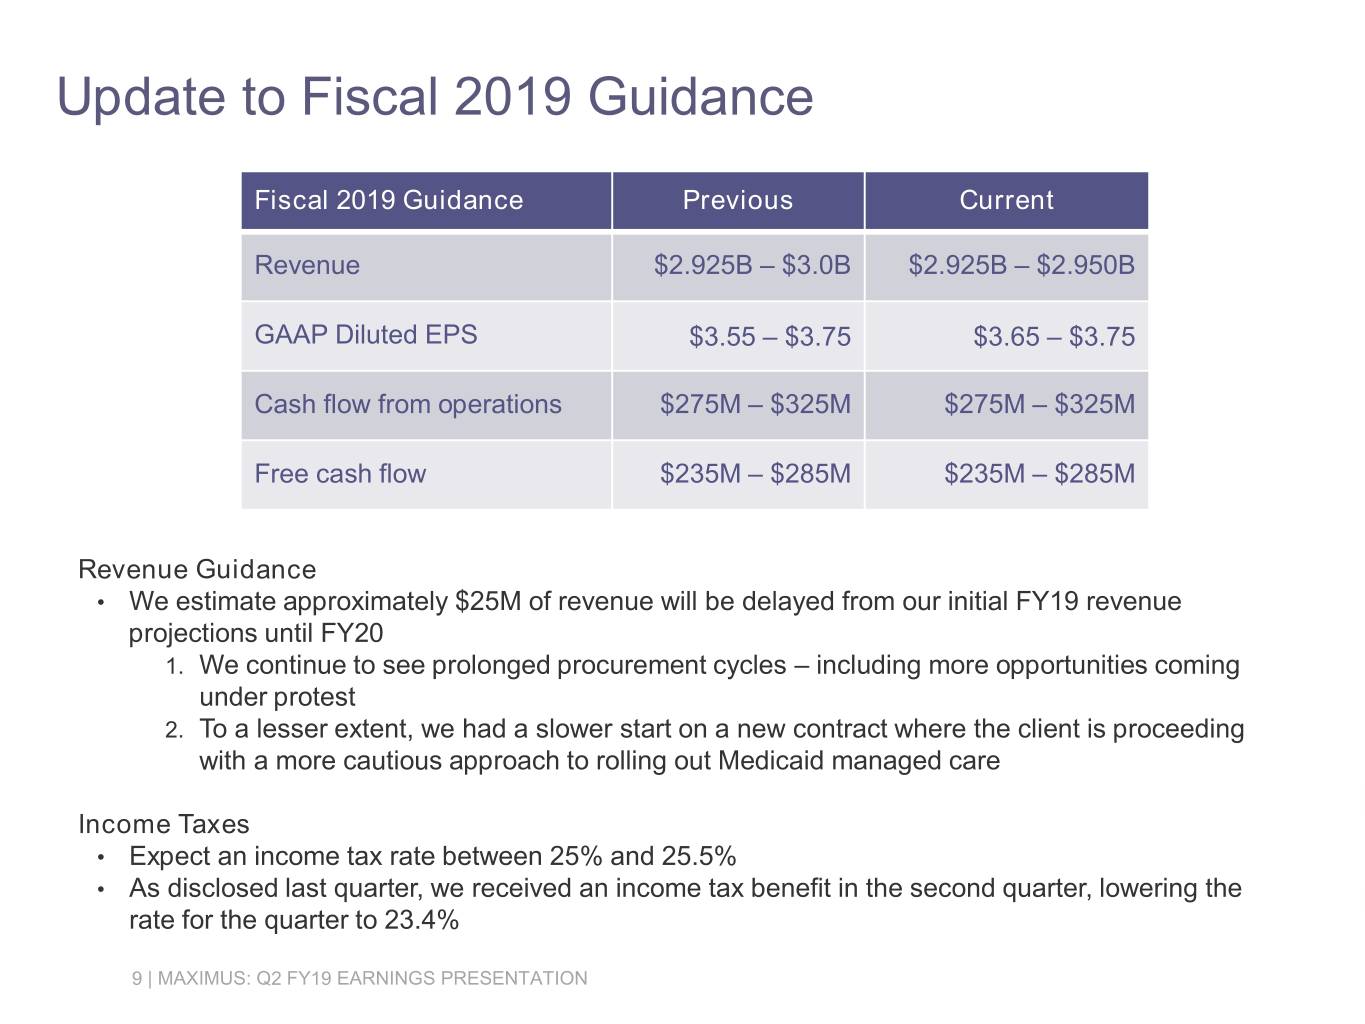
Update to Fiscal 2019 Guidance Fiscal 2019 Guidance Previous Current Revenue $2.925B – $3.0B $2.925B – $2.950B GAAP Diluted EPS $3.55 – $3.75 $3.65 – $3.75 Cash flow from operations $275M – $325M $275M – $325M Free cash flow $235M – $285M $235M – $285M Revenue Guidance • We estimate approximately $25M of revenue will be delayed from our initial FY19 revenue projections until FY20 1. We continue to see prolonged procurement cycles – including more opportunities coming under protest 2. To a lesser extent, we had a slower start on a new contract where the client is proceeding with a more cautious approach to rolling out Medicaid managed care Income Taxes • Expect an income tax rate between 25% and 25.5% • As disclosed last quarter, we received an income tax benefit in the second quarter, lowering the rate for the quarter to 23.4% 9 | MAXIMUS: Q2 FY19 EARNINGS PRESENTATION

Fiscal 2019 Second Quarter Earnings Call Bruce Caswell President & Chief Executive Officer May 9, 2019
Successful First Year Review • Unparalleled commitment to operational excellence, solid execution and generating robust cash flow • Focused on delivering added value to our clients by driving digital solutions and innovation to improve the customer journey and overall program efficiency • Executing three-pronged strategy to drive the next phase of our growth through: ̶ Digital transformation ̶ Clinical evolution ̶ Market expansion • Over the last year, we: ̶ Welcomed more than 14,000 employees through our acquisition last fall ̶ Implemented new technology and digital solutions that streamline program operations and improve the user experience ̶ Welcomed new leadership to our Board of Directors aimed at adding experience, expertise and skills that complement our existing board as part of our planned succession 11 | MAXIMUS: Q2 FY19 EARNINGS PRESENTATION

New Board Member • Michael J. Warren was appointed to our Board of Directors, effective March 25, 2019 • Serves as Managing Director of Albright Stonebridge Group, a global business strategy and commercial diplomacy firm • Expertise in advising clients on international growth strategies, stakeholder management and economic and geopolitical issues affecting global markets is a valuable addition to our board 12 | MAXIMUS: Q2 FY19 EARNINGS PRESENTATION
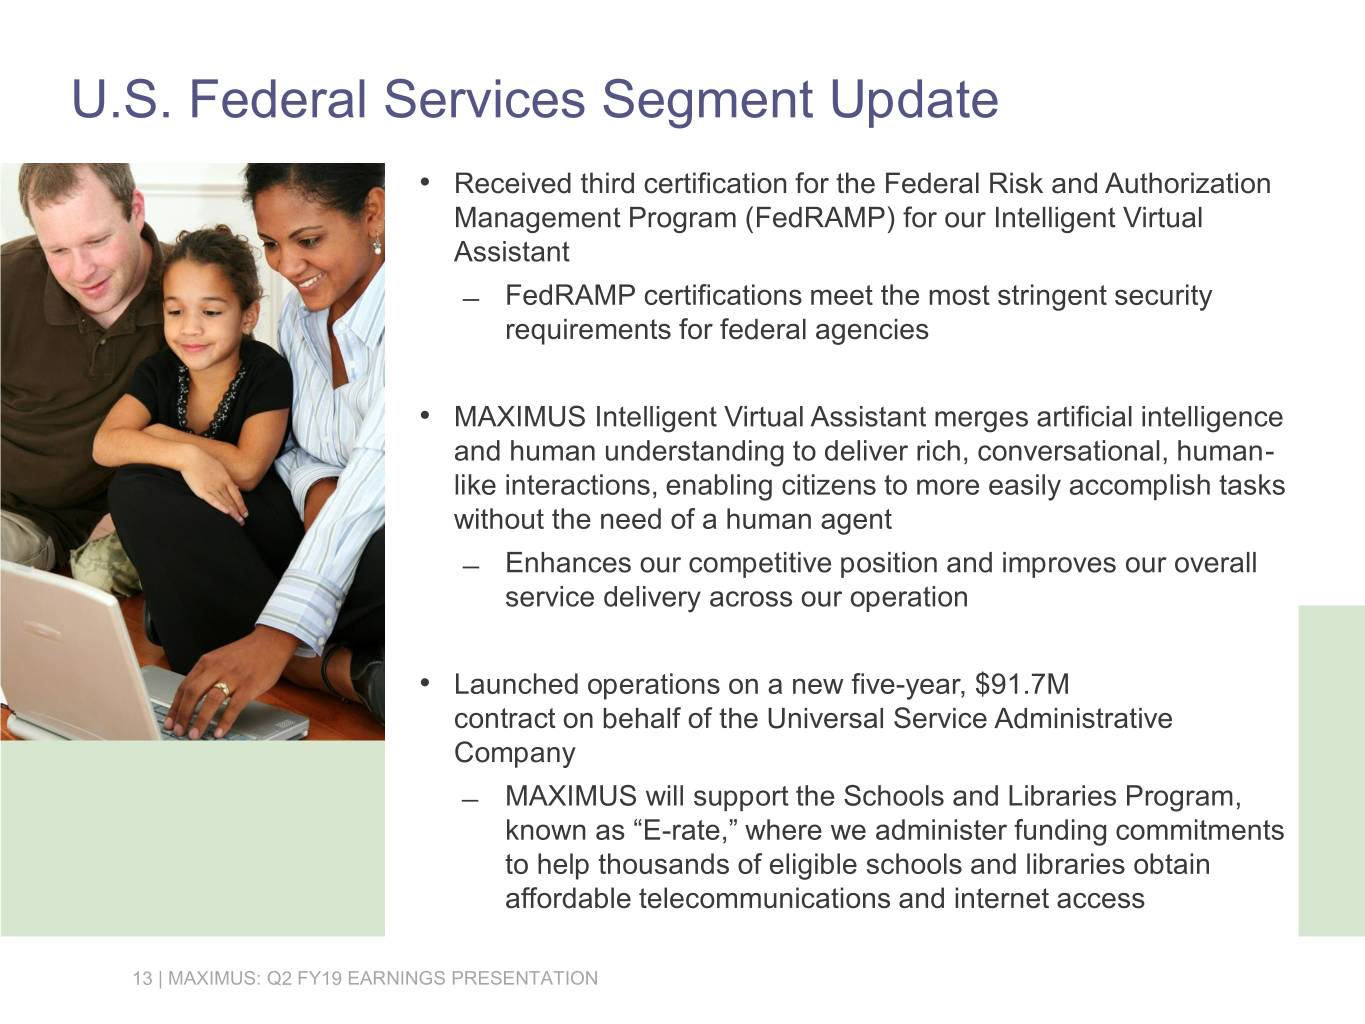
U.S. Federal Services Segment Update • Received third certification for the Federal Risk and Authorization Management Program (FedRAMP) for our Intelligent Virtual Assistant ̶ FedRAMP certifications meet the most stringent security requirements for federal agencies • MAXIMUS Intelligent Virtual Assistant merges artificial intelligence and human understanding to deliver rich, conversational, human- like interactions, enabling citizens to more easily accomplish tasks without the need of a human agent ̶ Enhances our competitive position and improves our overall service delivery across our operation • Launched operations on a new five-year, $91.7M contract on behalf of the Universal Service Administrative Company ̶ MAXIMUS will support the Schools and Libraries Program, known as “E-rate,” where we administer funding commitments to help thousands of eligible schools and libraries obtain affordable telecommunications and internet access 13 | MAXIMUS: Q2 FY19 EARNINGS PRESENTATION
U.S. Health and Human Services Segment Update Convergence of health and human services programs dovetail with our growth strategy for adjacent markets • Delivering a social determinant pilot in West Virginia that builds upon the work we already do in 12 Medicaid programs where we carry out health risk assessments. These provide an accurate picture of a participant’s health to help health plans determine care needs and management • Under the WV pilot, developed a holistic set of social risk questions to be seamlessly administered as part of the Medicaid enrollment process ̶ Insights help identify gaps in support showing where needs exist and types of support needed ̶ Survey had a 65% response rate, uptake across all channels and identified 14,000+ needs • What is the data telling us? ̶ Geocoding and mapping the results identifies gaps in support. These predictive analytics allow social services agencies to engage with beneficiaries and build trust before a healthcare claim is generated ̶ Having these needs identified and reported prior to enrollment in a managed care plan, MAXIMUS can support individuals by offering pathways to address their needs, generate measureable outcomes and create a data set that provides visibility into social health trends ̶ Most importantly, it also enables us to improve health outcomes and quality of care for these populations by building curated and accountable networks of community and health partners to coordinate social services and reduce demand on health systems ̶ If approved, Phase 2 scope will include extending a technical platform to the curated CBO* community to foster custody of referrals and warm handoffs *CBO = Community Based Organizations 14 | MAXIMUS: Q2 FY19 EARNINGS PRESENTATION
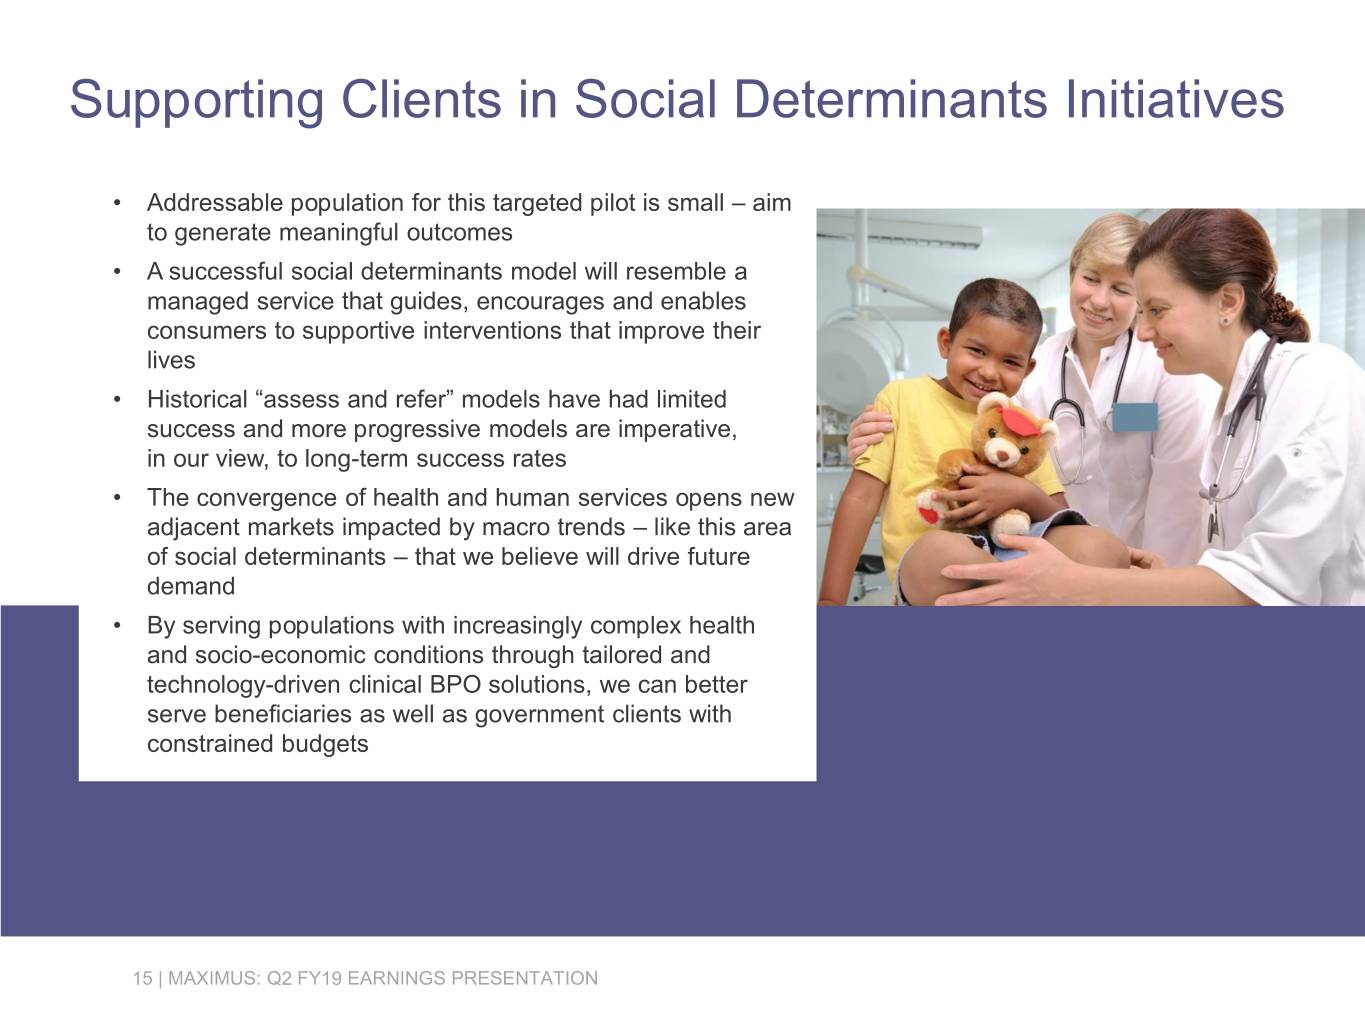
Supporting Clients in Social Determinants Initiatives • Addressable population for this targeted pilot is small – aim to generate meaningful outcomes • A successful social determinants model will resemble a managed service that guides, encourages and enables consumers to supportive interventions that improve their lives • Historical “assess and refer” models have had limited success and more progressive models are imperative, in our view, to long-term success rates • The convergence of health and human services opens new adjacent markets impacted by macro trends – like this area of social determinants – that we believe will drive future demand • By serving populations with increasingly complex health and socio-economic conditions through tailored and technology-driven clinical BPO solutions, we can better serve beneficiaries as well as government clients with constrained budgets 15 | MAXIMUS: Q2 FY19 EARNINGS PRESENTATION
Outside the U.S. Segment Update • In the U.K., the Department for Work and Pensions (DWP) has announced their intention to extend our contract to continue the Health Assessment Advisory Service through June 2021 • Part of a larger project that the government is undertaking to transform the delivery of all assessment services • Transitioning the currently separate assessment services into one unified integrated service in 2021 • As a reminder, these assessment services include: ̶ Work Capability Assessment (WCA) for Employment and Support Allowance and Universal Credit, which MAXIMUS delivers ̶ Personal Independence Payment (PIP) assessment services which is currently delivered by other vendors • This change offers MAXIMUS additional opportunity to support the newly integrated service. With our strong deliver and proven contract performance, we are well positioned to bid this work 16 | MAXIMUS: Q2 FY19 EARNINGS PRESENTATION
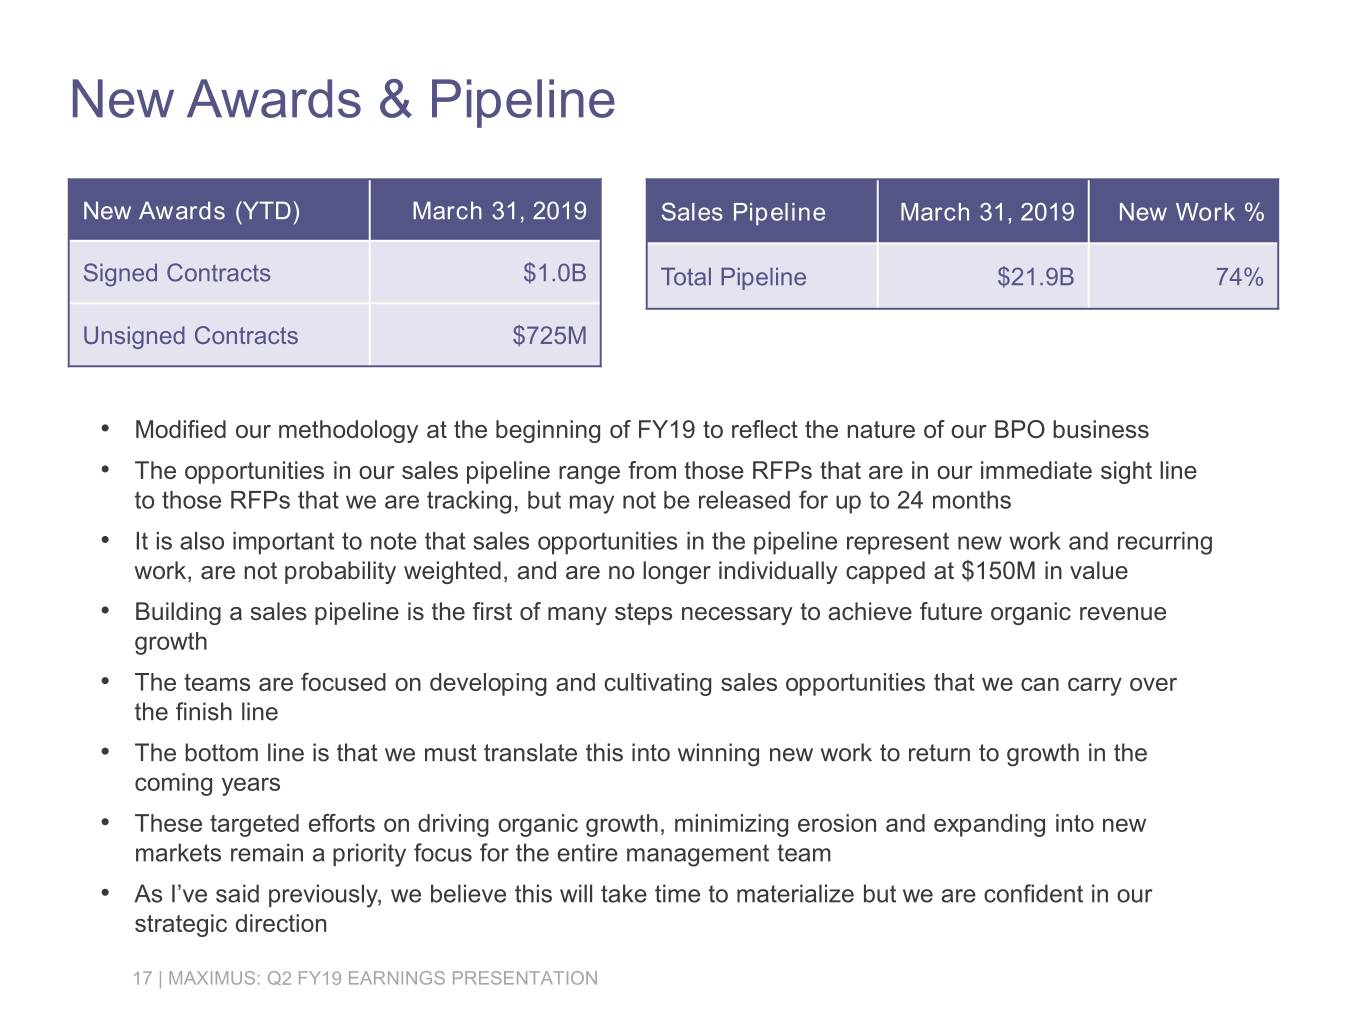
New Awards & Pipeline New Awards (YTD) March 31, 2019 Sales Pipeline March 31, 2019 New Work % Signed Contracts $1.0B Total Pipeline $21.9B 74% Unsigned Contracts $725M • Modified our methodology at the beginning of FY19 to reflect the nature of our BPO business • The opportunities in our sales pipeline range from those RFPs that are in our immediate sight line to those RFPs that we are tracking, but may not be released for up to 24 months • It is also important to note that sales opportunities in the pipeline represent new work and recurring work, are not probability weighted, and are no longer individually capped at $150M in value • Building a sales pipeline is the first of many steps necessary to achieve future organic revenue growth • The teams are focused on developing and cultivating sales opportunities that we can carry over the finish line • The bottom line is that we must translate this into winning new work to return to growth in the coming years • These targeted efforts on driving organic growth, minimizing erosion and expanding into new markets remain a priority focus for the entire management team • As I’ve said previously, we believe this will take time to materialize but we are confident in our strategic direction 17 | MAXIMUS: Q2 FY19 EARNINGS PRESENTATION
Conclusion • Favorable long term macro environment • Remain focused on our top priorities of digital transformation, expansion of our clinical offerings and strategic market expansion • Digital automation, such as next generation interactive voice recognition and process automation, allows us to continue to drive efficiencies, improve the quality of our operations, and differentiate the customer journey • Efforts are global in scope, enhance our competitive position, and improve service delivery across our operations • We see macro-trends such as life expectancy, healthcare costs, and population health challenges related to non-communicable disease conditions, which drive demand for BPO services with more of a clinical dimension • Continue to consider our clients’ long-term visions to reengineer their social programs and delivery mechanisms, making sure we are in the right markets with the right solutions at the right time • Previously began a comprehensive strategic market assessment that yielded a set of priority new growth markets • We continue to make progress in executing this plan, with deeper analysis, target identification and an active M&A function at the corporate level 18 | MAXIMUS: Q2 FY19 EARNINGS PRESENTATION