
Fiscal 2019 First Quarter Earnings Call Rick Nadeau Chief Financial Officer February 7, 2019
Forward-looking Statements & Non-GAAP Information These slides should be read in conjunction with the Company’s most recent quarterly earnings press release, along with listening to or reading a transcript of the comments of Company management from our most recent quarterly earnings conference call. This document may contain non-GAAP financial information. Management uses this information in its internal analysis of results and believes that this information may be informative to investors in gauging the quality of our financial performance, identifying trends in our results, and providing meaningful period-to-period comparisons. These measures should be used in conjunction with, rather than instead of, their comparable GAAP measures. For a reconciliation of non-GAAP measures to the comparable GAAP measures presented in this document, see the Company’s most recent quarterly earnings press release. Throughout this presentation, numbers may not add due to rounding. A number of statements being made today will be forward-looking in nature. Such statements are only predictions and actual events or results may differ materially as a result of risks the Company faces, including those discussed in Exhibit 99.1 of our SEC filings. We encourage you to review the information contained in our earnings release and our most recent Forms 10-Q and 10-K filed with the SEC. The Company does not assume any obligation to revise or update these forward-looking statements to reflect subsequent events or circumstances, except as required by law. 2 | MAXIMUS: Q1 FY19 EARNINGS PRESENTATION
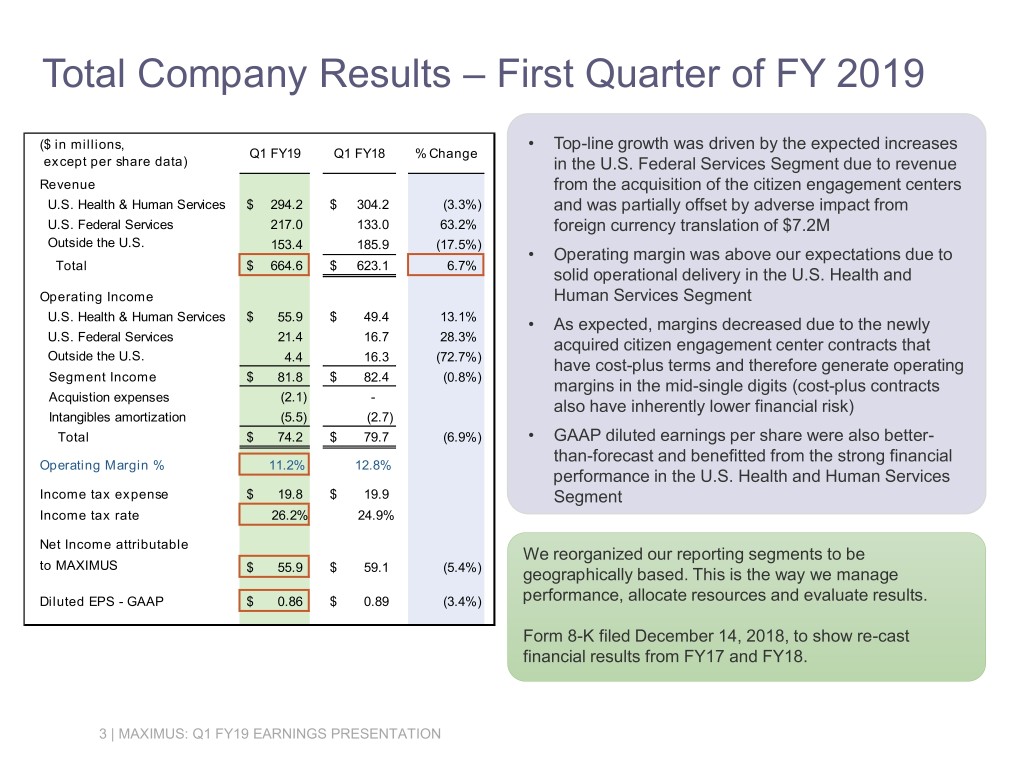
Total Company Results – First Quarter of FY 2019 ($ in millions, • Top-line growth was driven by the expected increases Q1 FY19 Q1 FY18 % Change except per share data) in the U.S. Federal Services Segment due to revenue Revenue from the acquisition of the citizen engagement centers U.S. Health & Human Services $ 294.2 $ 304.2 (3.3%) and was partially offset by adverse impact from U.S. Federal Services 217.0 133.0 63.2% foreign currency translation of $7.2M Outside the U.S. 153.4 185.9 (17.5%) • Operating margin was above our expectations due to Total $ 664.6 $ 623.1 6.7% solid operational delivery in the U.S. Health and Operating Income Human Services Segment U.S. Health & Human Services $ 55.9 $ 49.4 13.1% • As expected, margins decreased due to the newly U.S. Federal Services 21.4 16.7 28.3% acquired citizen engagement center contracts that Outside the U.S. 4.4 16.3 (72.7%) have cost-plus terms and therefore generate operating Segment Income $ 81.8 $ 82.4 (0.8%) margins in the mid-single digits (cost-plus contracts Acquistion expenses (2.1) - also have inherently lower financial risk) Intangibles amortization (5.5) (2.7) Total $ 74.2 $ 79.7 (6.9%) • GAAP diluted earnings per share were also better- than-forecast and benefitted from the strong financial Operating Margin % 11.2% 12.8% performance in the U.S. Health and Human Services Income tax expense $ 19.8 $ 19.9 Segment Income tax rate 26.2% 24.9% Net Income attributable We reorganized our reporting segments to be to MAXIMUS $ 55.9 $ 59.1 (5.4%) geographically based. This is the way we manage Diluted EPS - GAAP $ 0.86 $ 0.89 (3.4%) performance, allocate resources and evaluate results. Form 8-K filed December 14, 2018, to show re-cast financial results from FY17 and FY18. 3 | MAXIMUS: Q1 FY19 EARNINGS PRESENTATION
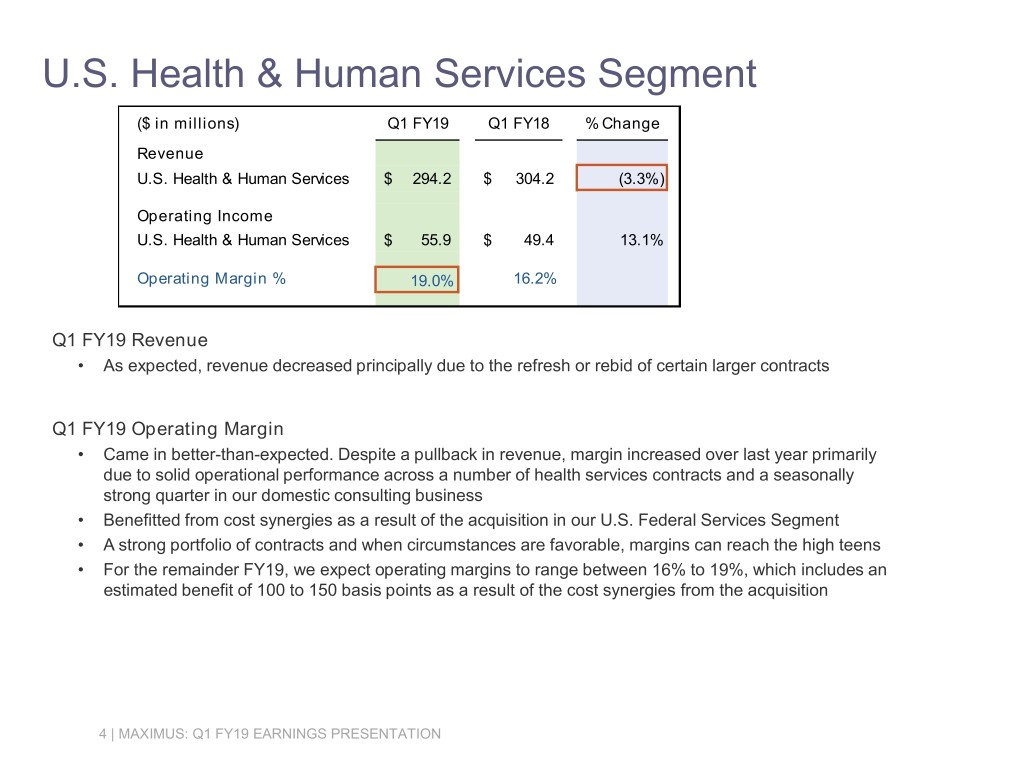
U.S. Health & Human Services Segment ($ in millions) Q1 FY19 Q1 FY18 % Change Revenue U.S. Health & Human Services $ 294.2 $ 304.2 (3.3%) Operating Income U.S. Health & Human Services $ 55.9 $ 49.4 13.1% Operating Margin % 19.0% 16.2% Q1 FY19 Revenue • As expected, revenue decreased principally due to the refresh or rebid of certain larger contracts Q1 FY19 Operating Margin • Came in better-than-expected. Despite a pullback in revenue, margin increased over last year primarily due to solid operational performance across a number of health services contracts and a seasonally strong quarter in our domestic consulting business • Benefitted from cost synergies as a result of the acquisition in our U.S. Federal Services Segment • A strong portfolio of contracts and when circumstances are favorable, margins can reach the high teens • For the remainder FY19, we expect operating margins to range between 16% to 19%, which includes an estimated benefit of 100 to 150 basis points as a result of the cost synergies from the acquisition 4 | MAXIMUS: Q1 FY19 EARNINGS PRESENTATION
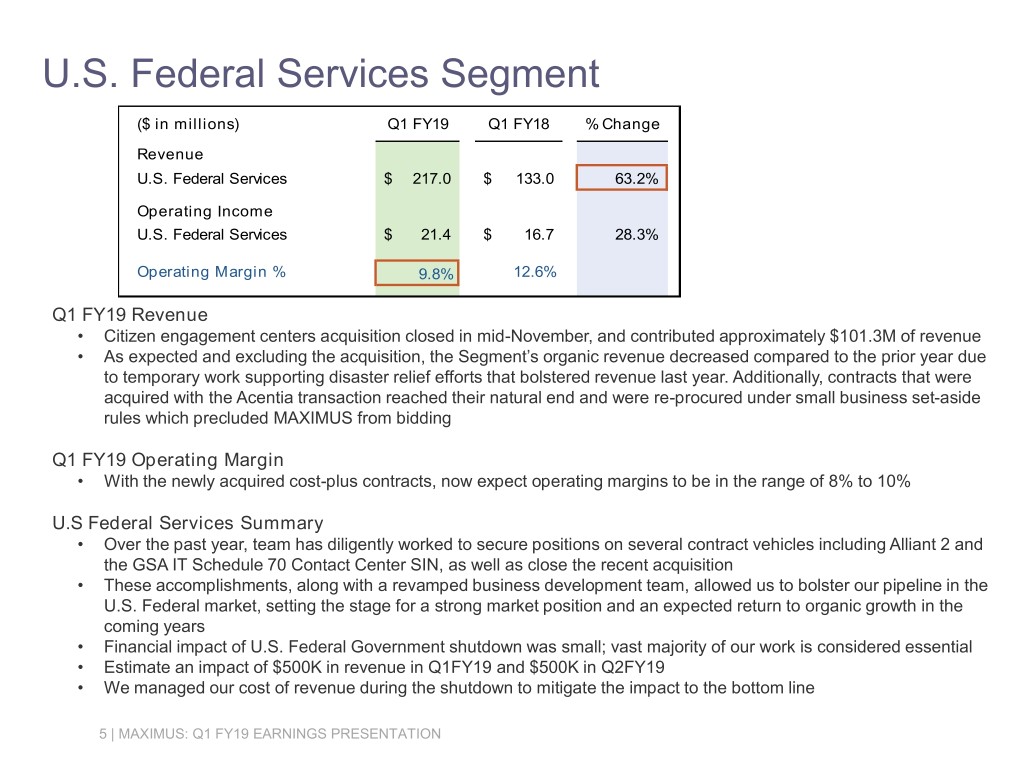
U.S. Federal Services Segment ($ in millions) Q1 FY19 Q1 FY18 % Change Revenue U.S. Federal Services $ 217.0 $ 133.0 63.2% Operating Income U.S. Federal Services $ 21.4 $ 16.7 28.3% Operating Margin % 9.8% 12.6% Q1 FY19 Revenue • Citizen engagement centers acquisition closed in mid-November, and contributed approximately $101.3M of revenue • As expected and excluding the acquisition, the Segment’s organic revenue decreased compared to the prior year due to temporary work supporting disaster relief efforts that bolstered revenue last year. Additionally, contracts that were acquired with the Acentia transaction reached their natural end and were re-procured under small business set-aside rules which precluded MAXIMUS from bidding Q1 FY19 Operating Margin • With the newly acquired cost-plus contracts, now expect operating margins to be in the range of 8% to 10% U.S Federal Services Summary • Over the past year, team has diligently worked to secure positions on several contract vehicles including Alliant 2 and the GSA IT Schedule 70 Contact Center SIN, as well as close the recent acquisition • These accomplishments, along with a revamped business development team, allowed us to bolster our pipeline in the U.S. Federal market, setting the stage for a strong market position and an expected return to organic growth in the coming years • Financial impact of U.S. Federal Government shutdown was small; vast majority of our work is considered essential • Estimate an impact of $500K in revenue in Q1FY19 and $500K in Q2FY19 • We managed our cost of revenue during the shutdown to mitigate the impact to the bottom line 5 | MAXIMUS: Q1 FY19 EARNINGS PRESENTATION
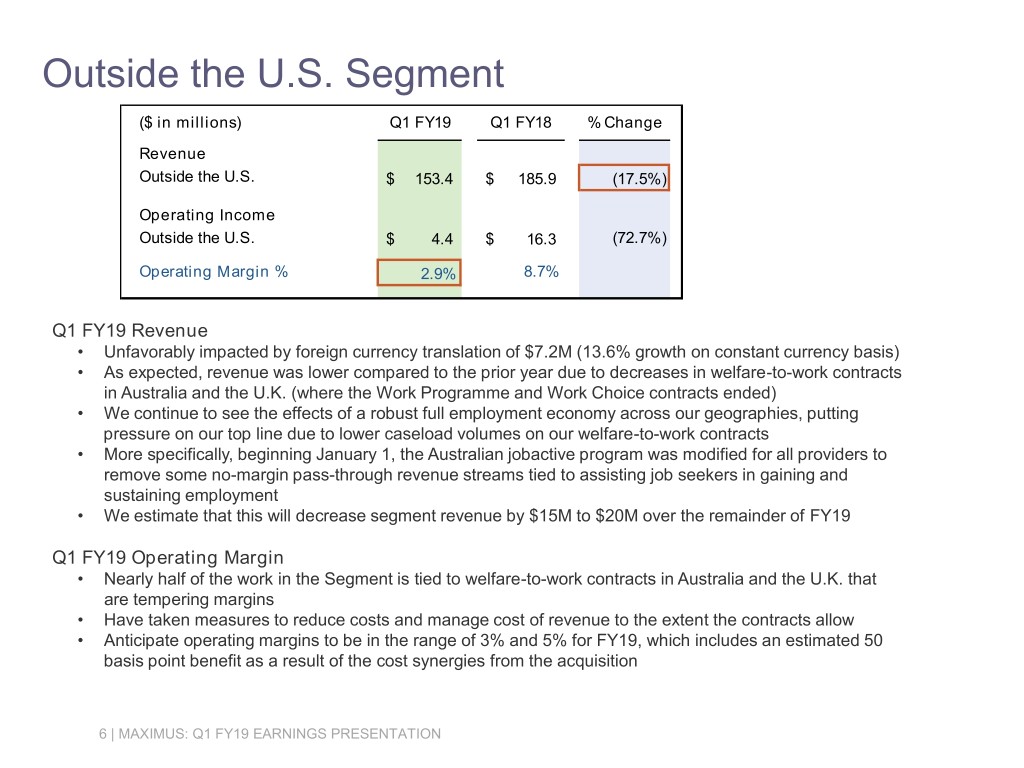
Outside the U.S. Segment ($ in millions) Q1 FY19 Q1 FY18 % Change Revenue Outside the U.S. $ 153.4 $ 185.9 (17.5%) Operating Income Outside the U.S. $ 4.4 $ 16.3 (72.7%) Operating Margin % 2.9% 8.7% Q1 FY19 Revenue • Unfavorably impacted by foreign currency translation of $7.2M (13.6% growth on constant currency basis) • As expected, revenue was lower compared to the prior year due to decreases in welfare-to-work contracts in Australia and the U.K. (where the Work Programme and Work Choice contracts ended) • We continue to see the effects of a robust full employment economy across our geographies, putting pressure on our top line due to lower caseload volumes on our welfare-to-work contracts • More specifically, beginning January 1, the Australian jobactive program was modified for all providers to remove some no-margin pass-through revenue streams tied to assisting job seekers in gaining and sustaining employment • We estimate that this will decrease segment revenue by $15M to $20M over the remainder of FY19 Q1 FY19 Operating Margin • Nearly half of the work in the Segment is tied to welfare-to-work contracts in Australia and the U.K. that are tempering margins • Have taken measures to reduce costs and manage cost of revenue to the extent the contracts allow • Anticipate operating margins to be in the range of 3% and 5% for FY19, which includes an estimated 50 basis point benefit as a result of the cost synergies from the acquisition 6 | MAXIMUS: Q1 FY19 EARNINGS PRESENTATION
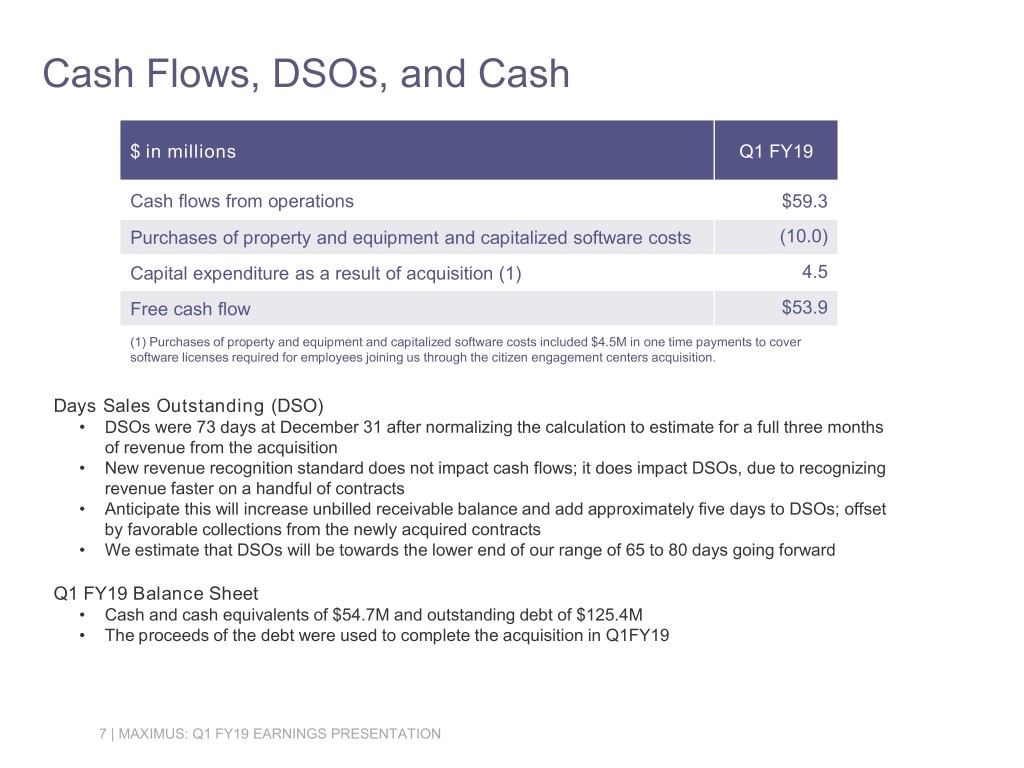
Cash Flows, DSOs, and Cash $ in millions Q1 FY19 Cash flows from operations $59.3 Purchases of property and equipment and capitalized software costs (10.0) Capital expenditure as a result of acquisition (1) 4.5 Free cash flow $53.9 (1) Purchases of property and equipment and capitalized software costs included $4.5M in one time payments to cover software licenses required for employees joining us through the citizen engagement centers acquisition. Days Sales Outstanding (DSO) • DSOs were 73 days at December 31 after normalizing the calculation to estimate for a full three months of revenue from the acquisition • New revenue recognition standard does not impact cash flows; it does impact DSOs, due to recognizing revenue faster on a handful of contracts • Anticipate this will increase unbilled receivable balance and add approximately five days to DSOs; offset by favorable collections from the newly acquired contracts • We estimate that DSOs will be towards the lower end of our range of 65 to 80 days going forward Q1 FY19 Balance Sheet • Cash and cash equivalents of $54.7M and outstanding debt of $125.4M • The proceeds of the debt were used to complete the acquisition in Q1FY19 7 | MAXIMUS: Q1 FY19 EARNINGS PRESENTATION
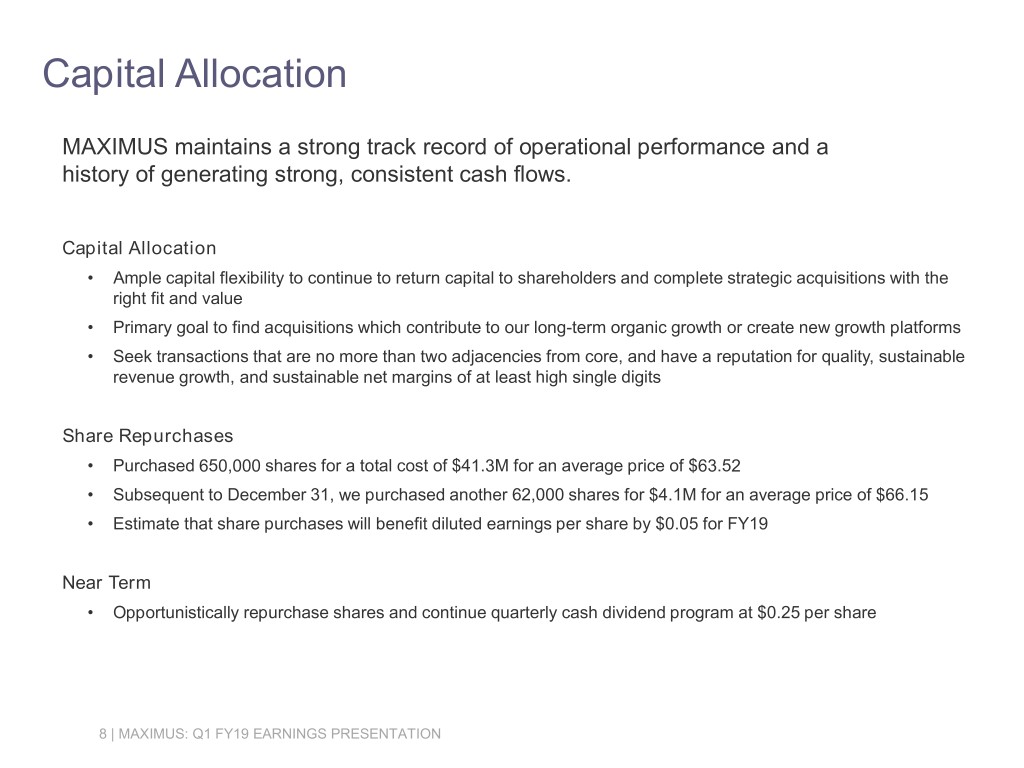
Capital Allocation MAXIMUS maintains a strong track record of operational performance and a history of generating strong, consistent cash flows. Capital Allocation • Ample capital flexibility to continue to return capital to shareholders and complete strategic acquisitions with the right fit and value • Primary goal to find acquisitions which contribute to our long-term organic growth or create new growth platforms • Seek transactions that are no more than two adjacencies from core, and have a reputation for quality, sustainable revenue growth, and sustainable net margins of at least high single digits Share Repurchases • Purchased 650,000 shares for a total cost of $41.3M for an average price of $63.52 • Subsequent to December 31, we purchased another 62,000 shares for $4.1M for an average price of $66.15 • Estimate that share purchases will benefit diluted earnings per share by $0.05 for FY19 Near Term • Opportunistically repurchase shares and continue quarterly cash dividend program at $0.25 per share 8 | MAXIMUS: Q1 FY19 EARNINGS PRESENTATION
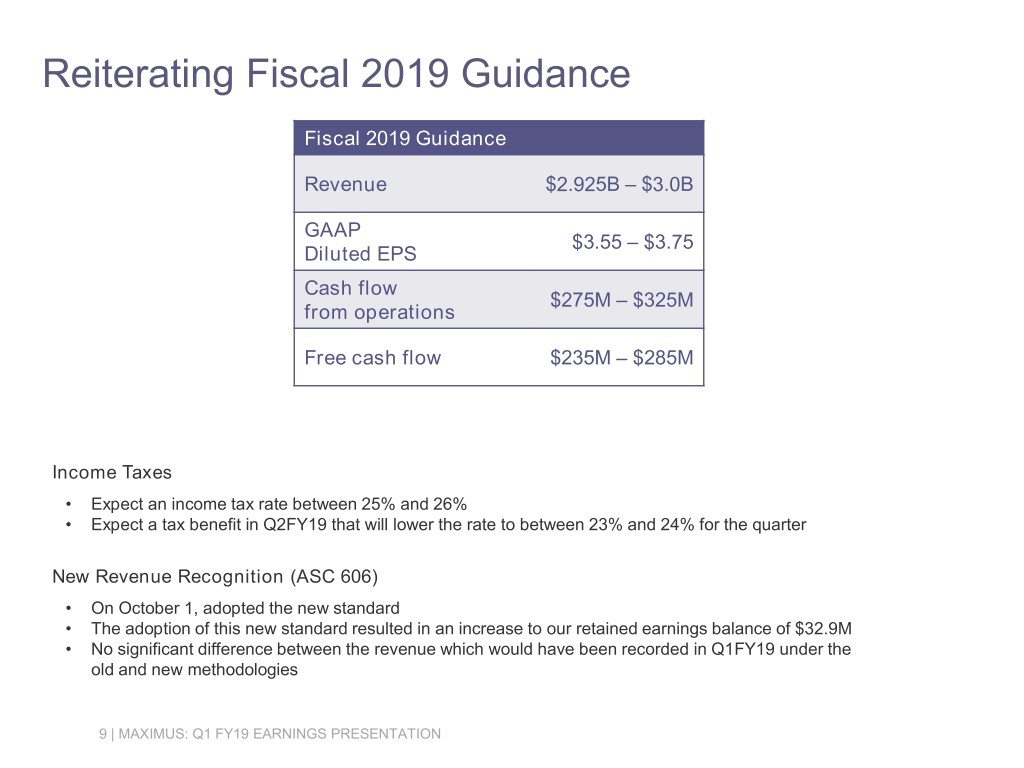
Reiterating Fiscal 2019 Guidance Fiscal 2019 Guidance Revenue $2.925B – $3.0B GAAP $3.55 – $3.75 Diluted EPS Cash flow $275M – $325M from operations Free cash flow $235M – $285M Income Taxes • Expect an income tax rate between 25% and 26% • Expect a tax benefit in Q2FY19 that will lower the rate to between 23% and 24% for the quarter New Revenue Recognition (ASC 606) • On October 1, adopted the new standard • The adoption of this new standard resulted in an increase to our retained earnings balance of $32.9M • No significant difference between the revenue which would have been recorded in Q1FY19 under the old and new methodologies 9 | MAXIMUS: Q1 FY19 EARNINGS PRESENTATION

Fiscal 2019 First Quarter Earnings Call Bruce Caswell President & Chief Executive Officer February 7, 2019
Solid First Quarter Fiscal 2019 Solid first quarter results Good performance in our U.S. Health and Human Services Segment On track to achieve FY19 guidance Meaningful progress as we: 1. Transform the customer experience with digital tools 2. Expand our clinical-related services 3. Extend our reach into new markets and customer areas 11 | MAXIMUS: Q1 FY19 EARNINGS PRESENTATION
U.S. Federal Segment Update • Less than 1% of the Segment revenue affected by the partial shutdown − Illustrates the critical nature of the business and service offerings in support of essential citizen services and safety-net programs • The acquired U.S. Federal contracts are the primary support vehicle for several of the nation’s most critical programs including the Federal Exchange and Medicare • Successfully transitioned these acquired operations during health plan open enrollment. Customer satisfaction for 2019 open enrollment period improved on these two programs over an already impressive score • New employees are passionate about serving our clients and beneficiaries and equally dedicated to supporting the communities in which they live and work • Recently, began servicing a new federal agency with subcontracted clinical assessments which required building a network of clinicians and certifying them to perform appraisals • New program work as a subcontractor performing medical record indexing and provider outreach and engagement services 12 | MAXIMUS: Q1 FY19 EARNINGS PRESENTATION
Pioneering Digital Transformation Strategy • Developing new solution sets to achieve additional operational and cost efficiencies through techniques such as cloud migration services, Artificial Intelligence – or AI, robotic process automation (RPA) and machine learning • Implementing new digital innovations within both business process management and as direct service offerings to continue to enhance portfolio of citizen services and federal capabilities • Offer advanced natural language recognition in our federally certified Intelligent Virtual Assistant, providing interactive conversational speech • Automated portal for certain clinical-related services streamlines the Independent Medical Review experience for citizens and doctors ̶ Allows AI search capabilities, transparent feedback and results ̶ An ever-learning machine ̶ Drives efficiency, enhances quality, and improves the overall citizen and physician reviewer experience • Launched the Virginia Medallion mobile Medicaid enrollment app ̶ Pushed digital to new heights in Virginia, where more than 40% of enrollments are being completed via web and mobile ̶ Mobile has already surpassed our early estimates, and is currently making up 26% of our overall digital volume in Virginia 13 | MAXIMUS: Q1 FY19 EARNINGS PRESENTATION
Digital Efforts Maturing Across Geographies • MAXIMUS Canada Enterprise Omni-channel Engagement Center offers a full range of engagement options to Canadians, including: ̶ video chat capabilities ̶ agent facilitated co-browsing to help citizens navigate online digital services ̶ text and web chat ̶ And more traditional voice, email and physical mail channels • Service BC contract supports a government unit that provides citizen services on behalf of various agencies via consolidated contact centers. This contract has financial incentives for meeting or exceeding citizen satisfaction targets • Digital enhancements are instrumental in transforming how citizens engage with programs and will continue to drive success • Government clients value the ability to leverage these digital capabilities to improve quality and service delivery 14 | MAXIMUS: Q1 FY19 EARNINGS PRESENTATION
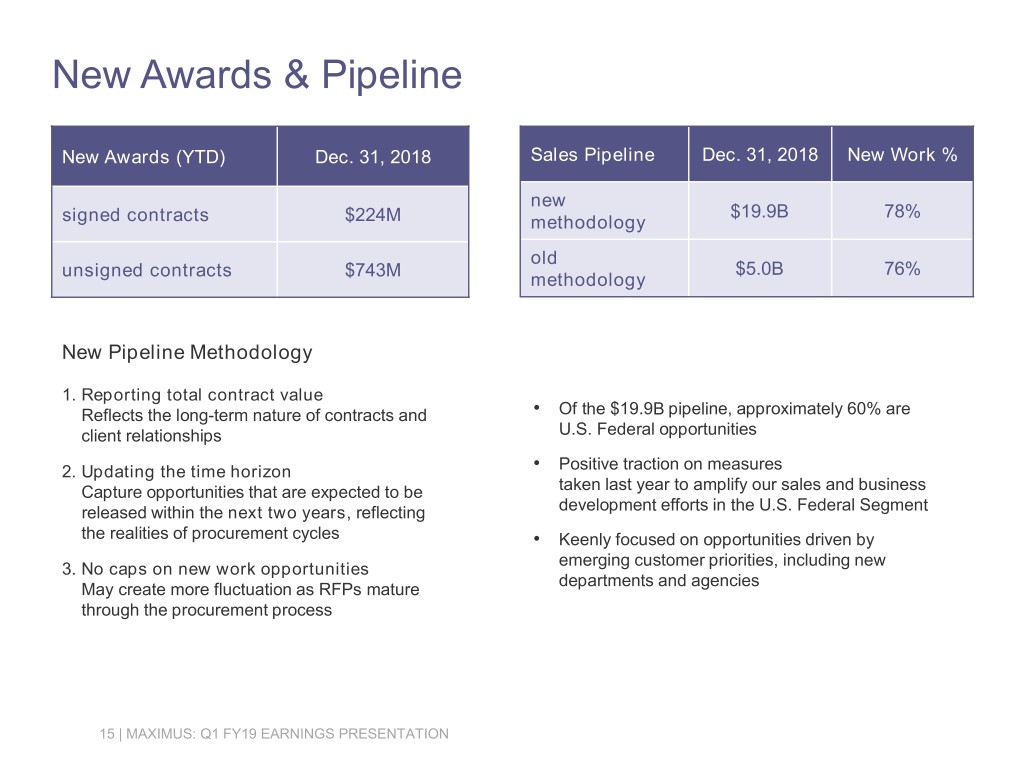
New Awards & Pipeline New Awards (YTD) Dec. 31, 2018 Sales Pipeline Dec. 31, 2018 New Work % new $19.9B 78% signed contracts $224M methodology old unsigned contracts $743M $5.0B 76% methodology New Pipeline Methodology 1. Reporting total contract value Reflects the long-term nature of contracts and • Of the $19.9B pipeline, approximately 60% are client relationships U.S. Federal opportunities 2. Updating the time horizon • Positive traction on measures Capture opportunities that are expected to be taken last year to amplify our sales and business released within the next two years, reflecting development efforts in the U.S. Federal Segment the realities of procurement cycles • Keenly focused on opportunities driven by emerging customer priorities, including new 3. No caps on new work opportunities departments and agencies May create more fluctuation as RFPs mature through the procurement process 15 | MAXIMUS: Q1 FY19 EARNINGS PRESENTATION
Conclusion • Thank you to John Haley who stepped down from the MAXIMUS board last month; Directors Russ Beliveau and Paul Lederer will retire in the spring of 2020 • MAXIMUS has a proven track record of solid operational delivery, a dedicated team of seasoned professionals and a portfolio of business that generates meaningful cash flow • Remain committed to using acquisitions as a platform to further drive organic growth; including strategic targets in new and adjacent markets as well as clinically related and digitally enabled services in existing geographies • Digital initiatives are enabling us to broaden our BPO business with a more enhanced set of core capabilities • Earned a reputation as a trusted long-term partner delivering outcomes that matter and continue to build on this foundation • Governments continue to focus on creating an even better citizen experience with core programs through the prudent adoption of digital technologies • Well positioned to achieve outcomes that matter by remaining keenly focused on providing services that are flexible, scalable and efficient, without losing sight of the citizens we serve 16 | MAXIMUS: Q1 FY19 EARNINGS PRESENTATION

APPENDIX 17 | MAXIMUS: Q1 FY19 EARNINGS PRESENTATION
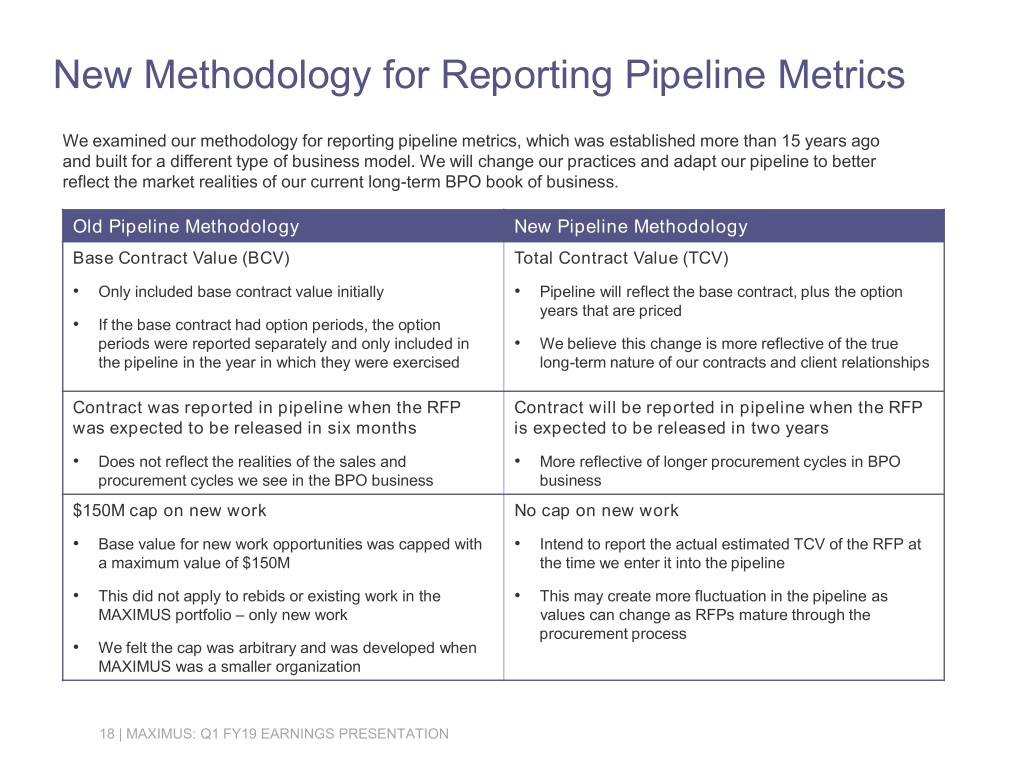
New Methodology for Reporting Pipeline Metrics We examined our methodology for reporting pipeline metrics, which was established more than 15 years ago and built for a different type of business model. We will change our practices and adapt our pipeline to better reflect the market realities of our current long-term BPO book of business. Old Pipeline Methodology New Pipeline Methodology Base Contract Value (BCV) Total Contract Value (TCV) • Only included base contract value initially • Pipeline will reflect the base contract, plus the option years that are priced • If the base contract had option periods, the option periods were reported separately and only included in • We believe this change is more reflective of the true the pipeline in the year in which they were exercised long-term nature of our contracts and client relationships Contract was reported in pipeline when the RFP Contract will be reported in pipeline when the RFP was expected to be released in six months is expected to be released in two years • Does not reflect the realities of the sales and • More reflective of longer procurement cycles in BPO procurement cycles we see in the BPO business business $150M cap on new work No cap on new work • Base value for new work opportunities was capped with • Intend to report the actual estimated TCV of the RFP at a maximum value of $150M the time we enter it into the pipeline • This did not apply to rebids or existing work in the • This may create more fluctuation in the pipeline as MAXIMUS portfolio – only new work values can change as RFPs mature through the procurement process • We felt the cap was arbitrary and was developed when MAXIMUS was a smaller organization 18 | MAXIMUS: Q1 FY19 EARNINGS PRESENTATION