
Fiscal 2018 Second Quarter Earnings Call Rick Nadeau Chief Financial Officer May 10, 2018
Forward-looking Statements & Non-GAAP Information These slides should be read in conjunction with the Company’s most recent quarterly earnings press release, along with listening to or reading a transcript of the comments of Company management from our most recent quarterly earnings conference call. This document may contain non-GAAP financial information. Management uses this information in its internal analysis of results and believes that this information may be informative to investors in gauging the quality of our financial performance, identifying trends in our results, and providing meaningful period-to- period comparisons. These measures should be used in conjunction with, rather than instead of, their comparable GAAP measures. For a reconciliation of non-GAAP measures to the comparable GAAP measures presented in this document, see the Company’s most recent quarterly earnings press release. Throughout this presentation, numbers may not add due to rounding. A number of statements being made today will be forward-looking in nature. Such statements are only predictions and actual events or results may differ materially as a result of risks the Company faces, including those discussed in Exhibit 99.1 of our SEC filings. We encourage you to review the information contained in our earnings release and our most recent Forms 10-Q and 10-K filed with the SEC. The Company does not assume any obligation to revise or update these forward-looking statements to reflect subsequent events or circumstances, except as required by law. 2 | MAXIMUS: Q2 FY18 EARNINGS PRESENTATION
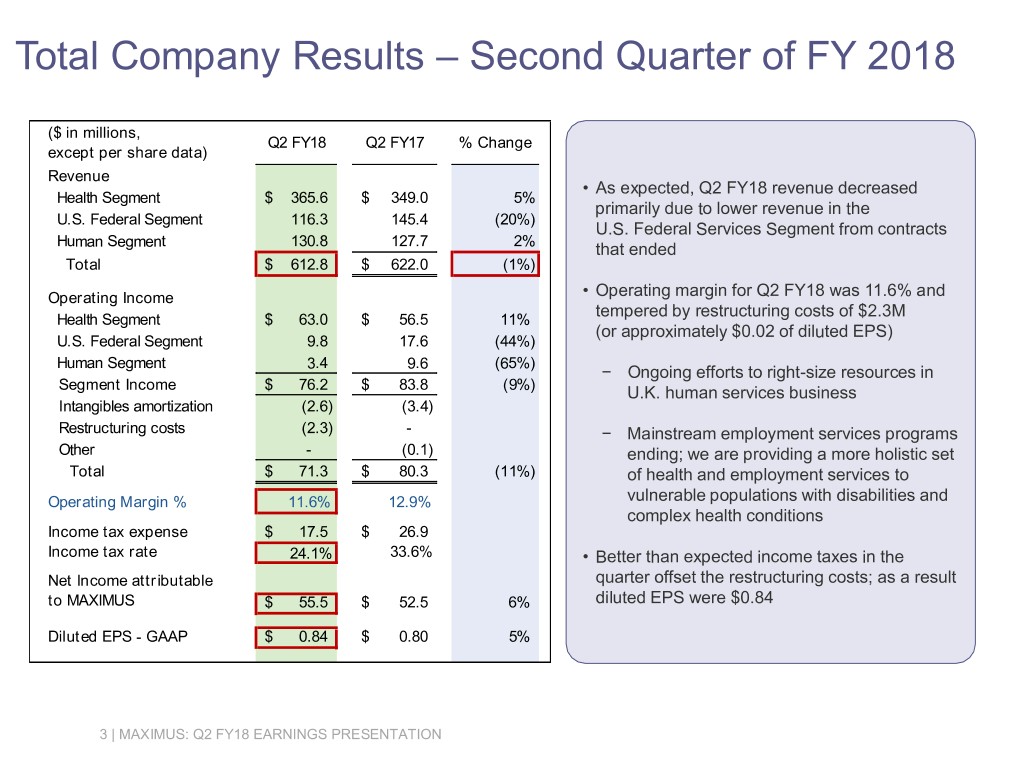
Total Company Results – Second Quarter of FY 2018 ($ in millions, Q2 FY18 Q2 FY17 % Change except per share data) Revenue • As expected, Q2 FY18 revenue decreased Health Segment $ 365.6 $ 349.0 5% primarily due to lower revenue in the U.S. Federal Segment 116.3 145.4 (20%) U.S. Federal Services Segment from contracts Human Segment 130.8 127.7 2% that ended Total $ 612.8 $ 622.0 (1%) Operating Income • Operating margin for Q2 FY18 was 11.6% and tempered by restructuring costs of $2.3M Health Segment $ 63.0 $ 56.5 11% (or approximately $0.02 of diluted EPS) U.S. Federal Segment 9.8 17.6 (44%) Human Segment 3.4 9.6 (65%) − Ongoing efforts to right-size resources in Segment Income $ 76.2 $ 83.8 (9%) U.K. human services business Intangibles amortization (2.6) (3.4) Restructuring costs (2.3) - − Mainstream employment services programs Other - (0.1) ending; we are providing a more holistic set Total $ 71.3 $ 80.3 (11%) of health and employment services to Operating Margin % 11.6% 12.9% vulnerable populations with disabilities and complex health conditions Income tax expense $ 17.5 $ 26.9 Income tax rate 24.1% 33.6% • Better than expected income taxes in the Net Income attributable quarter offset the restructuring costs; as a result to MAXIMUS $ 55.5 $ 52.5 6% diluted EPS were $0.84 Diluted EPS - GAAP $ 0.84 $ 0.80 5% 3 | MAXIMUS: Q2 FY18 EARNINGS PRESENTATION
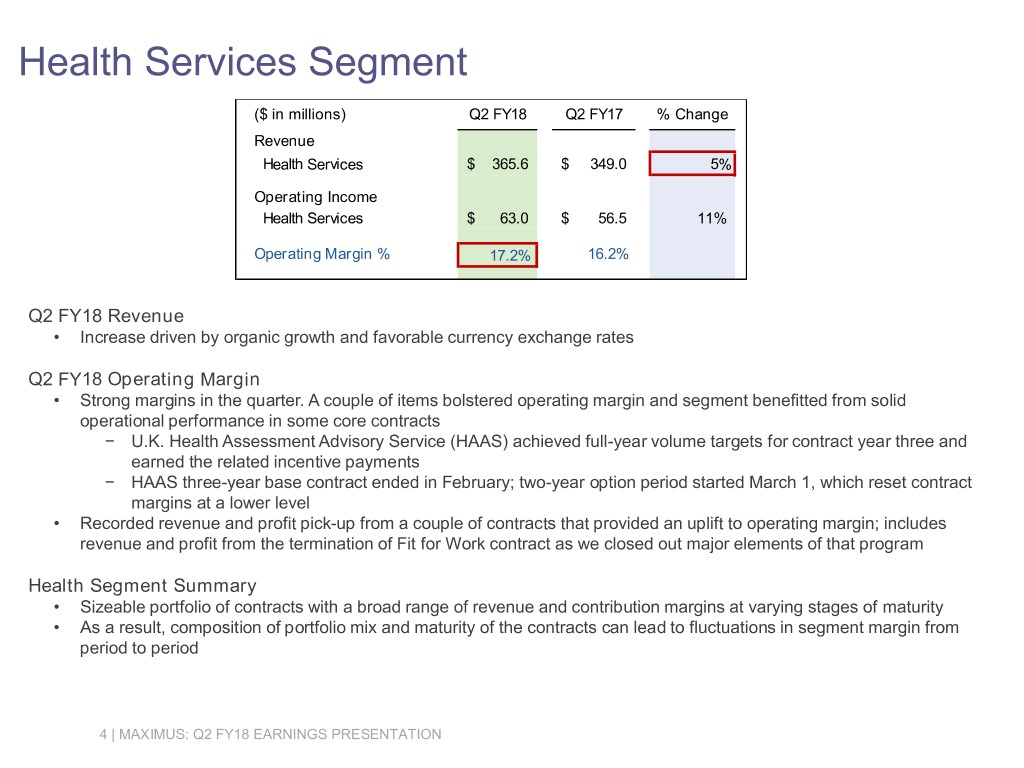
Health Services Segment ($ in millions) Q2 FY18 Q2 FY17 % Change Revenue Health Services $ 365.6 $ 349.0 5% Operating Income Health Services $ 63.0 $ 56.5 11% Operating Margin % 17.2% 16.2% Q2 FY18 Revenue • Increase driven by organic growth and favorable currency exchange rates Q2 FY18 Operating Margin • Strong margins in the quarter. A couple of items bolstered operating margin and segment benefitted from solid operational performance in some core contracts − U.K. Health Assessment Advisory Service (HAAS) achieved full-year volume targets for contract year three and earned the related incentive payments − HAAS three-year base contract ended in February; two-year option period started March 1, which reset contract margins at a lower level • Recorded revenue and profit pick-up from a couple of contracts that provided an uplift to operating margin; includes revenue and profit from the termination of Fit for Work contract as we closed out major elements of that program Health Segment Summary • Sizeable portfolio of contracts with a broad range of revenue and contribution margins at varying stages of maturity • As a result, composition of portfolio mix and maturity of the contracts can lead to fluctuations in segment margin from period to period 4 | MAXIMUS: Q2 FY18 EARNINGS PRESENTATION
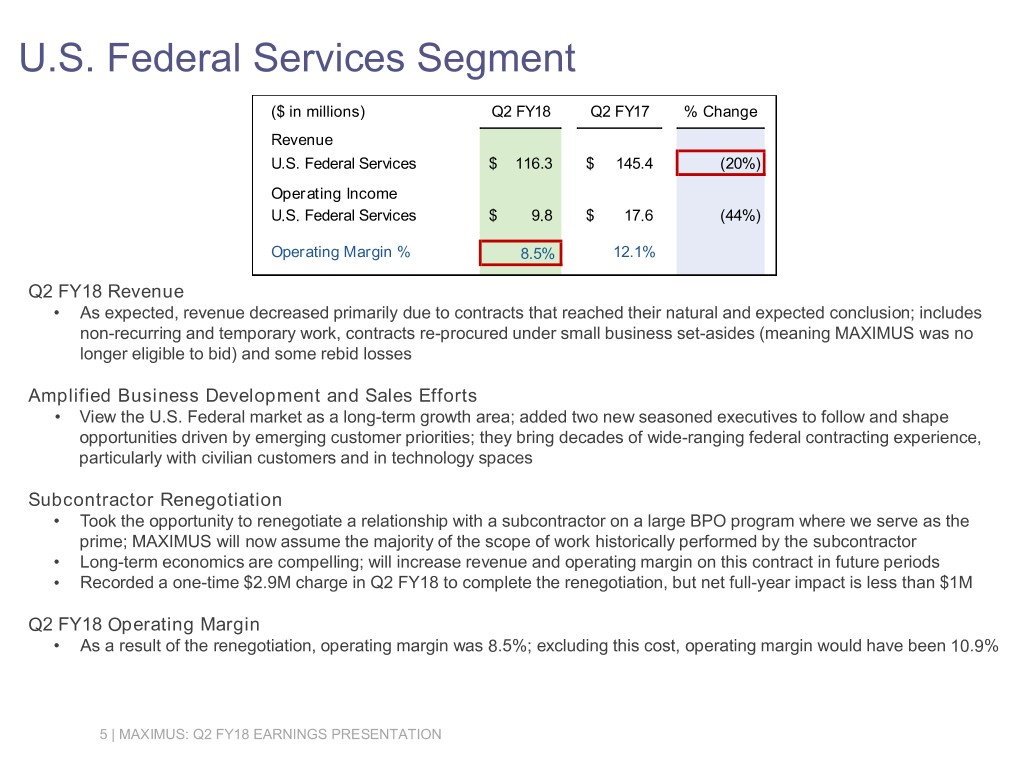
U.S. Federal Services Segment ($ in millions) Q2 FY18 Q2 FY17 % Change Revenue U.S. Federal Services $ 116.3 $ 145.4 (20%) Operating Income U.S. Federal Services $ 9.8 $ 17.6 (44%) Operating Margin % 8.5% 12.1% Q2 FY18 Revenue • As expected, revenue decreased primarily due to contracts that reached their natural and expected conclusion; includes non-recurring and temporary work, contracts re-procured under small business set-asides (meaning MAXIMUS was no longer eligible to bid) and some rebid losses Amplified Business Development and Sales Efforts • View the U.S. Federal market as a long-term growth area; added two new seasoned executives to follow and shape opportunities driven by emerging customer priorities; they bring decades of wide-ranging federal contracting experience, particularly with civilian customers and in technology spaces Subcontractor Renegotiation • Took the opportunity to renegotiate a relationship with a subcontractor on a large BPO program where we serve as the prime; MAXIMUS will now assume the majority of the scope of work historically performed by the subcontractor • Long-term economics are compelling; will increase revenue and operating margin on this contract in future periods • Recorded a one-time $2.9M charge in Q2 FY18 to complete the renegotiation, but net full-year impact is less than $1M Q2 FY18 Operating Margin • As a result of the renegotiation, operating margin was 8.5%; excluding this cost, operating margin would have been 10.9% 5 | MAXIMUS: Q2 FY18 EARNINGS PRESENTATION
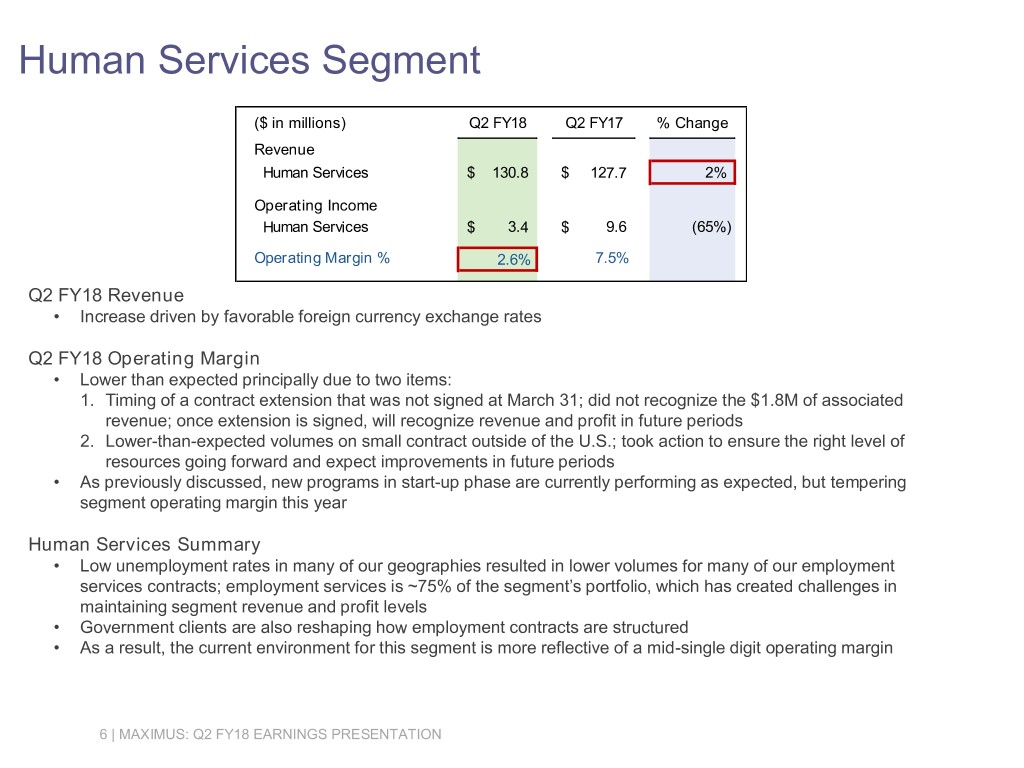
Human Services Segment ($ in millions) Q2 FY18 Q2 FY17 % Change Revenue Human Services $ 130.8 $ 127.7 2% Operating Income Human Services $ 3.4 $ 9.6 (65%) Operating Margin % 2.6% 7.5% Q2 FY18 Revenue • Increase driven by favorable foreign currency exchange rates Q2 FY18 Operating Margin • Lower than expected principally due to two items: 1. Timing of a contract extension that was not signed at March 31; did not recognize the $1.8M of associated revenue; once extension is signed, will recognize revenue and profit in future periods 2. Lower-than-expected volumes on small contract outside of the U.S.; took action to ensure the right level of resources going forward and expect improvements in future periods • As previously discussed, new programs in start-up phase are currently performing as expected, but tempering segment operating margin this year Human Services Summary • Low unemployment rates in many of our geographies resulted in lower volumes for many of our employment services contracts; employment services is ~75% of the segment’s portfolio, which has created challenges in maintaining segment revenue and profit levels • Government clients are also reshaping how employment contracts are structured • As a result, the current environment for this segment is more reflective of a mid-single digit operating margin 6 | MAXIMUS: Q2 FY18 EARNINGS PRESENTATION
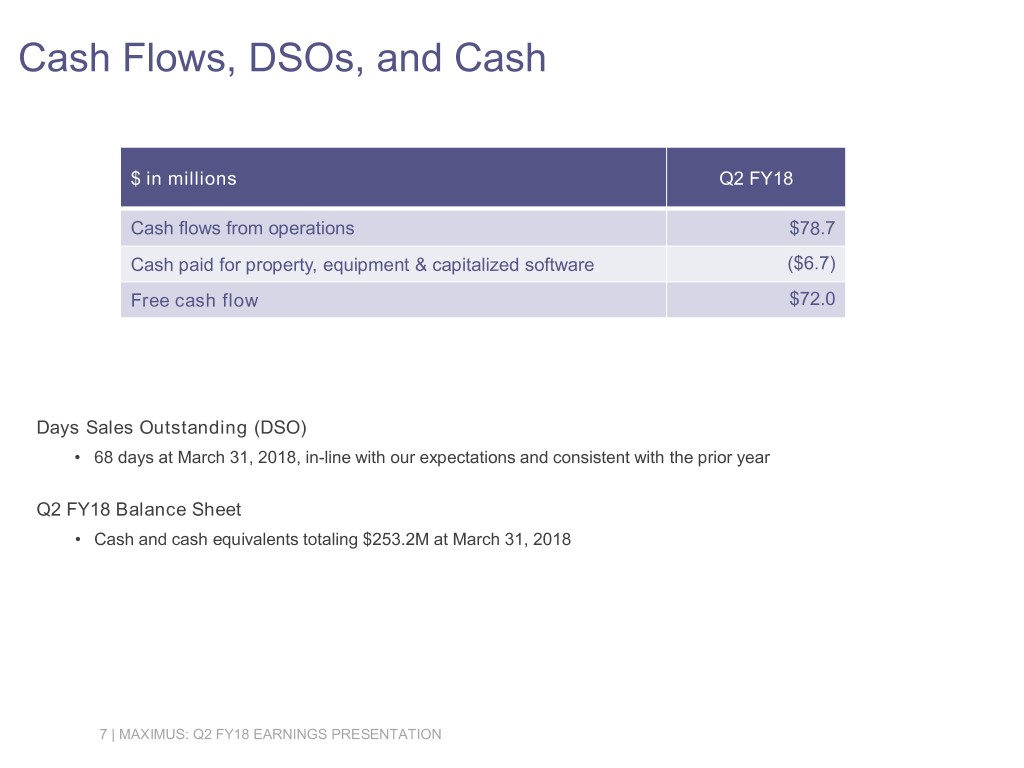
Cash Flows, DSOs, and Cash $ in millions Q2 FY18 Cash flows from operations $78.7 Cash paid for property, equipment & capitalized software ($6.7) Free cash flow $72.0 Days Sales Outstanding (DSO) • 68 days at March 31, 2018, in-line with our expectations and consistent with the prior year Q2 FY18 Balance Sheet • Cash and cash equivalents totaling $253.2M at March 31, 2018 7 | MAXIMUS: Q2 FY18 EARNINGS PRESENTATION
Capital Allocation • Strategy remains largely unchanged; as good stewards of capital, we remain committed to a disciplined approach to acquisitions • Over the past 12 months, looked at a number of properties sold at valuations that we considered too lofty; we believe we made sensible decisions and are not being overly selective • Our fresh look at our long-term growth strategy will inform and shape our thinking as we seek acquisition candidates and pursue ways to incorporate new growth platforms and adjacencies • Goal is for an acquisition to contribute to long-term organic growth or create a new growth platform. Example: Health Management gave us qualifications and skillsets to bid on HAAS and helped us reach a strategic goal of running clinical BPO at scale • Seek transactions no more than two adjacencies from our core, and have a reputation for quality, sustainable revenue growth, and sustainable net margins of at least high single digits • Have an active M&A process with regular evaluations of potential properties in our core and adjacent markets • Continue to keep quarterly dividend and opportunistic share buybacks, but would like to have capital available for M&A 8 | MAXIMUS: Q2 FY18 EARNINGS PRESENTATION
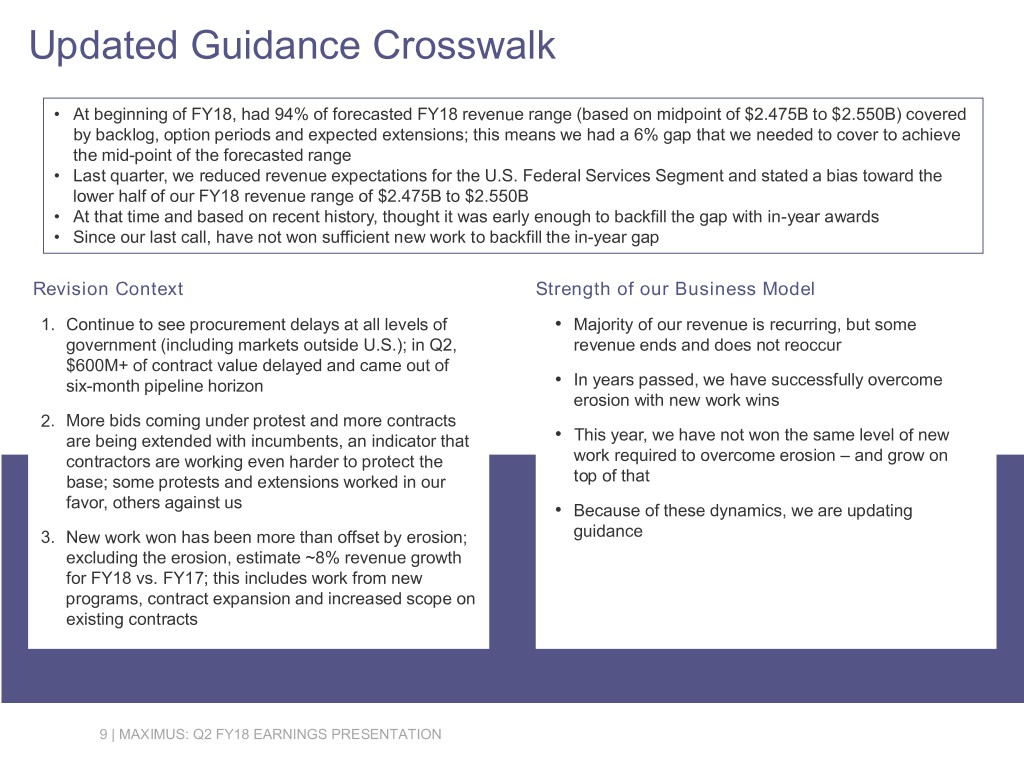
Updated Guidance Crosswalk • At beginning of FY18, had 94% of forecasted FY18 revenue range (based on midpoint of $2.475B to $2.550B) covered by backlog, option periods and expected extensions; this means we had a 6% gap that we needed to cover to achieve the mid-point of the forecasted range • Last quarter, we reduced revenue expectations for the U.S. Federal Services Segment and stated a bias toward the lower half of our FY18 revenue range of $2.475B to $2.550B • At that time and based on recent history, thought it was early enough to backfill the gap with in-year awards • Since our last call, have not won sufficient new work to backfill the in-year gap Revision Context Strength of our Business Model 1. Continue to see procurement delays at all levels of • Majority of our revenue is recurring, but some government (including markets outside U.S.); in Q2, revenue ends and does not reoccur $600M+ of contract value delayed and came out of six-month pipeline horizon • In years passed, we have successfully overcome erosion with new work wins 2. More bids coming under protest and more contracts are being extended with incumbents, an indicator that • This year, we have not won the same level of new contractors are working even harder to protect the work required to overcome erosion – and grow on base; some protests and extensions worked in our top of that favor, others against us • Because of these dynamics, we are updating 3. New work won has been more than offset by erosion; guidance excluding the erosion, estimate ~8% revenue growth for FY18 vs. FY17; this includes work from new programs, contract expansion and increased scope on existing contracts 9 | MAXIMUS: Q2 FY18 EARNINGS PRESENTATION
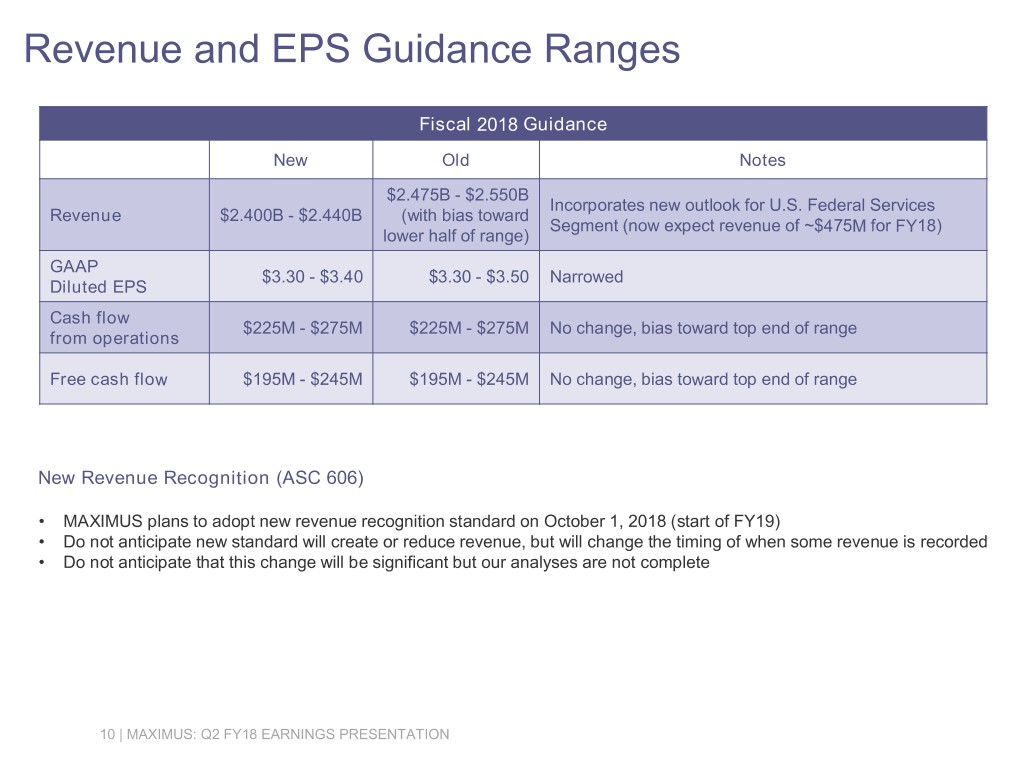
Revenue and EPS Guidance Ranges Fiscal 2018 Guidance New Old Notes $2.475B - $2.550B Incorporates new outlook for U.S. Federal Services Revenue $2.400B - $2.440B (with bias toward Segment (now expect revenue of ~$475M for FY18) lower half of range) GAAP $3.30 - $3.40 $3.30 - $3.50 Narrowed Diluted EPS Cash flow $225M - $275M $225M - $275M No change, bias toward top end of range from operations Free cash flow $195M - $245M $195M - $245M No change, bias toward top end of range New Revenue Recognition (ASC 606) • MAXIMUS plans to adopt new revenue recognition standard on October 1, 2018 (start of FY19) • Do not anticipate new standard will create or reduce revenue, but will change the timing of when some revenue is recorded • Do not anticipate that this change will be significant but our analyses are not complete 10 | MAXIMUS: Q2 FY18 EARNINGS PRESENTATION

Fiscal 2018 Second Quarter Earnings Call Bruce Caswell President & Chief Executive Officer May 10, 2018
Introduction • Forty days in as CEO; with the guidance update, I am committed to making sure we: 1. Continue to execute well and deliver value on our existing work that serves as the foundation for future growth 2. Remain focused on technology-driven innovation, particularly in the areas of clinical solutions and digital transformation 3. Make sure we are in the right markets with the right solutions at the right time • MAXIMUS has a proven track record of growth, a team of seasoned operators, and a portfolio of contracts that generates meaningful cash flow • We have earned a reputation as a trusted long-term partner who delivers outcomes that matter 12 | MAXIMUS: Q2 FY18 EARNINGS PRESENTATION
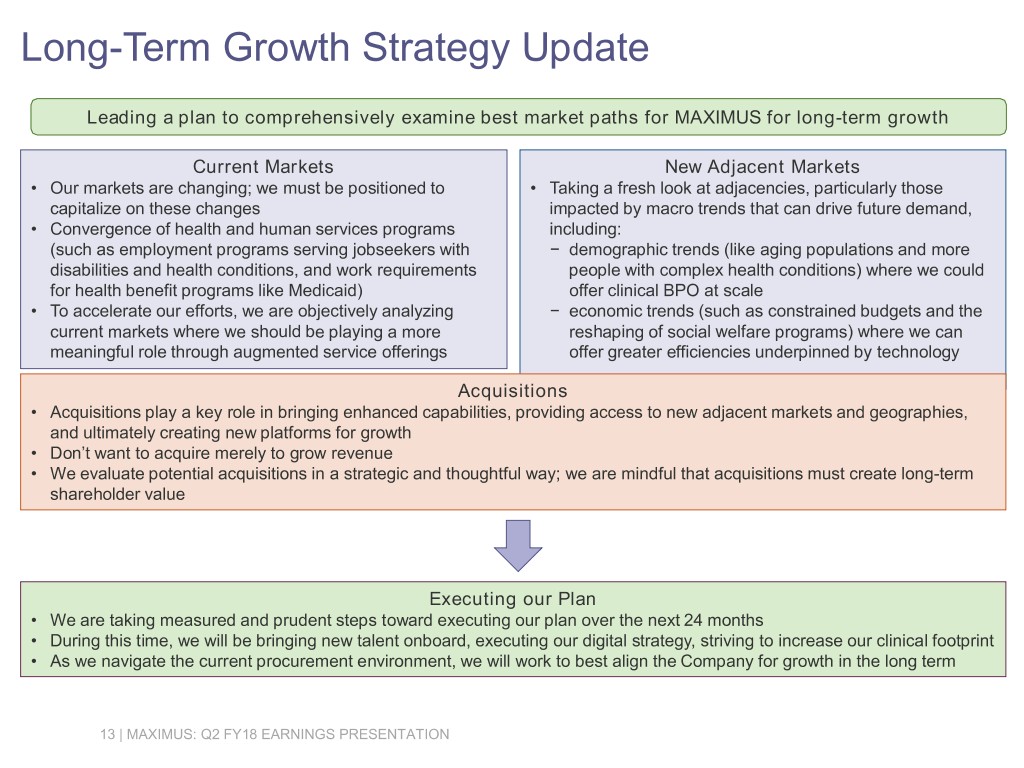
Long-Term Growth Strategy Update Leading a plan to comprehensively examine best market paths for MAXIMUS for long-term growth Current Markets New Adjacent Markets • Our markets are changing; we must be positioned to • Taking a fresh look at adjacencies, particularly those capitalize on these changes impacted by macro trends that can drive future demand, • Convergence of health and human services programs including: (such as employment programs serving jobseekers with − demographic trends (like aging populations and more disabilities and health conditions, and work requirements people with complex health conditions) where we could for health benefit programs like Medicaid) offer clinical BPO at scale • To accelerate our efforts, we are objectively analyzing − economic trends (such as constrained budgets and the current markets where we should be playing a more reshaping of social welfare programs) where we can meaningful role through augmented service offerings offer greater efficiencies underpinned by technology Acquisitions • Acquisitions play a key role in bringing enhanced capabilities, providing access to new adjacent markets and geographies, and ultimately creating new platforms for growth • Don’t want to acquire merely to grow revenue • We evaluate potential acquisitions in a strategic and thoughtful way; we are mindful that acquisitions must create long-term shareholder value Executing our Plan • We are taking measured and prudent steps toward executing our plan over the next 24 months • During this time, we will be bringing new talent onboard, executing our digital strategy, striving to increase our clinical footprint • As we navigate the current procurement environment, we will work to best align the Company for growth in the long term 13 | MAXIMUS: Q2 FY18 EARNINGS PRESENTATION
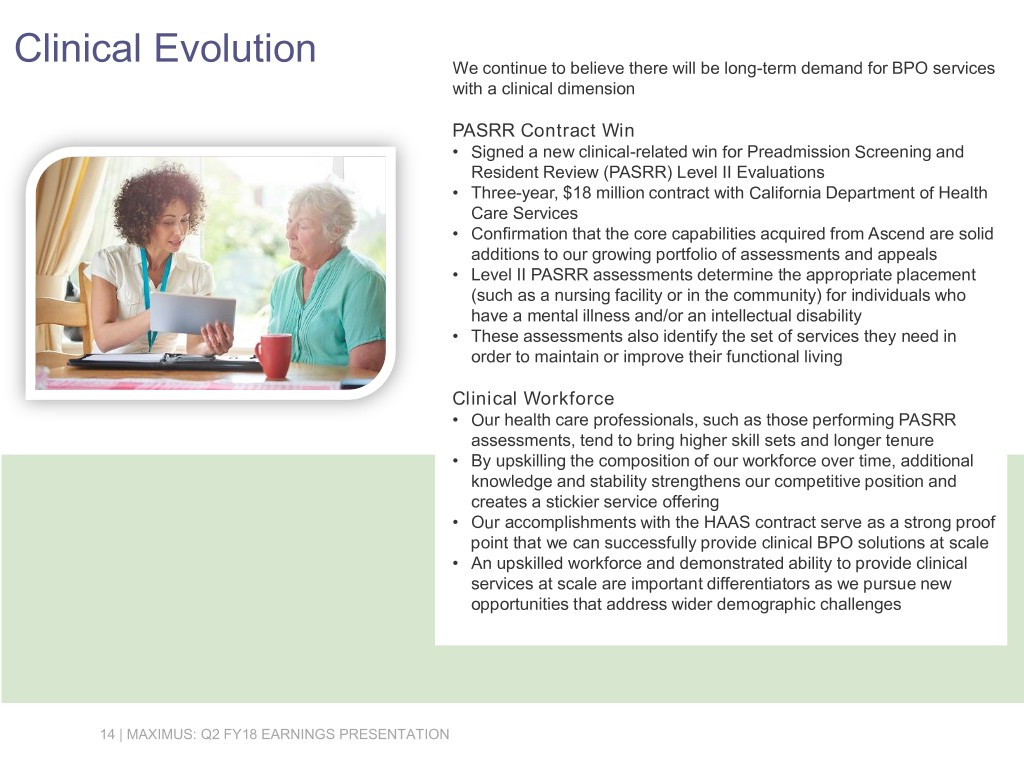
Clinical Evolution We continue to believe there will be long-term demand for BPO services with a clinical dimension PASRR Contract Win • Signed a new clinical-related win for Preadmission Screening and Resident Review (PASRR) Level II Evaluations • Three-year, $18 million contract with California Department of Health Care Services • Confirmation that the core capabilities acquired from Ascend are solid additions to our growing portfolio of assessments and appeals • Level II PASRR assessments determine the appropriate placement (such as a nursing facility or in the community) for individuals who have a mental illness and/or an intellectual disability • These assessments also identify the set of services they need in order to maintain or improve their functional living Clinical Workforce • Our health care professionals, such as those performing PASRR assessments, tend to bring higher skill sets and longer tenure • By upskilling the composition of our workforce over time, additional knowledge and stability strengthens our competitive position and creates a stickier service offering • Our accomplishments with the HAAS contract serve as a strong proof point that we can successfully provide clinical BPO solutions at scale • An upskilled workforce and demonstrated ability to provide clinical services at scale are important differentiators as we pursue new opportunities that address wider demographic challenges 14 | MAXIMUS: Q2 FY18 EARNINGS PRESENTATION
Digital Transformation Implementing digital enhancements into our operations regularly Robotic Process Automation (RPA) & Machine Learning • Currently implementing RPA in nearly a dozen projects and have several other initiatives in the works Workflow Automation • Application of augmented intelligence techniques to workflow automation in the assessments area • Clients value our ability to leverage these types of digital capabilities that create more efficiencies and improve quality and service delivery Clinical and Digital Solutions • This includes digital initiatives to drive caseloads for our new disability employment work in Australia and the deployment of our digital wellbeing solutions beyond our current footprint Leading the Transformation • With so much activity underway, having the right leaders at the helm is important; to further strengthen our management bench, we are adding a new Chief Medical Officer and a new Chief Digital Officer 15 | MAXIMUS: Q2 FY18 EARNINGS PRESENTATION
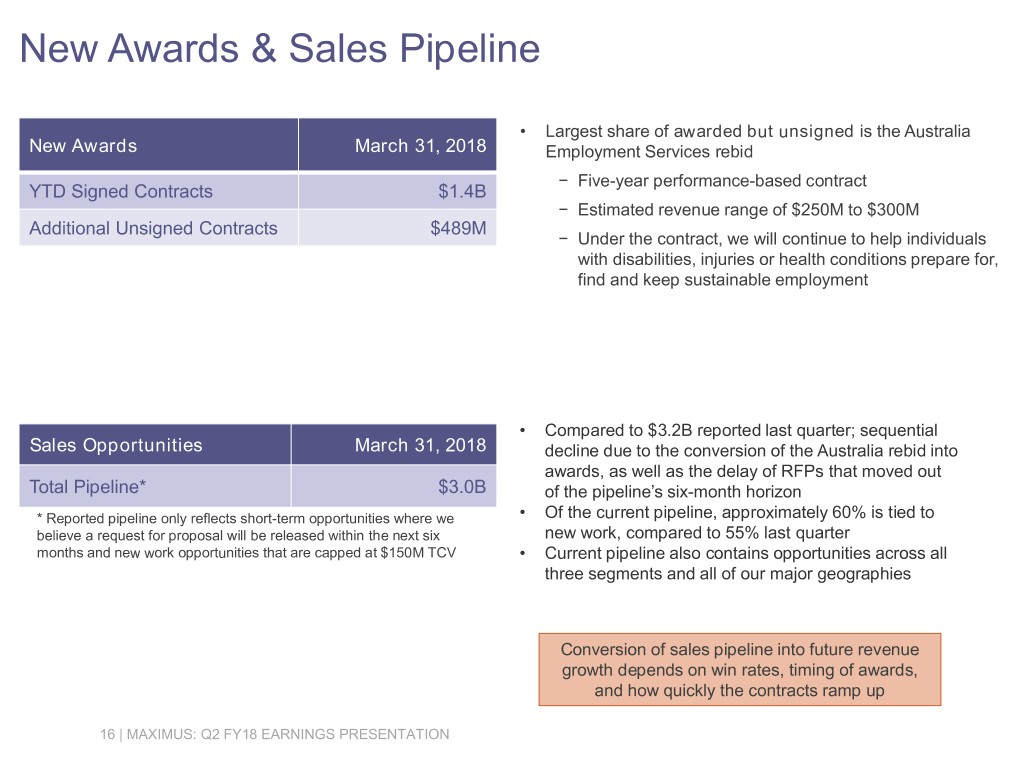
New Awards & Sales Pipeline • Largest share of awarded but unsigned is the Australia New Awards March 31, 2018 Employment Services rebid − Five-year performance-based contract YTD Signed Contracts $1.4B − Estimated revenue range of $250M to $300M Additional Unsigned Contracts $489M − Under the contract, we will continue to help individuals with disabilities, injuries or health conditions prepare for, find and keep sustainable employment • Compared to $3.2B reported last quarter; sequential Sales Opportunities March 31, 2018 decline due to the conversion of the Australia rebid into awards, as well as the delay of RFPs that moved out Total Pipeline* $3.0B of the pipeline’s six-month horizon * Reported pipeline only reflects short-term opportunities where we • Of the current pipeline, approximately 60% is tied to believe a request for proposal will be released within the next six new work, compared to 55% last quarter months and new work opportunities that are capped at $150M TCV • Current pipeline also contains opportunities across all three segments and all of our major geographies Conversion of sales pipeline into future revenue growth depends on win rates, timing of awards, and how quickly the contracts ramp up 16 | MAXIMUS: Q2 FY18 EARNINGS PRESENTATION
Conclusion • Taking meaningful action to address period of slower growth and set up future growth • Protecting the base business with innovative, relevant and value-added services; increasing scope to remain sticky, and securing longer-term extensions • Future growth will require more than the same solutions for the same customers in the same markets. Advancing our plans for new solutions, adjacencies and platforms as markets evolve over time; this could include acquisitions, new service offerings or entry into additional geographies – or all of the above • Long history of delivering sustainable top line and bottom line growth and creating shareholder value • We are executing an actionable plan in order to return to growth and focus on: − Analyzing current markets where we could play a more meaningful role (including clinical solutions at scale) − Taking a fresh look at new, adjacent markets that hold promise − Making sure we have the right resources for the future (including new sales, technical and clinical talent) − And of course we will continue our focus on solid execution • Organizations must change over time; this may mean a slightly different direction to shape and meet demand, and drive growth. The core business is sound, we are executing well and our overarching thesis remains relevant • We see evidence that the long-term macro trends remain in our favor as governments seek better solutions to serve aging populations, people with more complex health care needs and barriers to sustainable employment, as well as addressing rising caseloads within budget constraints 17 | MAXIMUS: Q2 FY18 EARNINGS PRESENTATION