
1
Rick Nadeau
Chief Financial Officer
November 9, 2017
Helping Government Serve the People®
2
Forward-looking Statements & Non-GAAP Information
These slides should be read in conjunction with the Company’s most recent earnings press release, along with
listening to or reading a transcript of the comments of Company management from the Company’s most recent
quarterly earnings conference call.
This document may contain non-GAAP financial information. Management uses this information in its internal
analysis of results and believes that this information may be informative to investors in gauging the quality of our
financial performance, identifying trends in our results, and providing meaningful period-to-period comparisons.
These measures should be used in conjunction with, rather than instead of, their comparable GAAP measures. For
a reconciliation of non-GAAP measures to the comparable GAAP measures presented in this document, see the
Company’s most recent earnings press release.
Throughout this presentation, numbers may not add due to rounding.
A number of statements being made today will be forward-looking in nature. Such statements are only predictions
and actual events or results may differ materially as a result of risks we face, including those discussed in our SEC
filings. We encourage you to review the summary of these risks in Exhibit 99.1 to our most recent Form 10-K filed
with the SEC. The Company does not assume any obligation to revise or update these forward-looking statements
to reflect subsequent events or circumstances.
3
Total Company Results: Q4 FY17 Compared to Q4 FY16
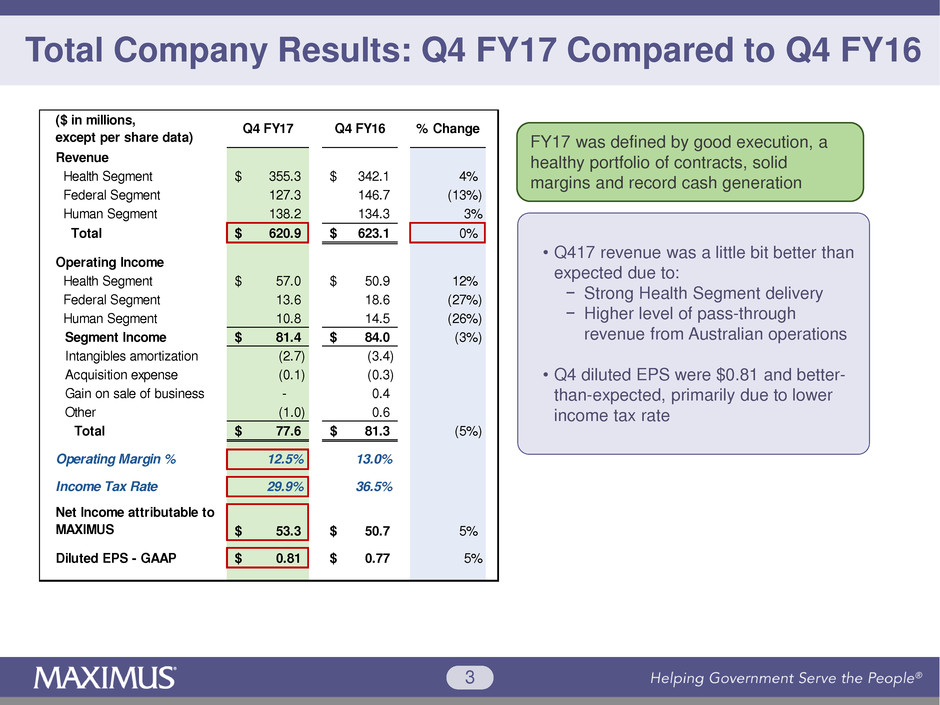
• Q417 revenue was a little bit better than
expected due to:
− Strong Health Segment delivery
− Higher level of pass-through
revenue from Australian operations
• Q4 diluted EPS were $0.81 and better-
than-expected, primarily due to lower
income tax rate
FY17 was defined by good execution, a
healthy portfolio of contracts, solid
margins and record cash generation
Revenue
Health Segment 355.3$ 342.1$ 4%
Federal Segment 127.3 146.7 (13%)
Human Segment 138.2 134.3 3%
Total 620.9$ 623.1$ 0%
Operating Income
Health Segment 57.0$ 50.9$ 12%
Federal Segment 13.6 18.6 (27%)
Human Segment 10.8 14.5 (26%)
Segment Income 81.4$ 84.0$ (3%)
Intangibles amortization (2.7) (3.4)
Acquisition expense (0.1) (0.3)
Gain on sale of business - 0.4
Other (1.0) 0.6
Total 77.6$ 81.3$ (5%)
Operating Margin % 12.5% 13.0%
Income Tax Rate 29.9% 36.5%
Net Income attributable to
MAXIMUS 53.3$ 50.7$ 5%
Diluted EPS - GAAP 0.81$ 0.77$ 5%
($ in millions,
except per share data)
Q4 FY17 Q4 FY16 % Change
4
Total Company Results: FY 2017 Compared to FY 2016
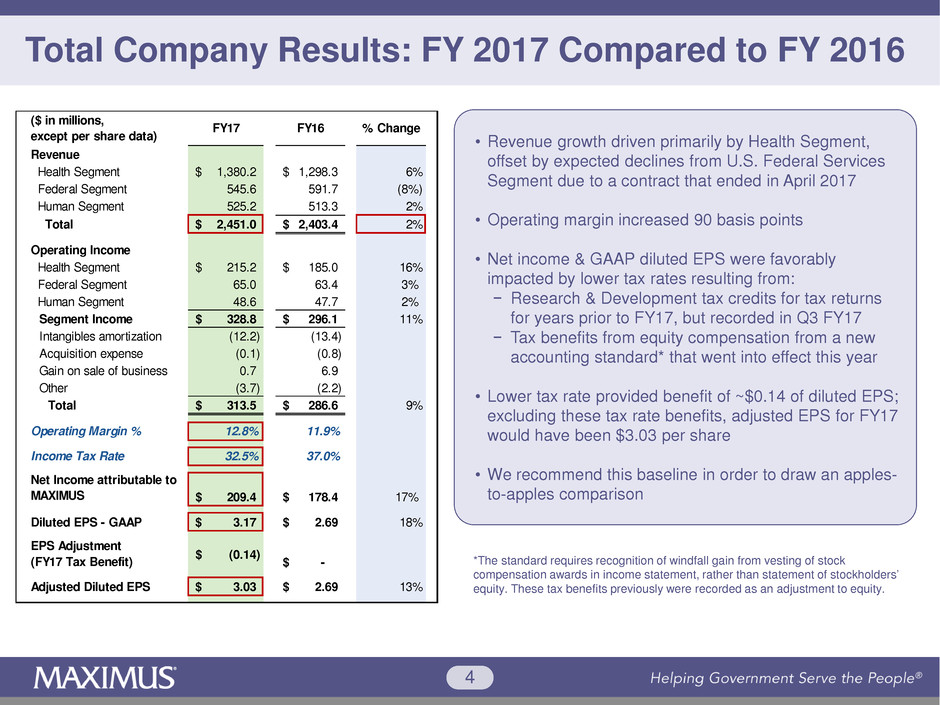
• Revenue growth driven primarily by Health Segment,
offset by expected declines from U.S. Federal Services
Segment due to a contract that ended in April 2017
• Operating margin increased 90 basis points
• Net income & GAAP diluted EPS were favorably
impacted by lower tax rates resulting from:
− Research & Development tax credits for tax returns
for years prior to FY17, but recorded in Q3 FY17
− Tax benefits from equity compensation from a new
accounting standard* that went into effect this year
• Lower tax rate provided benefit of ~$0.14 of diluted EPS;
excluding these tax rate benefits, adjusted EPS for FY17
would have been $3.03 per share
• We recommend this baseline in order to draw an apples-
to-apples comparison
*The standard requires recognition of windfall gain from vesting of stock
compensation awards in income statement, rather than statement of stockholders’
equity. These tax benefits previously were recorded as an adjustment to equity.
Revenue
Health Segment 1,380.2$ 1,298.3$ 6%
Federal Segment 545.6 591.7 (8%)
Human Segment 525.2 513.3 2%
Total 2,451.0$ 2,403.4$ 2%
Operating Income
Health Segment 215.2$ 185.0$ 16%
Federal Segment 65.0 63.4 3%
Human Segment 48.6 47.7 2%
Segment Income 328.8$ 296.1$ 11%
Intangibles amortization (12.2) (13.4)
Acquisition expense (0.1) (0.8)
Gain on sale of business 0.7 6.9
Other (3.7) (2.2)
Total 313.5$ 286.6$ 9%
Operating Margin % 12.8% 11.9%
Income Tax Rate 32.5% 37.0%
Net Income attributable to
MAXIMUS 209.4$ 178.4$ 17%
Diluted EPS - GAAP 3.17$ 2.69$ 18%
EPS Adjustment
(FY17 Tax Benefit) (0.14)$ -$
Adjusted Diluted EPS 3.03$ 2.69$ 13%
($ in millions,
except per share data)
FY17 FY16 % Change
5
Health Services Segment
Revenue
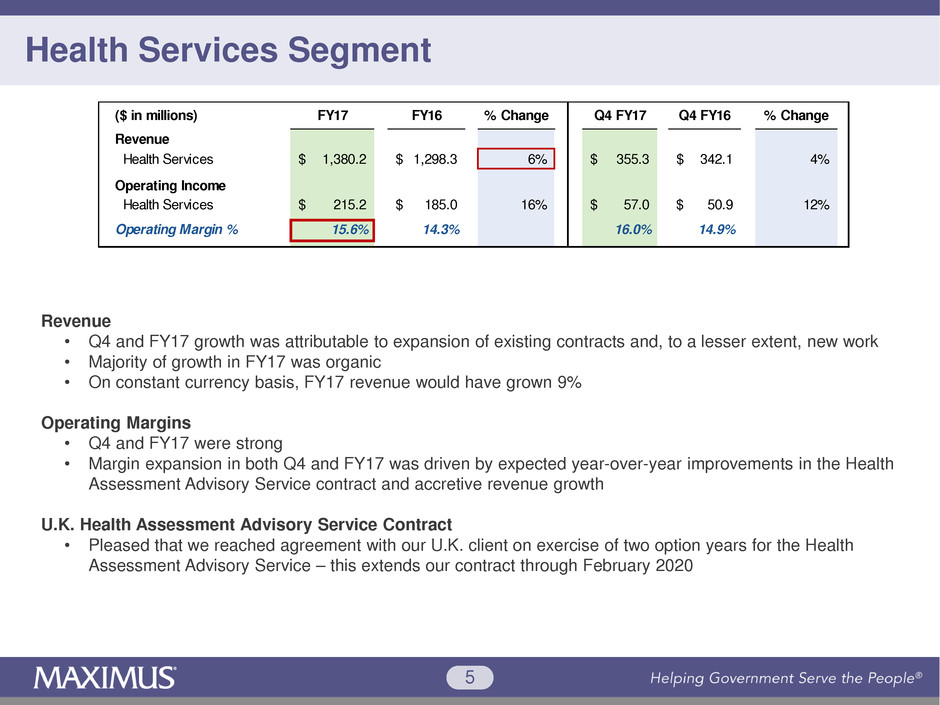
• Q4 and FY17 growth was attributable to expansion of existing contracts and, to a lesser extent, new work
• Majority of growth in FY17 was organic
• On constant currency basis, FY17 revenue would have grown 9%
Operating Margins
• Q4 and FY17 were strong
• Margin expansion in both Q4 and FY17 was driven by expected year-over-year improvements in the Health
Assessment Advisory Service contract and accretive revenue growth
U.K. Health Assessment Advisory Service Contract
• Pleased that we reached agreement with our U.K. client on exercise of two option years for the Health
Assessment Advisory Service – this extends our contract through February 2020
Revenue
Health Services 1,380.2$ 1,298.3$ 6% 355.3$ 342.1$ 4%
Operating Income
Health Services 215.2$ 185.0$ 16% 57.0$ 50.9$ 12%
Operating Margin % 15.6% 14.3% 16.0% 14.9%
% Change($ in millions) Q4 FY17 Q4 FY16 % ChangeFY17 FY16
6
U.S. Federal Services Segment
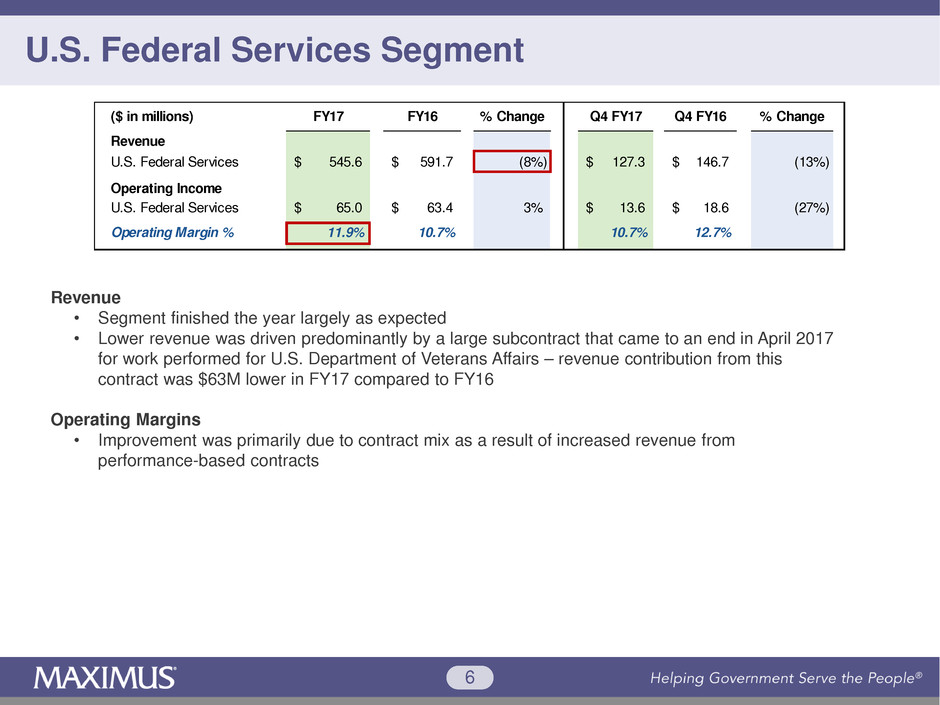
Revenue
• Segment finished the year largely as expected
• Lower revenue was driven predominantly by a large subcontract that came to an end in April 2017
for work performed for U.S. Department of Veterans Affairs – revenue contribution from this
contract was $63M lower in FY17 compared to FY16
Operating Margins
• Improvement was primarily due to contract mix as a result of increased revenue from
performance-based contracts
Revenue
U.S. Federal Services 545.6$ 591.7$ (8%) 127.3$ 146.7$ (13%)
Operating Income
U.S. Federal Services 65.0$ 63.4$ 3% 13.6$ 18.6$ (27%)
Operating Margin % 11.9% 10.7% 10.7% 12.7%
($ in millions) Q4 FY17 Q4 FY16 % ChangeFY17 FY16 % Change
7
Human Services Segment
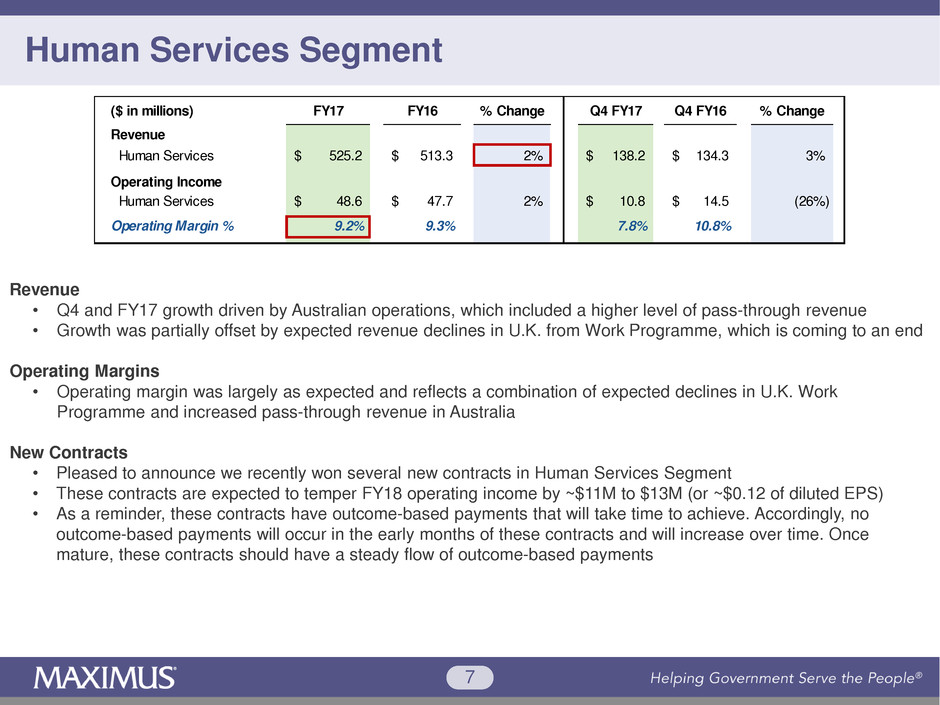
Revenue
• Q4 and FY17 growth driven by Australian operations, which included a higher level of pass-through revenue
• Growth was partially offset by expected revenue declines in U.K. from Work Programme, which is coming to an end
Operating Margins
• Operating margin was largely as expected and reflects a combination of expected declines in U.K. Work
Programme and increased pass-through revenue in Australia
New Contracts
• Pleased to announce we recently won several new contracts in Human Services Segment
• These contracts are expected to temper FY18 operating income by ~$11M to $13M (or ~$0.12 of diluted EPS)
• As a reminder, these contracts have outcome-based payments that will take time to achieve. Accordingly, no
outcome-based payments will occur in the early months of these contracts and will increase over time. Once
mature, these contracts should have a steady flow of outcome-based payments
Revenue
Human Services 525.2$ 513.3$ 2% 138.2$ 134.3$ 3%
Operating Income
Human Services 48.6$ 47.7$ 2% 10.8$ 14.5$ (26%)
Operating Margin % 9.2% 9.3% 7.8% 10.8%
% Change($ in millions) Q4 FY17 Q4 FY16 % ChangeFY17 FY16
8
DSOs and Cash Flows
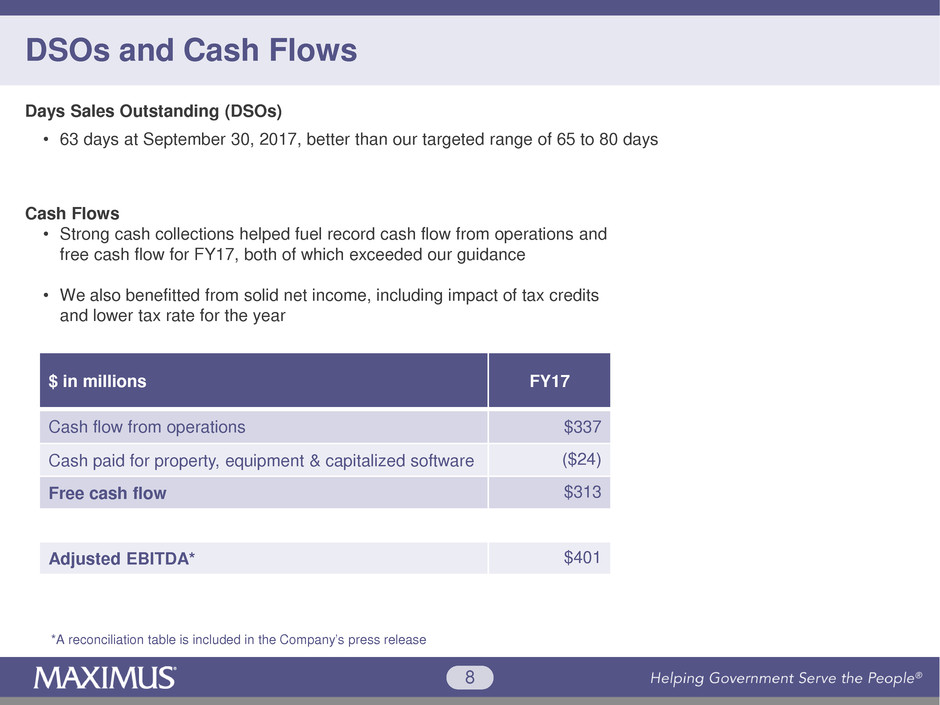
$ in millions FY17
Cash flow from operations $337
Cash paid for property, equipment & capitalized software ($24)
Free cash flow $313
Adjusted EBITDA* $401
Days Sales Outstanding (DSOs)
• 63 days at September 30, 2017, better than our targeted range of 65 to 80 days
Cash Flows
• Strong cash collections helped fuel record cash flow from operations and
free cash flow for FY17, both of which exceeded our guidance
• We also benefitted from solid net income, including impact of tax credits
and lower tax rate for the year
*A reconciliation table is included in the Company’s press release
9
Cash, Uses of Cash and Capital Allocation
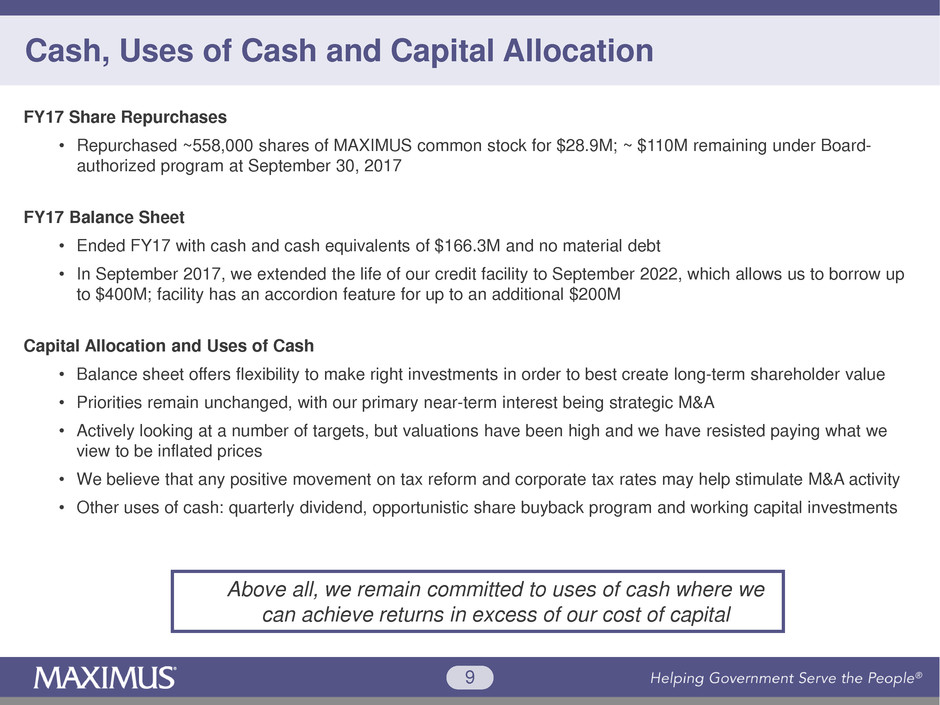
FY17 Share Repurchases
• Repurchased ~558,000 shares of MAXIMUS common stock for $28.9M; ~ $110M remaining under Board-
authorized program at September 30, 2017
FY17 Balance Sheet
• Ended FY17 with cash and cash equivalents of $166.3M and no material debt
• In September 2017, we extended the life of our credit facility to September 2022, which allows us to borrow up
to $400M; facility has an accordion feature for up to an additional $200M
Capital Allocation and Uses of Cash
• Balance sheet offers flexibility to make right investments in order to best create long-term shareholder value
• Priorities remain unchanged, with our primary near-term interest being strategic M&A
• Actively looking at a number of targets, but valuations have been high and we have resisted paying what we
view to be inflated prices
• We believe that any positive movement on tax reform and corporate tax rates may help stimulate M&A activity
• Other uses of cash: quarterly dividend, opportunistic share buyback program and working capital investments
Above all, we remain committed to uses of cash where we
can achieve returns in excess of our cost of capital
10
FY17 Actual Results Compared to FY18 Guidance
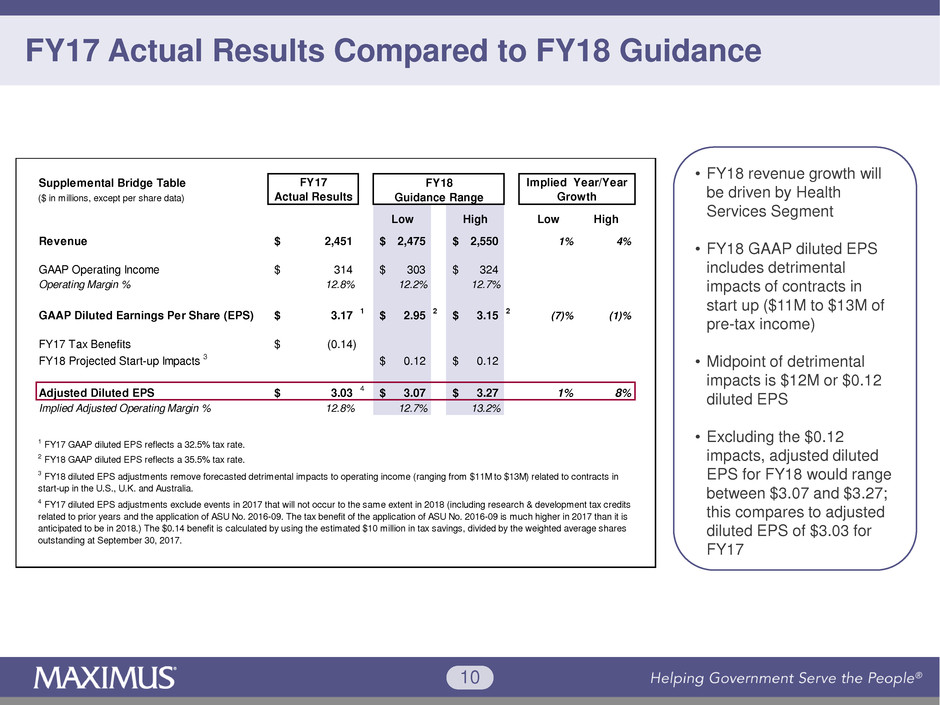
• FY18 revenue growth will
be driven by Health
Services Segment
• FY18 GAAP diluted EPS
includes detrimental
impacts of contracts in
start up ($11M to $13M of
pre-tax income)
• Midpoint of detrimental
impacts is $12M or $0.12
diluted EPS
• Excluding the $0.12
impacts, adjusted diluted
EPS for FY18 would range
between $3.07 and $3.27;
this compares to adjusted
diluted EPS of $3.03 for
FY17
Supplemental Bridge Table FY18
($ in millions, except per share data) Guidance Range
Revenue 2,451$ 2,475$ 2,550$ 1% 4%
GAAP Operating Income 314$ 303$ 324$
Operating Margin % 12.8% 12.2% 12.7%
GAAP Diluted Earnings Per Share (EPS) 3.17$ 1 2.95$ 2 3.15$ 2 (7)% (1)%
FY17 Tax Benefits (0.14)$
FY18 Projected Start-up Impacts 3 0.12$ 0.12$
Adjusted Diluted EPS 3.03$ 4 3.07$ 3.27$ 1% 8%
Implied Adjusted Operating Margin % 12.8% 12.7% 13.2%
1 FY17 GAAP diluted EPS reflects a 32.5% tax rate.
4 FY17 diluted EPS adjustments exclude events in 2017 that will not occur to the same extent in 2018 (including research & development tax credits
related to prior years and the application of ASU No. 2016-09. The tax benefit of the application of ASU No. 2016-09 is much higher in 2017 than it is
anticipated to be in 2018.) The $0.14 benefit is calculated by using the estimated $10 million in tax savings, divided by the weighted average shares
outstanding at September 30, 2017.
2 FY18 GAAP diluted EPS reflects a 35.5% tax rate.
3 FY18 diluted EPS adjustments remove forecasted detrimental impacts to operating income (ranging from $11M to $13M) related to contracts in
start-up in the U.S., U.K. and Australia.
FY17
Actual Results
Implied Year/Year
Growth
Low High Low High
11
Backlog, Quarterly Trends, Operating Margins
Backlog
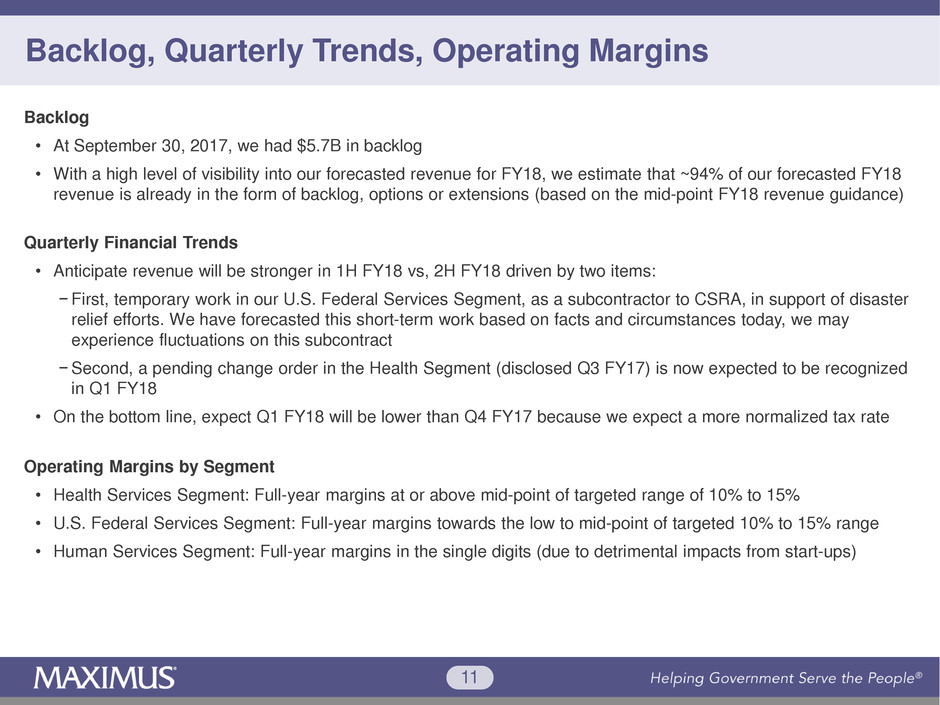
• At September 30, 2017, we had $5.7B in backlog
• With a high level of visibility into our forecasted revenue for FY18, we estimate that ~94% of our forecasted FY18
revenue is already in the form of backlog, options or extensions (based on the mid-point FY18 revenue guidance)
Quarterly Financial Trends
• Anticipate revenue will be stronger in 1H FY18 vs, 2H FY18 driven by two items:
− First, temporary work in our U.S. Federal Services Segment, as a subcontractor to CSRA, in support of disaster
relief efforts. We have forecasted this short-term work based on facts and circumstances today, we may
experience fluctuations on this subcontract
−Second, a pending change order in the Health Segment (disclosed Q3 FY17) is now expected to be recognized
in Q1 FY18
• On the bottom line, expect Q1 FY18 will be lower than Q4 FY17 because we expect a more normalized tax rate
Operating Margins by Segment
• Health Services Segment: Full-year margins at or above mid-point of targeted range of 10% to 15%
• U.S. Federal Services Segment: Full-year margins towards the low to mid-point of targeted 10% to 15% range
• Human Services Segment: Full-year margins in the single digits (due to detrimental impacts from start-ups)
12
Guidance Methodology & Natural Attrition
Attrition
• Vast majority of contracts provide highly visible recurring revenue streams; we also manage the impact
of normal course attrition each year
• Over last five years, we estimate revenue attrition impact from 5% to 10% each year
• For FY18 specifically, three main attrition factors:
1. Rebid losses or work that is going away. This includes acquired Acentia work (U.S. Federal
Segment) where we are no longer able to bid some of this work because the contracts are
designated for small businesses. At this point, most of this has rolled off.
2. Work that has been rebid or extended but at a lower rate
3. Forecasted changes in volumes
This is an important element to consider when investors are modeling our results.
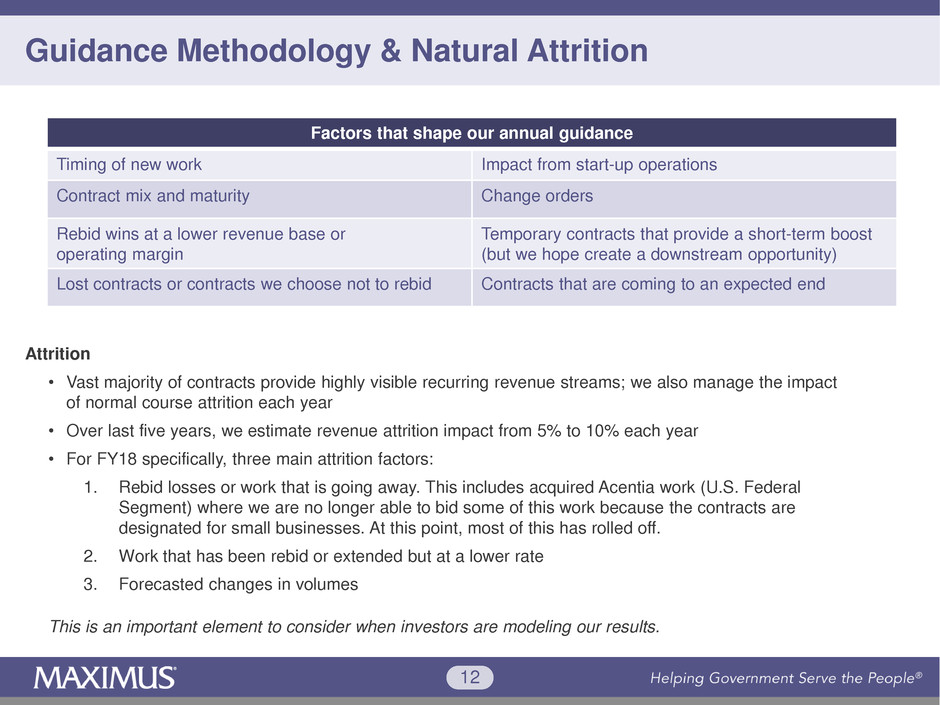
Factors that shape our annual guidance
Timing of new work Impact from start-up operations
Contract mix and maturity Change orders
Rebid wins at a lower revenue base or
operating margin
Temporary contracts that provide a short-term boost
(but we hope create a downstream opportunity)
Lost contracts or contracts we choose not to rebid Contracts that are coming to an expected end
13
Income Tax Rate Estimate & Cash Flow Guidance
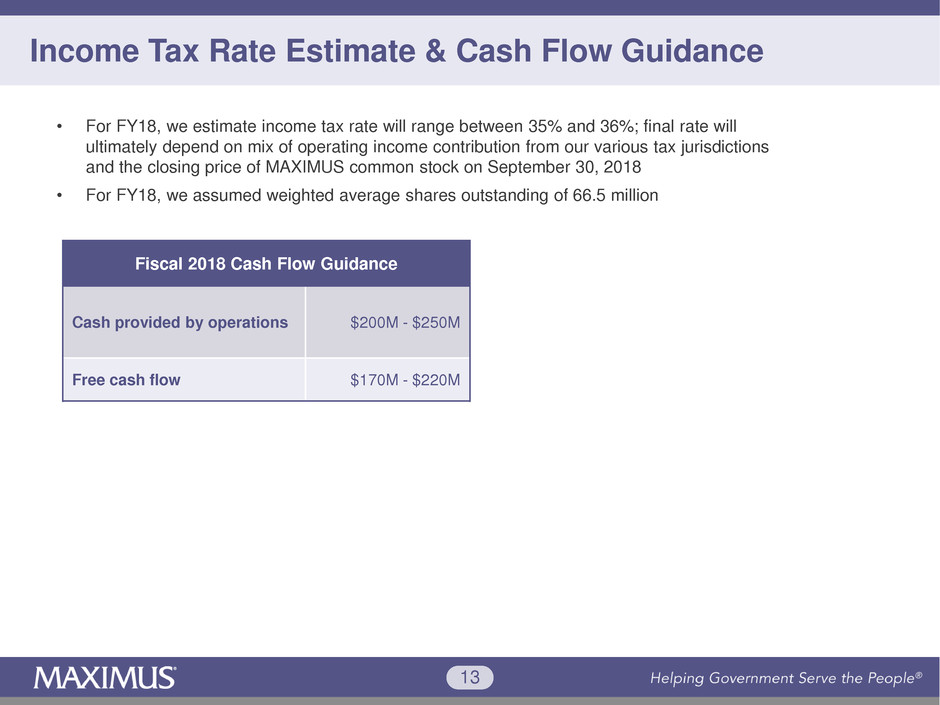
Fiscal 2018 Cash Flow Guidance
Cash provided by operations $200M - $250M
Free cash flow $170M - $220M
• For FY18, we estimate income tax rate will range between 35% and 36%; final rate will
ultimately depend on mix of operating income contribution from our various tax jurisdictions
and the closing price of MAXIMUS common stock on September 30, 2018
• For FY18, we assumed weighted average shares outstanding of 66.5 million
14
Richard Montoni
Chief Executive Officer
November 9, 2017
Helping Government Serve the People®
15
Finished FY17 on Firm Footing
• Finished 2017 on firm footing, with healthy
operating margins and record cash flow
• Today’s presentation will cover:
− ACA open enrollment period
− New work awards that provide paths to
long-term growth
− Successful rebids that help protect the base
16
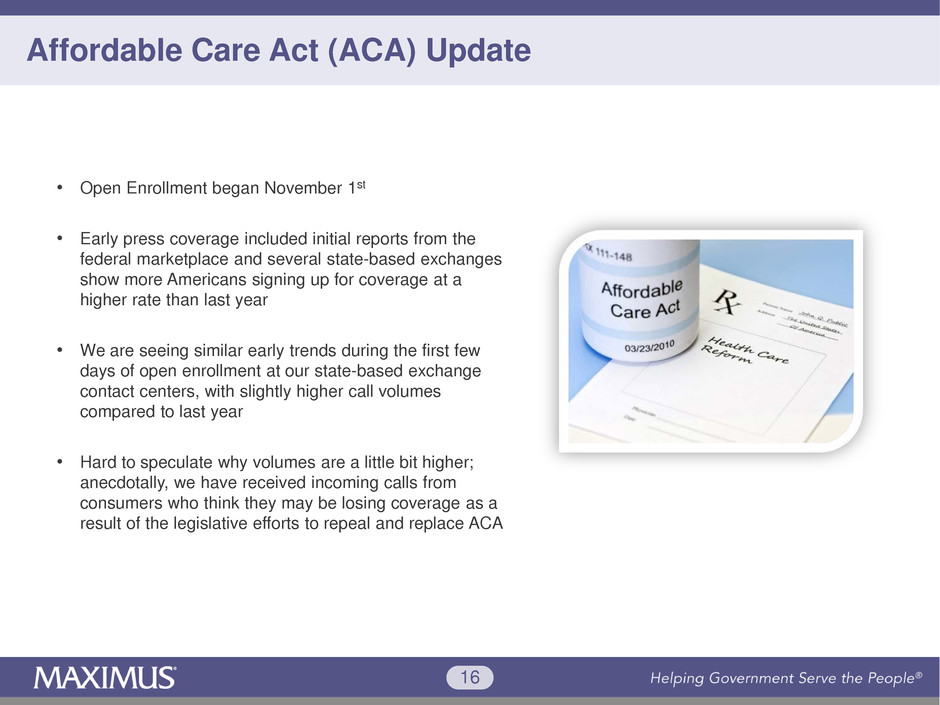
Affordable Care Act (ACA) Update
• Open Enrollment began November 1st
• Early press coverage included initial reports from the
federal marketplace and several state-based exchanges
show more Americans signing up for coverage at a
higher rate than last year
• We are seeing similar early trends during the first few
days of open enrollment at our state-based exchange
contact centers, with slightly higher call volumes
compared to last year
• Hard to speculate why volumes are a little bit higher;
anecdotally, we have received incoming calls from
consumers who think they may be losing coverage as a
result of the legislative efforts to repeal and replace ACA
17
New LTSS and Workforce Contracts
Expanded Long-Term Services & Supports Business
• Won three new contracts for pre-admission screening
and resident review (PASRR) services
• Assessments help ensure appropriate placements in a
nursing facility or community-based setting and that
individuals receive required services, regardless of
placement
• Awaiting final execution of each contract and are
unable to share financial details
• These key wins enhance our position as a leading
provider of LTSS assessments
Actively planting seeds for long-term growth; for example, applying core competencies to new programs and clients
Launched Indiana Workforce Services Project
• Six-year, ~$50M statewide contract
• Case management, employment and retention
services to public program beneficiaries
• Indiana has a pending waiver to move its
voluntary Medicaid work requirement to one that
is mandatory for certain beneficiary populations
• New contract is not related to Medicaid work
requirements, but MAXIMUS now offers both
health and human services in a state that has
been at the forefront of work requirements
18
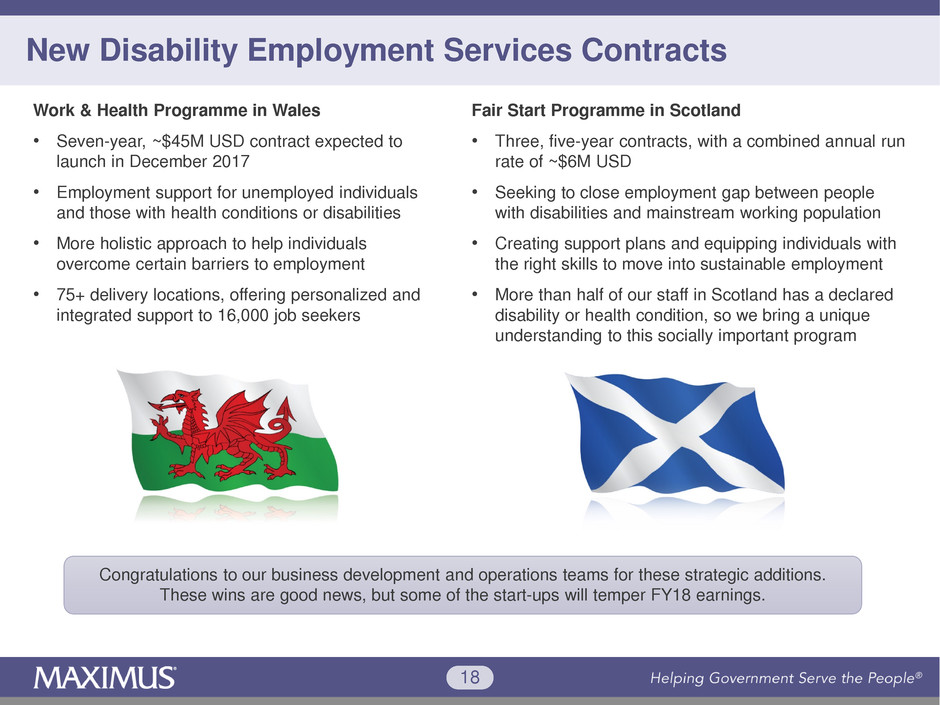
New Disability Employment Services Contracts
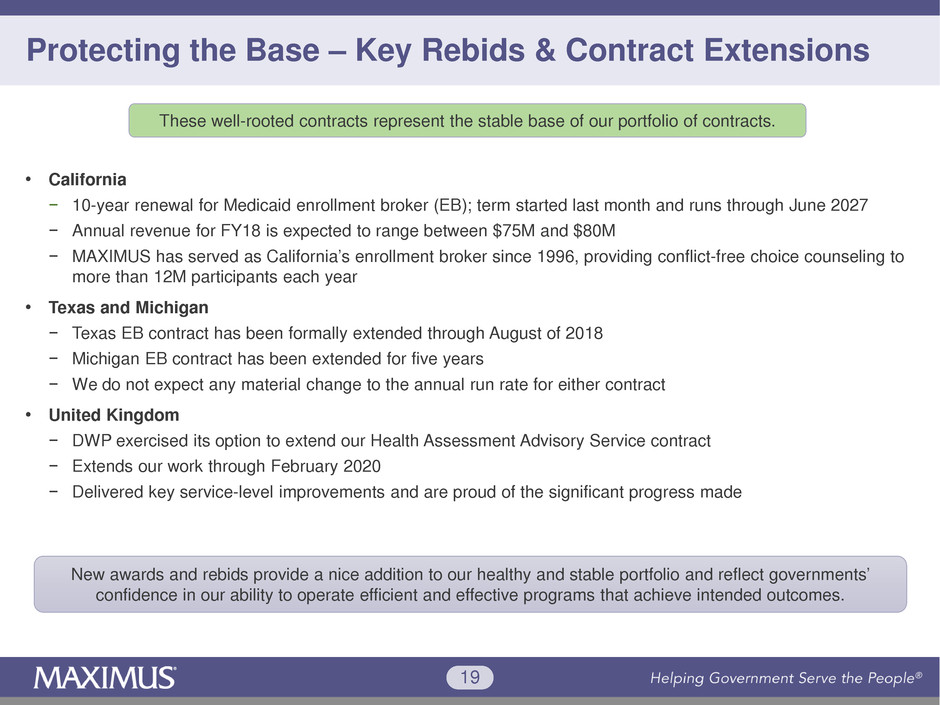
Work & Health Programme in Wales
• Seven-year, ~$45M USD contract expected to
launch in December 2017
• Employment support for unemployed individuals
and those with health conditions or disabilities
• More holistic approach to help individuals
overcome certain barriers to employment
• 75+ delivery locations, offering personalized and
integrated support to 16,000 job seekers
Congratulations to our business development and operations teams for these strategic additions.
These wins are good news, but some of the start-ups will temper FY18 earnings.
Fair Start Programme in Scotland
• Three, five-year contracts, with a combined annual run
rate of ~$6M USD
• Seeking to close employment gap between people
with disabilities and mainstream working population
• Creating support plans and equipping individuals with
the right skills to move into sustainable employment
• More than half of our staff in Scotland has a declared
disability or health condition, so we bring a unique
understanding to this socially important program
19
Protecting the Base – Key Rebids & Contract Extensions
• California
− 10-year renewal for Medicaid enrollment broker (EB); term started last month and runs through June 2027
− Annual revenue for FY18 is expected to range between $75M and $80M
− MAXIMUS has served as California’s enrollment broker since 1996, providing conflict-free choice counseling to
more than 12M participants each year
• Texas and Michigan
− Texas EB contract has been formally extended through August of 2018
− Michigan EB contract has been extended for five years
− We do not expect any material change to the annual run rate for either contract
• United Kingdom
− DWP exercised its option to extend our Health Assessment Advisory Service contract
− Extends our work through February 2020
− Delivered key service-level improvements and are proud of the significant progress made
New awards and rebids provide a nice addition to our healthy and stable portfolio and reflect governments’
confidence in our ability to operate efficient and effective programs that achieve intended outcomes.
These well-rooted contracts represent the stable base of our portfolio of contracts.
20
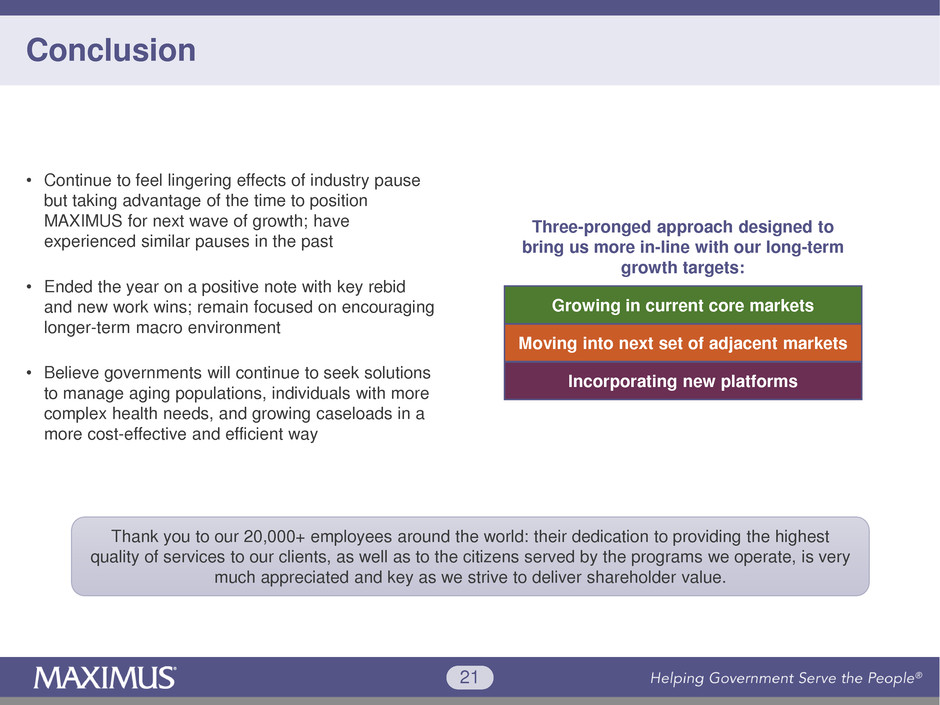
New Awards September 30, 2017
YTD Signed Contracts $2.8B
Additional Unsigned Contracts $1.3B
Sales Opportunities September 30, 2017
Total Pipeline* $2.4B
* Reported pipeline only reflects short-term opportunities where we believe
request for proposals will be released within next six months
New Awards, Sales Pipeline & Rebids
In Q4 signed $1B of awards
Pipeline Comparison: New Work vs Recurring Work
Pipeline: Looking forward
Our analysis of our longer-term pipeline indicates that
our reported pipeline will return to more normalized
levels next quarter
In Q4 notified of award on another $1B of pending
contracts driven by California and Michigan rebids
Pipeline sequentially lower due to high level of work
converted into awards; backfilled pipeline with just under
$1B of additional opportunities that we are now tracking
Rebids:
• Won or were extended on vast majority of
our FY17 rebids (including three largest
opportunities); a few are still pending
• FY18 is shaping up to be a typical year in
terms of rebids with ~$850M of total base
contract value up for rebid in FY18
Total Pipeline New Recurring
Q3 FY17 $3.3B $1.3B $2.0B
Q4 FY17 $2.4B $1.4B $1.0B
21
Conclusion
• Continue to feel lingering effects of industry pause
but taking advantage of the time to position
MAXIMUS for next wave of growth; have
experienced similar pauses in the past
• Ended the year on a positive note with key rebid
and new work wins; remain focused on encouraging
longer-term macro environment
• Believe governments will continue to seek solutions
to manage aging populations, individuals with more
complex health needs, and growing caseloads in a
more cost-effective and efficient way
Growing in current core markets
Moving into next set of adjacent markets
Incorporating new platforms
Three-pronged approach designed to
bring us more in-line with our long-term
growth targets:
Thank you to our 20,000+ employees around the world: their dedication to providing the highest
quality of services to our clients, as well as to the citizens served by the programs we operate, is very
much appreciated and key as we strive to deliver shareholder value.