1
Rick Nadeau
Chief Financial Officer
May 4, 2017
Helping Government Serve the People®
2
Forward-looking Statements & Non-GAAP Information
These slides should be read in conjunction with the Company’s most recent quarterly earnings press release, along
with listening to or reading a transcript of the comments of Company management from the Company’s most recent
quarterly earnings conference call.
This document may contain non-GAAP financial information. Management uses this information in its internal
analysis of results and believes that this information may be informative to investors in gauging the quality of our
financial performance, identifying trends in our results, and providing meaningful period-to-period comparisons.
These measures should be used in conjunction with, rather than instead of, their comparable GAAP measures. For
a reconciliation of non-GAAP measures to the comparable GAAP measures presented in this document, see the
Company’s most recent quarterly earnings press release.
Throughout this presentation, numbers may not add due to rounding.
A number of statements being made today will be forward-looking in nature. Such statements are only predictions
and actual events or results may differ materially as a result of risks we face, including those discussed in our SEC
filings. We encourage you to review the summary of these risks in Exhibit 99.1 to our most recent Form 10-K filed
with the SEC. The Company does not assume any obligation to revise or update these forward-looking statements
to reflect subsequent events or circumstances.
3
Total Company Results – Second Quarter of FY 2017
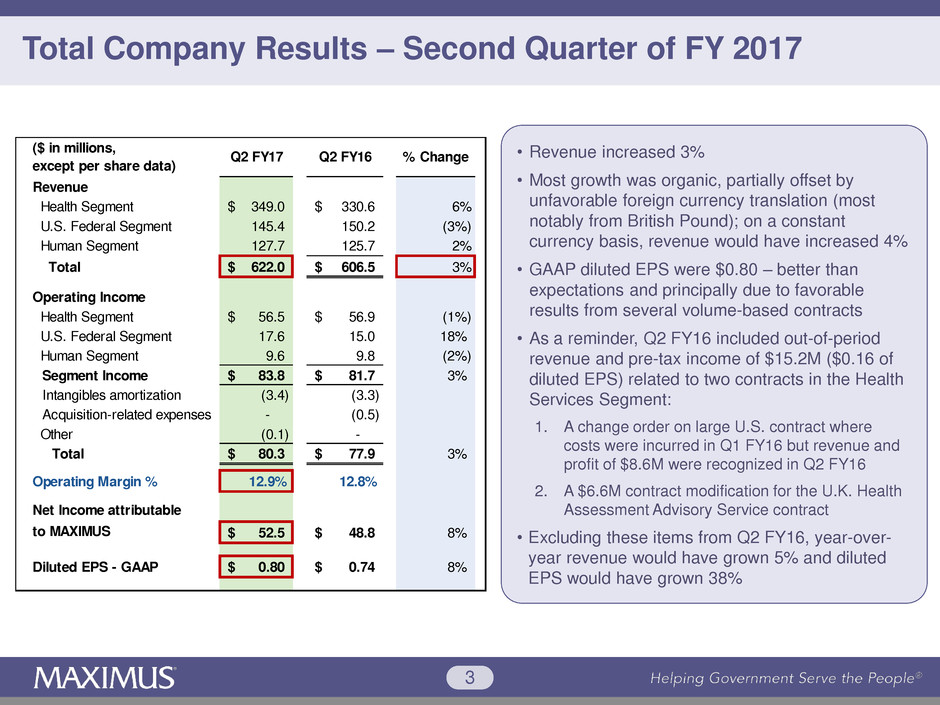
• Revenue increased 3%
• Most growth was organic, partially offset by
unfavorable foreign currency translation (most
notably from British Pound); on a constant
currency basis, revenue would have increased 4%
• GAAP diluted EPS were $0.80 – better than
expectations and principally due to favorable
results from several volume-based contracts
• As a reminder, Q2 FY16 included out-of-period
revenue and pre-tax income of $15.2M ($0.16 of
diluted EPS) related to two contracts in the Health
Services Segment:
1. A change order on large U.S. contract where
costs were incurred in Q1 FY16 but revenue and
profit of $8.6M were recognized in Q2 FY16
2. A $6.6M contract modification for the U.K. Health
Assessment Advisory Service contract
• Excluding these items from Q2 FY16, year-over-
year revenue would have grown 5% and diluted
EPS would have grown 38%
Revenue
Health Segment 349.0$ 330.6$ 6%
U.S. Federal Segment 145.4 150.2 (3%)
Human Segment 127.7 125.7 2%
Total 622.0$ 606.5$ 3%
Operating Income
Health Segment 56.5$ 56.9$ (1%)
U.S. Federal Segment 17.6 15.0 18%
Human Segment 9.6 9.8 (2%)
Segment Income 83.8$ 81.7$ 3%
Intangibles amortization (3.4) (3.3)
Acquisition-related expenses - (0.5)
Other (0.1) -
Total 80.3$ 77.9$ 3%
Operating Margin % 12.9% 12.8%
Net Income attributabl
to MAXIMUS 52.5$ 48.8$ 8%
Diluted EPS - G AP 0.80$ 0.74$ 8%
($ in millions,
except per share data)
Q2 FY17 Q2 FY16 % Change
4
Health Services Segment
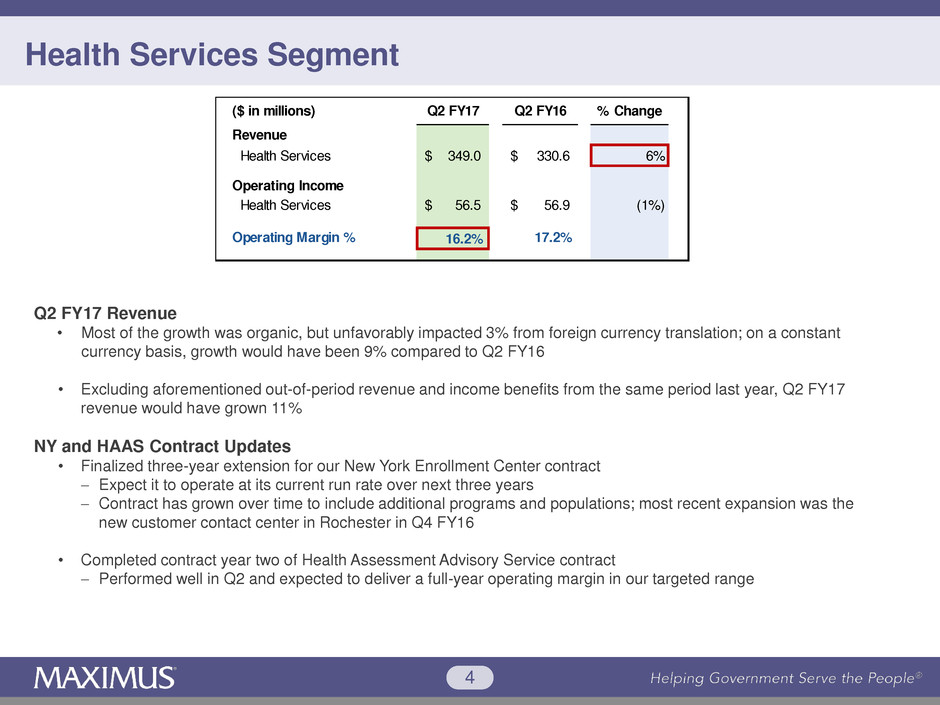
Q2 FY17 Revenue
• Most of the growth was organic, but unfavorably impacted 3% from foreign currency translation; on a constant
currency basis, growth would have been 9% compared to Q2 FY16
• Excluding aforementioned out-of-period revenue and income benefits from the same period last year, Q2 FY17
revenue would have grown 11%
NY and HAAS Contract Updates
• Finalized three-year extension for our New York Enrollment Center contract
Expect it to operate at its current run rate over next three years
Contract has grown over time to include additional programs and populations; most recent expansion was the
new customer contact center in Rochester in Q4 FY16
• Completed contract year two of Health Assessment Advisory Service contract
Performed well in Q2 and expected to deliver a full-year operating margin in our targeted range
Revenue
Health Services 349.0$ 330.6$ 6%
Operating Income
Health Services 56.5$ 56.9$ (1%)
Operating Margin % 16.2% 17.2%
($ in millions) Q2 FY17 Q2 FY16 % Change

5
U.S. Federal Services Segment
Q2 FY17 Revenue
• As expected, revenue decreased 3% compared to Q2 FY16
• Disclosed last quarter, largest driver for revenue decline was ramp down of work for U.S. Department of Veterans
Affairs that ended in April
Q2 FY17 Operating Margin
• Better than our expectations, driven by favorable results in several volume-based contracts
Revenue
U.S. Federal Services 145.4$ 150.2$ (3%)
Operating Income
U.S. Federal Services 17.6$ 15.0$ 18%
Operating Margin % 12.1% 10.0%
($ in millions) Q2 FY17 Q2 FY16 % Change
6
Human Services Segment
Q2 FY17 Revenue
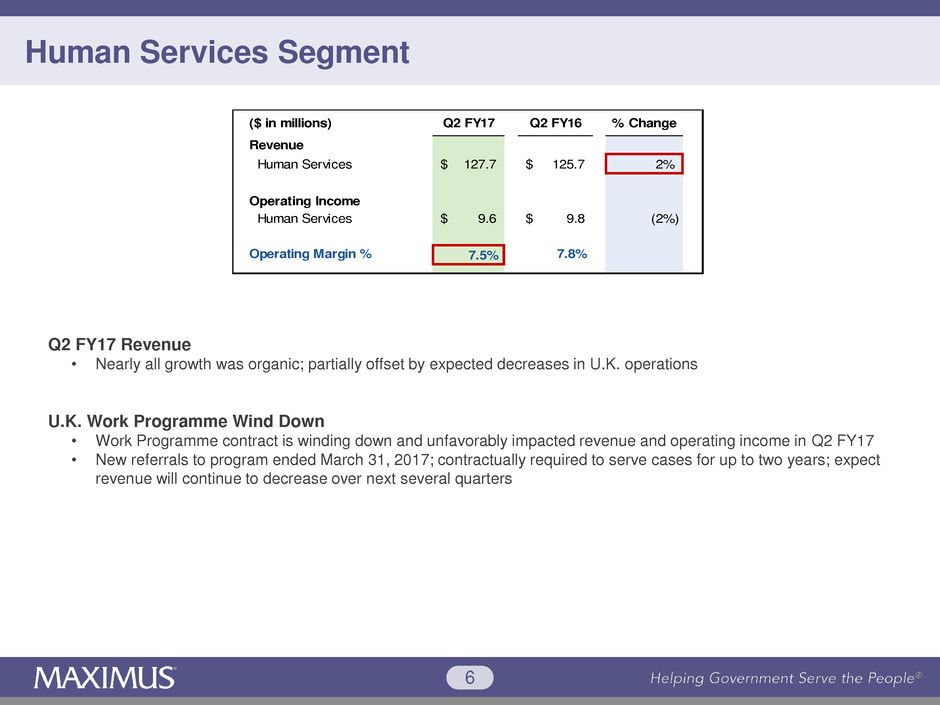
• Nearly all growth was organic; partially offset by expected decreases in U.K. operations
U.K. Work Programme Wind Down
• Work Programme contract is winding down and unfavorably impacted revenue and operating income in Q2 FY17
• New referrals to program ended March 31, 2017; contractually required to serve cases for up to two years; expect
revenue will continue to decrease over next several quarters
Revenue
Human Services 127.7$ 125.7$ 2%
Operating Income
Human Services 9.6$ 9.8$ (2%)
Operating Margin % 7.5% 7.8%
($ in millions) Q2 FY17 Q2 FY16 % Change
7
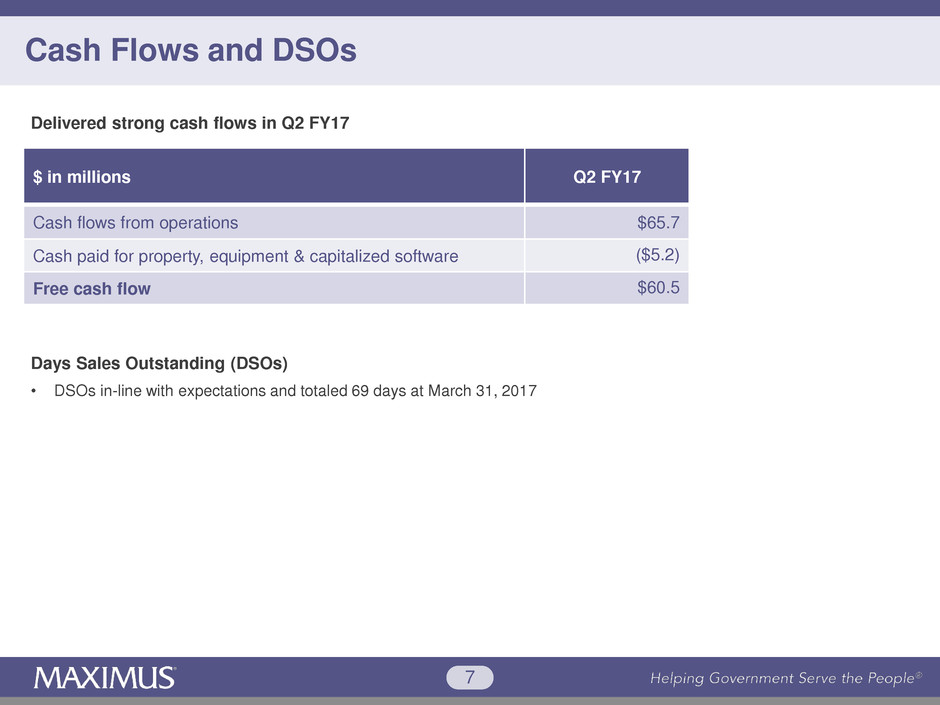
Cash Flows and DSOs
$ in millions Q2 FY17
Cash flows from operations $65.7
Cash paid for property, equipment & capitalized software ($5.2)
Free cash flow $60.5
Days Sales Outstanding (DSOs)
• DSOs in-line with expectations and totaled 69 days at March 31, 2017
Delivered strong cash flows in Q2 FY17
8
Cash, Uses of Cash and Capital Allocation
Long-Term Debt Payments
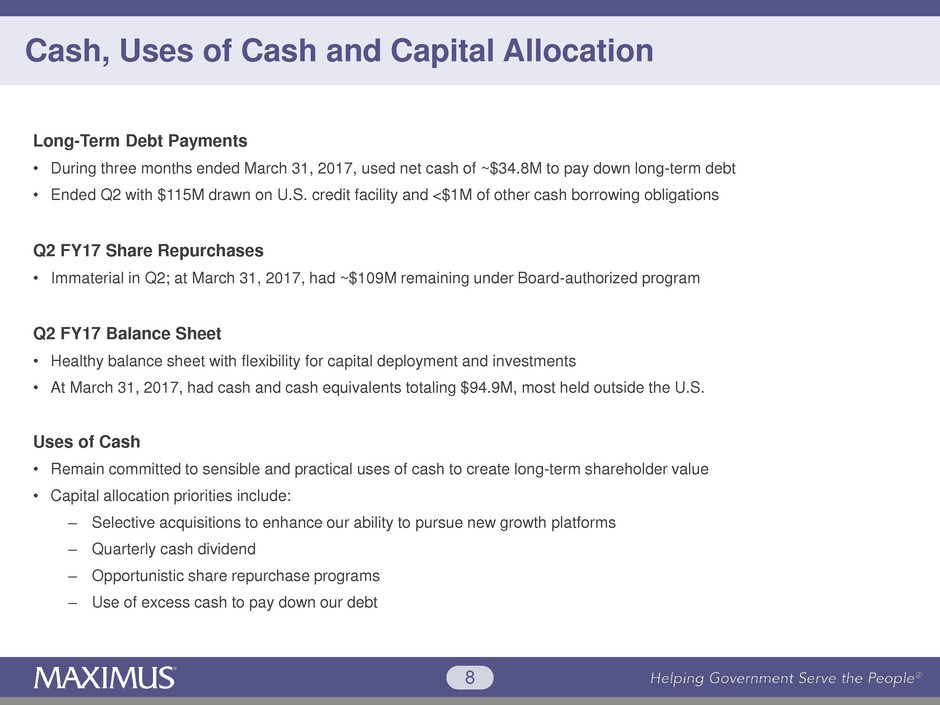
• During three months ended March 31, 2017, used net cash of ~$34.8M to pay down long-term debt
• Ended Q2 with $115M drawn on U.S. credit facility and <$1M of other cash borrowing obligations
Q2 FY17 Share Repurchases
• Immaterial in Q2; at March 31, 2017, had ~$109M remaining under Board-authorized program
Q2 FY17 Balance Sheet
• Healthy balance sheet with flexibility for capital deployment and investments
• At March 31, 2017, had cash and cash equivalents totaling $94.9M, most held outside the U.S.
Uses of Cash
• Remain committed to sensible and practical uses of cash to create long-term shareholder value
• Capital allocation priorities include:
‒ Selective acquisitions to enhance our ability to pursue new growth platforms
‒ Quarterly cash dividend
‒ Opportunistic share repurchase programs
‒ Use of excess cash to pay down our debt
9
Guidance
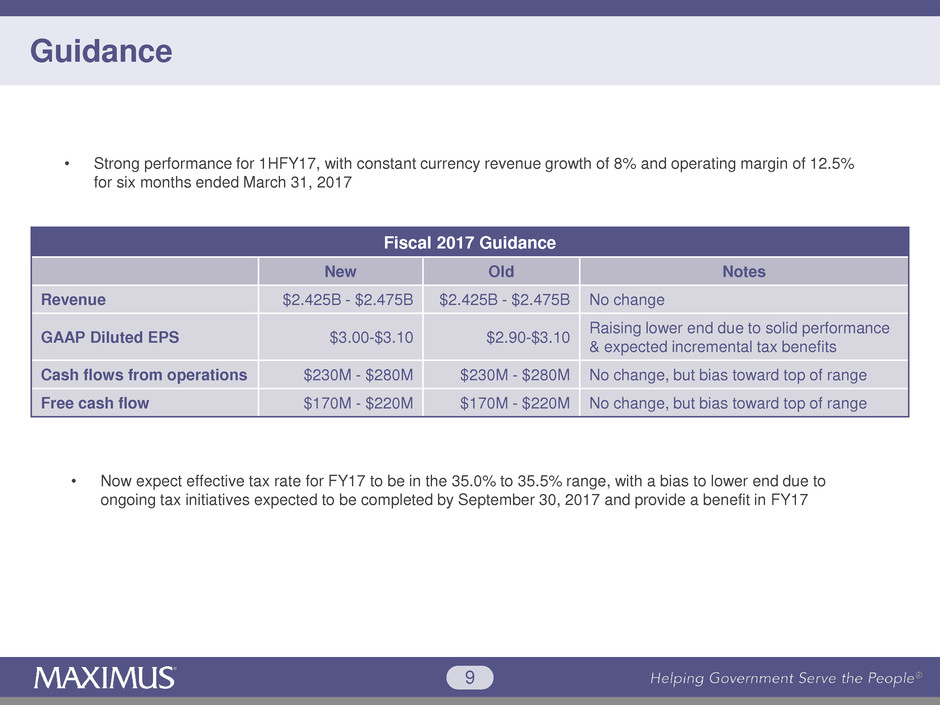
Fiscal 2017 Guidance
New Old Notes
Revenue $2.425B - $2.475B $2.425B - $2.475B No change
GAAP Diluted EPS $3.00-$3.10 $2.90-$3.10
Raising lower end due to solid performance
& expected incremental tax benefits
Cash flows from operations $230M - $280M $230M - $280M No change, but bias toward top of range
Free cash flow $170M - $220M $170M - $220M No change, but bias toward top of range
• Now expect effective tax rate for FY17 to be in the 35.0% to 35.5% range, with a bias to lower end due to
ongoing tax initiatives expected to be completed by September 30, 2017 and provide a benefit in FY17
• Strong performance for 1HFY17, with constant currency revenue growth of 8% and operating margin of 12.5%
for six months ended March 31, 2017
10
Richard Montoni
Chief Executive Officer
May 4, 2017
Helping Government Serve the People®
11
Solid Results & On Track to Achieve FY17 Objectives
• Solid results in Q2 confirm that we remain
on track to achieve our financial and
operational objectives for FY17
• Land and expand remains an important
element of our long-term growth strategy
• Today, we will provide some additional color
on a contract extension in New York and an
update of our United Kingdom operations
12
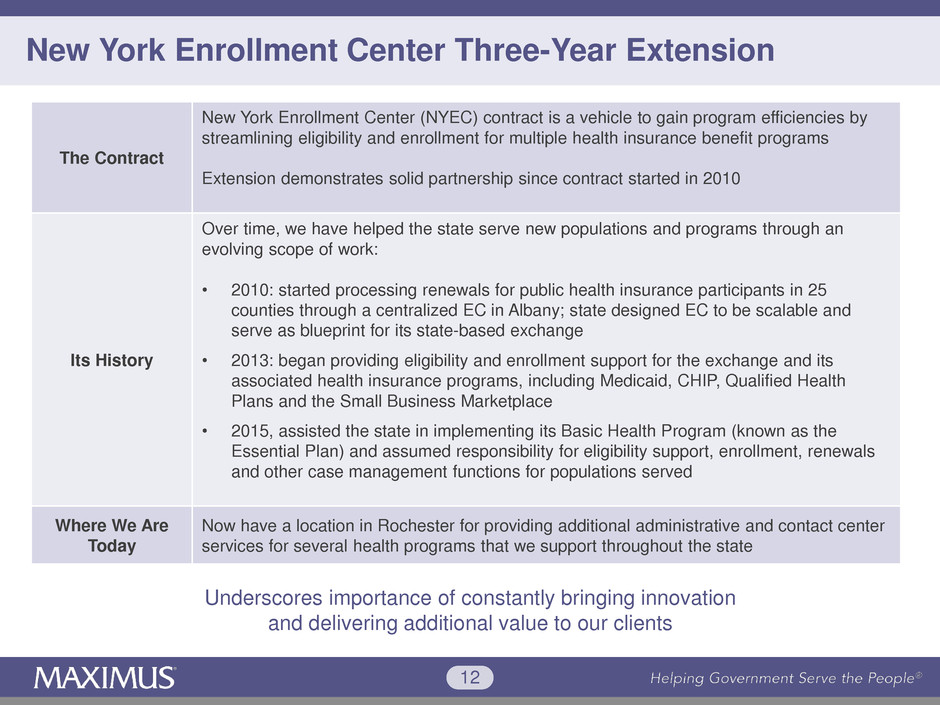
New York Enrollment Center Three-Year Extension
The Contract
New York Enrollment Center (NYEC) contract is a vehicle to gain program efficiencies by
streamlining eligibility and enrollment for multiple health insurance benefit programs
Extension demonstrates solid partnership since contract started in 2010
Its History
Over time, we have helped the state serve new populations and programs through an
evolving scope of work:
• 2010: started processing renewals for public health insurance participants in 25
counties through a centralized EC in Albany; state designed EC to be scalable and
serve as blueprint for its state-based exchange
• 2013: began providing eligibility and enrollment support for the exchange and its
associated health insurance programs, including Medicaid, CHIP, Qualified Health
Plans and the Small Business Marketplace
• 2015, assisted the state in implementing its Basic Health Program (known as the
Essential Plan) and assumed responsibility for eligibility support, enrollment, renewals
and other case management functions for populations served
Where We Are
Today
Now have a location in Rochester for providing additional administrative and contact center
services for several health programs that we support throughout the state
Underscores importance of constantly bringing innovation
and delivering additional value to our clients
13
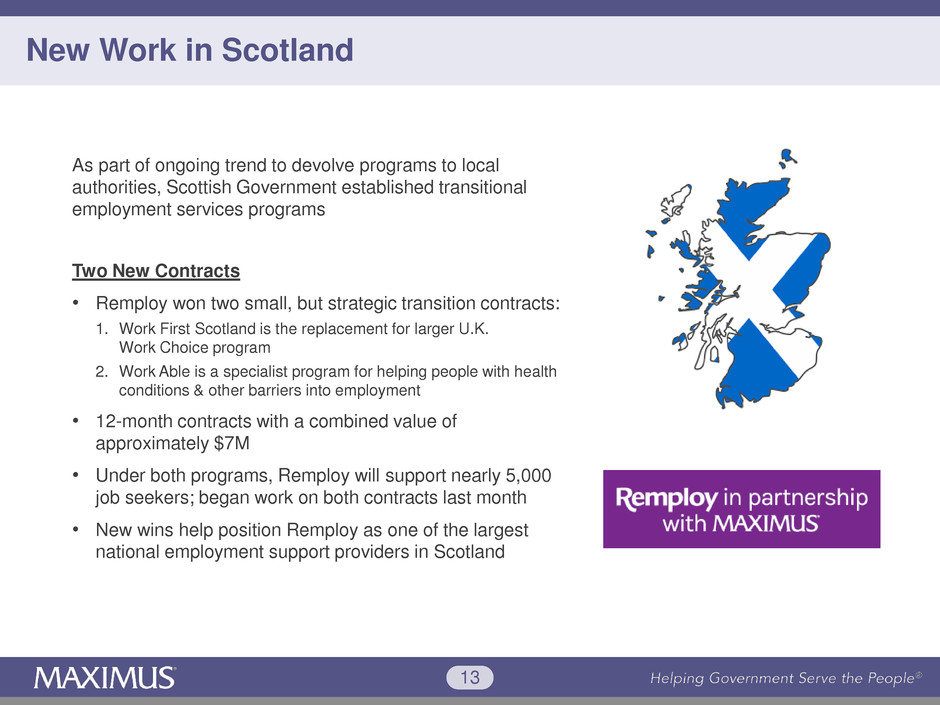
New Work in Scotland
As part of ongoing trend to devolve programs to local
authorities, Scottish Government established transitional
employment services programs
Two New Contracts
• Remploy won two small, but strategic transition contracts:
1. Work First Scotland is the replacement for larger U.K.
Work Choice program
2. Work Able is a specialist program for helping people with health
conditions & other barriers into employment
• 12-month contracts with a combined value of
approximately $7M
• Under both programs, Remploy will support nearly 5,000
job seekers; began work on both contracts last month
• New wins help position Remploy as one of the largest
national employment support providers in Scotland
14
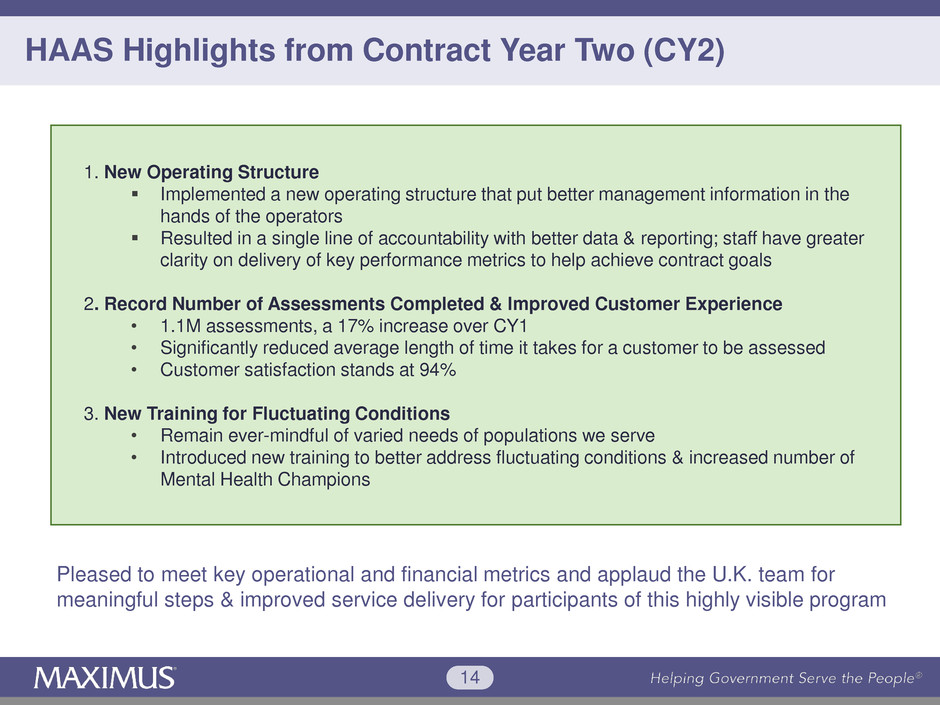
HAAS Highlights from Contract Year Two (CY2)
1. New Operating Structure
Implemented a new operating structure that put better management information in the
hands of the operators
Resulted in a single line of accountability with better data & reporting; staff have greater
clarity on delivery of key performance metrics to help achieve contract goals
2. Record Number of Assessments Completed & Improved Customer Experience
• 1.1M assessments, a 17% increase over CY1
• Significantly reduced average length of time it takes for a customer to be assessed
• Customer satisfaction stands at 94%
3. New Training for Fluctuating Conditions
• Remain ever-mindful of varied needs of populations we serve
• Introduced new training to better address fluctuating conditions & increased number of
Mental Health Champions
Pleased to meet key operational and financial metrics and applaud the U.K. team for
meaningful steps & improved service delivery for participants of this highly visible program

15
New Awards March 31, 2017
YTD Signed Contracts $1.5B
Additional Unsigned Contracts $155M
Sales Opportunities March 31, 2017
Total Pipeline* $3.3B
* Reported pipeline only reflects short-term opportunities where we
believe request for proposals will be released within next six months
New Awards & Sales Pipeline
• With NYEC contract extension, YTD signed
contracts were strong.
• Sequential pipeline decline due in large part to a
high value of contracts converting from pipeline to
awards (NYEC)
• Continue to see some procurement delays and
other normal-course fluctuations (losses,
cancellations and no bids)
• Of the $3.3B pipeline, roughly half is new work
and reflects opportunities across all three
segments and our current geographies
Conversion of sales pipeline into future revenue growth will ultimately depend upon
win rates, timing of awards, how they ramp up, and the rate of recurring revenue
16
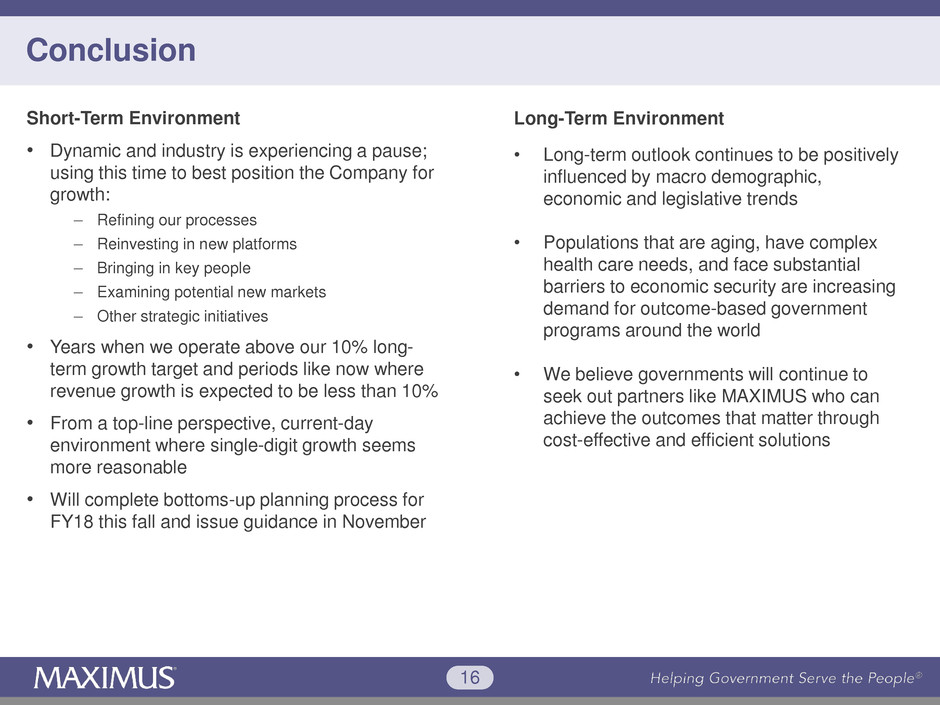
Conclusion
Short-Term Environment
• Dynamic and industry is experiencing a pause;
using this time to best position the Company for
growth:
Refining our processes
Reinvesting in new platforms
Bringing in key people
Examining potential new markets
Other strategic initiatives
• Years when we operate above our 10% long-
term growth target and periods like now where
revenue growth is expected to be less than 10%
• From a top-line perspective, current-day
environment where single-digit growth seems
more reasonable
• Will complete bottoms-up planning process for
FY18 this fall and issue guidance in November
Long-Term Environment
• Long-term outlook continues to be positively
influenced by macro demographic,
economic and legislative trends
• Populations that are aging, have complex
health care needs, and face substantial
barriers to economic security are increasing
demand for outcome-based government
programs around the world
• We believe governments will continue to
seek out partners like MAXIMUS who can
achieve the outcomes that matter through
cost-effective and efficient solutions